 Open Access Article
Creative Commons Attribution 3.0 Unported Licence
Resolving charge-transfer and mass-transfer processes of VO2+/VO2+ redox species across the electrode/electrolyte interface using electrochemical impedance spectroscopy for vanadium redox flow battery†
Pradipkumar Leuaaa,
Divya Priyadarshanib,
Debittree Choudhurya,
Rajan Mauryaa and
Manoj Neergat *a
*a
aDepartment of Energy Science and Engineering, Indian Institute of Technology Bombay (IITB), Powai, Mumbai 400076, India. E-mail: nmanoj@iitb.ac.in; Fax: +91 22 2576 4890; Tel: +91 22 2576 7893
bCentre for Research in Nanotechnology & Science, Indian Institute of Technology Bombay (IITB), Powai, Mumbai 400076, India
First published on 20th August 2020
Abstract
Electrochemical impedance spectroscopy is used to investigate the charge-transfer and mass-transfer processes of VO2+/VO2+ (V4+/V5+) redox species across the carbon-modified glassy carbon disk electrode/electrolyte interface. The features of the EIS patterns depend on the potential, concentrations of the redox species and mass-transport conditions at the electrode/electrolyte interface. With the starting electrolyte containing either only V4+ or V5+ redox species, EIS shows a straight line capacitor feature, as no oxidation or reduction reaction take place at the measured open circuit potential (OCP). With the electrolyte containing equimolar concentration of V4+ and V5+, EIS pattern has both charge-transfer and mass-transfer features at the equilibrium potential. The features of the charge-transfer process are observed to be influenced by the mass-transfer process. Optimum concentrations of the V4+/V5+ redox species and supporting H2SO4 electrolyte are required to resolve the EIS features corresponding to the underlying physical processes. The semi-infinite linear diffusion characteristics of the V4+/V5+ redox species observed with a static condition of the electrode converges to that of a finite diffusion under hydrodynamic condition.
1. Introduction
Redox flow batteries (RFB) are one of the most promising large-scale electrochemical energy storage devices due to their excellent energy efficiency, long cycle life, and uncoupled power density and energy density. In particular, the vanadium redox flow battery (VRFB) has apparent advantages over other RFBs, as it employs vanadium electrolyte in both the half-cells, and eliminates the cross-contamination effect through the membrane, resulting in lower electrolyte replacement cost.1–4 However, one of the drawbacks of VRFB is its low power density due to the sluggish electron-transfer kinetics of the vanadium redox reactions. Therefore, there is a consistent effort towards improving the electrode kinetics for vanadium redox reactions using either alternative materials with improved properties or by modification of the existing electrode materials.1–4 At the same time, a thorough investigation of the electrode kinetics is imperative to establish the effectiveness of the materials towards electron-transfer reactions.In the literature, the electrochemical impedance spectroscopy (EIS) is extensively used for the comparison of the electrode kinetics.5–17 The charge-transfer resistance (Rct) obtained from the EIS is used to estimate the electrode kinetics (i.e., lower the Rct better the kinetics of the redox reactions on the electrode material surface).5–17 EIS allows to distinguish various underlying physical processes of different relaxation frequencies,18–24 and in the literature, the EIS patterns are reported at the open circuit potential (OCP) or at finite overpotential.8–17 At times, EIS is reported with the electrolyte containing only one of the species of the redox couple (either V4+ or V5+) and not a solution of both.8–17 Moreover, prior recording the EIS, electrode is usually subjected to the potential cycling to activate the electrode surface and to achieve maximum wettability.25,26 Potential cycling changes the concentration of redox species27 and therefore, the EIS recorded just after potential cycling may not give reproducible features. It is a challenging task to derive any conclusion from the EIS recorded at different potentials reported by various authors in the literature. Often, the charge-transfer and mass-transfer processes do not get resolved, if the concentration of the redox species and supporting electrolyte are not optimized; in such cases, only one distorted semi-circle may appear in the EIS pattern and one may interpret it wrongly as charge-transfer process.
Therefore, in this manuscript, evolution of EIS features with the applied potential on a typical carbon material (Vulcan XC-72 carbon-black in RDE configuration) is illustrated using VO2+/VO2+ (V4+/V5+) redox couple as a redox probe. Voltammograms in three different electrolytes (containing only oxidized species (V5+), only reduced species (V4+), and with equimolar concentration of both the species (V4+ and V5+) of the redox couple) are used to elucidate the importance of recording EIS at equilibrium potential (EP). It is shown that the equimolar concentration of both the species of the redox couple in the electrolyte is essential to maintain the equilibrium across the electrode surface. The EIS has to be recorded at EP to obtain reliable and reproducible features and to compare the electrode kinetics. The EIS features depend on concentration of the active species, concentration of the supporting electrolyte and mass-transport conditions. Based on the mass-transport conditions, finite and semi-infinite mass-transport of active species are observed. Also, the role of redox species and supporting electrolyte concentrations in resolving the charge-transfer and mass-transfer processes is underlined. Overall, the precise conditions for the proper comparison of the EIS are derived.
2. Experimental details
2.1 Materials
Vanadium (V) oxide (V2O5, 99.6% purity) from Sigma Aldrich; isopropanol (C3H7OH, 99.5% purity) and sulfuric acid (H2SO4, 98% GR) from Merck were used as-received without any further purification. High purity (18.2 MΩ) de-ionized (DI) water was obtained from Direct Q Millipore.2.2 Electrolyte preparation
In this work, three different electrolytes (VO2+ solution, VO2+ solution and an equimolar concentration of VO2+ and VO2+) of various concentrations were used for the electrochemical measurements. H2SO4 solutions of different concentrations (1, 2, 3, 4, and 5 M) were used as the supporting electrolyte in all the three vanadium electrolytes. VO2+ electrolyte was prepared by dissolving V2O5 in 3 M H2SO4 solution. The VO2+ electrolyte was prepared by electrochemical reduction of VO2+ ions. For the simplicity of the text, VO2+ and VO2+ are mentioned as V4+ and V5+, respectively, throughout the manuscript.2.3 Electrode preparation
The thin-film electrode was prepared by the method reported in the literature.28 Carbon-black (5 mg) was dispersed in 5 mL DI water. Subsequently, 10 mL of iso-propanol was added to the mixture and it was ultra-sonicated for 30 min to get a free-flowing smooth ink. A measured volume of the ink was drop-cast using a micro-pipette on a polished glassy-carbon disk electrode (GCE, area 0.196 cm2) to get a carbon-black loading of 128 μg cm−2. The surface of the working electrode was then air-dried for 2 h prior to the electrochemical measurements.2.4 Electrochemical characterization
The cyclic voltammograms (CVs) were recorded in a conventional three-electrode rotating disk electrode (RDE) configuration using a “WaveDriver 20” bipotentiostat (Pine Research Instruments, USA). The prepared thin-film electrode was the working electrode, Ag/AgCl (saturated KCl) was the reference electrode and a platinum wire was the counter electrode. CV and polarization curves were recorded at 20 mV s−1 scan rate. An SP-300 potentiostat (from BioLogic Science Instruments (Seyssinet-Pariset, France)) was used to record the impedance spectra. All the experiments were conducted in a three-electrode thin-film RDE (TF-RDE) configuration with an AC amplitude of 10 mV rms by sweeping the frequency from 20 kHz to 50 mHz at 10 points per decade. The impedance spectra were fitted using complex non-linear least square (CNLS) method with “ZSimpWin” software from Solartron.When equimolar concentration of both the species of the redox couple is present in the electrolyte, a true equilibrium is established. In such case, the formal equilibrium potential (EP) can be calculated from the thermodynamic data using Nernst equation. On the other hand, when concentration of one of the species in the redox couple is unknown (for e.g. after cycling the electrode), or when the supporting electrolyte contains only one of the redox species at the beginning of the experiment, an equilibrium potential is not defined by the Nernst equation. But a potential between the working and reference electrode can be measured using high impedance voltmeter, when no external bias is applied. This potential is called open circuit potential (OCP).27 All impedance measurements reported in this manuscript are conducted at either formal EP or OCP, as defined above.
3. Results and discussion
3.1 CV and EIS in the equimolar (0.2 M) concentration of V4+ and V5+ in 3 M H2SO4 electrolyte
Fig. 1 presents the voltammograms of equimolar (0.2 M) concentration of V4+ and V5+ in 3 M H2SO4 electrolyte recorded at 20 mV s−1 scan rate. The V4+ to V5+ oxidation peak is observed at ∼0.88 V and the corresponding reduction peak is at ∼0.78 V; the peak potential difference is ∼0.1 V. The separation of peak potentials (in mV) and peak current ratio are indications of the reversibility of a redox reaction. For a reversible redox reaction, the separation of peak potential should be less than 58/n mV and peak current ratio should be 1 at all scan rates, where n is the number of electrons involved in the redox reaction.27 Therefore, results suggest that VO2+/VO2+ redox couple exhibits a quasi-reversible reaction on carbon-modified GCE. The quasi-reversible reaction indicates that the electron-transfer rate across the electrode/electrolyte interface is slow and higher overpotentials are required to drive the electron-transfer.27 The VO2+/VO2+ (V4+/V5+) is a complex reaction and it involves one electron and two H+ transfer in VO2+ reduction to VO2+.| VO2+ + e− + 2H+ ↔ VO2+ + H2O | (1) |
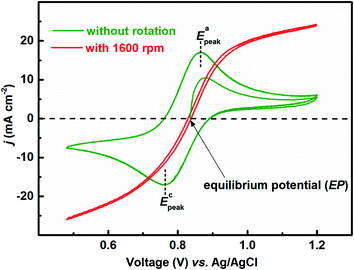 | ||
| Fig. 1 CVs recorded with carbon-modified GCE without rotation and with 1600 rpm at 20 mV s−1 scan rate in equimolar (0.2 M) concentration of V4+ and V5+ in 3 M H2SO4 electrolyte. | ||
The EP is chosen as the initial potential for recording the voltammograms. EP is the mid-point potential between the oxidation and the reduction peak potentials.29
 | (2) |
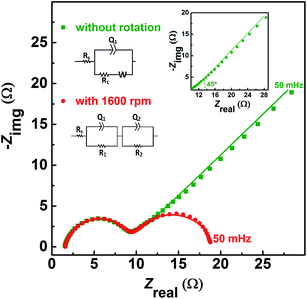
Fig. 2 shows the EIS patterns recorded at EP with equimolar (0.2 M) concentration of V4+ and V5+ in 3 M H2SO4 electrolyte. The EIS pattern (without rotation of the electrode) shows one high frequency (HF) semi-circle and a low frequency (LF) line corresponding to the charge-transfer process and the semi-infinite linear mass-transport of the vanadium ions, respectively. The semi-infinite linear mass-transport feature is usually fitted with the Warburg element (W) and thus, the feature is also known as Warburg diffusion.29–31 From the inset to Fig. 2, it is observed that the linear fit to the LF data is at ∼45°. The experimental data points follow the fitted line in the MF range, whereas, a few of the data points appear to be slightly below the linear fit at very low frequencies. The physical reason for the deviation from Warburg behaviour in the LF region is the sluggish diffusion of ions to the porous electrodes. The transport layer impedance depends on the type of the electrode connected to it and for the porous electrodes, as used in this case, the effect of double layer capacitance is not negligible unlike that with planar electrodes.32,33 Recently, Juhyun et al. reported the effects of nanoparticle geometry and size distribution on diffusion impedance34 and Barbero et al. showed that the displacement current on the electrodes leads to the transport impedance differing from that of the Warburg's result.35 Therefore, the LF data points are slightly deviated from the 45° line as shown in the magnified view of the LF line in the inset to the Fig. 2. At 1600 rpm, the recorded EIS pattern features two semi-circles (see Fig. 2). The HF semi-circle corresponding to the charge-transfer process overlaps in both the spectra. On the other hand, the LF line converges to a semi-circle on recording the EIS under rotation. Therefore, the semi-infinite linear mass-transport feature, in the EIS recorded without rotation converges to a finite mass-transport feature of vanadium ions under the hydrodynamic condition (1600 rpm).
The EIS patterns are fitted with the equivalent circuits (ECs) using complex non-linear least square (CNLS) method. An equivalent circuit consisting of a series combination of Rs and ((R1W), Q1) element is used to fit the EIS pattern recorded without rotation, where Rs is the solution resistance, R1 is the charge-transfer resistance (Rct), Q1 is the constant phase element (CPE) associated with the double layer capacitance (Cdl), and W is the Warburg element in series with R1 (see inset to Fig. 2).30 However, a series combination of Rs, HF (R1, Q1), and LF (R2, Q2) elements is used to fit the EIS pattern recorded under hydrodynamic conditions of the electrode. The HF (R1, Q1) element is associated with the electron-transfer process through the electrode–electrolyte interface. The LF (R2, Q2) element is associated with the transport of redox species, where R2 and Q2 represent the resistance to the transport of redox species (Rd) and CPE associated with the diffuse layer capacitance (Cd), respectively. Also, the quality of the fit is poor with a pure capacitor, and therefore, a constant phase element (CPE) is used to fit the experimental data (see Fig. S1†). The physical reason for replacing capacitor with CPE is the frequency dependence of the measured electrode–electrolyte interfacial capacitance.36,37 The CPE behavior is attributed to surface inhomogeneity, reactivity, and current and potential distributions associated with the electrode geometry.36,37 Recently, Martin et al. attributed the CPE behaviour to the presence of trace amounts of impurities in solutions.38
In the literature, sometimes a Warburg short (Ws) element is also used to fit the EIS feature because of finite transport of redox species observed under hydrodynamic conditions of the electrode.39,40 Therefore, the EIS pattern is fitted with the series combination of Rs and the ((R1Ws), Q1) element (see Fig. S2a†). The quality of the fit with the Ws element is poor compared to that of the (R2, Q2) element and it is justified with the Fisher–Snedecor test (F-test) (see Fig. S2 and relevant text in the ESI†).19 Recently, we reported the transport mechanism of redox species across the porous thin-film electrode/electrolyte interface and explained the conditions in which either Ws element or (R2, Q2) elements should be used to fit the finite transport feature.30
Similar EIS features with equimolar concentration of V4+/V5+ redox species at EP are reported in the literature.29,41,42 However, several others have reported such features (one semi-circle and ∼45° line) by recording EIS even at measured OCP or at some finite overpotential in the electrolyte containing one of the species of the redox couple (either V4+ or V5+) and not a solution of both.8–17 The EIS features strongly depend on applied potential and electrolyte concentration. Therefore, it is imperative to understand the EIS recorded at EP, or at a finite potential.
3.2 EIS at OCP with 0.2 M V5+ electrolyte
The EIS pattern recorded at measured OCP with 0.2 M V5+ in 3 M H2SO4 electrolyte is shown in Fig. 3. In the EIS pattern, only a straight line (slightly tilted away from the y-axis) is observed. This indicates a capacitive behaviour of the electrode and charge-transfer reactions such as oxidation and reduction do not take place at OCP. An ideal electrochemical capacitor shows a straight line parallel to the y-axis and the non-ideality originates from the surface roughness, reactivity, and porosity of the electrode and its non-uniform current distribution as reported in the literature.43–45 Recently, Martin et al. attributed the non-ideal behaviour to the presence of trace amounts of impurities in solutions.38 Therefore, the observed straight line is slightly tilted away from the y-axis.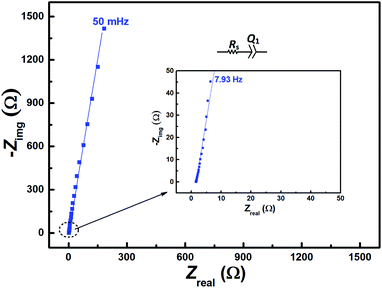 | ||
| Fig. 3 EIS patterns recorded at OCP on carbon-modified GCE without rotation in 0.2 M V5+ in 3 M H2SO4 electrolyte. | ||
The carbon electrochemical capacitor usually features equivalent series resistance (ESR) and equivalent distributed resistance (EDR).23,24 In the present study, the ESR is negligible (∼1.8 Ω) and the typical HF EDR features are not observed (see the inset to Fig. 3) because of the very high concentration of the acid solution (3 M H2SO4). The EIS pattern recorded at OCP with V5+ electrolyte (Fig. 3) is completely different from that at EP with equimolar concentration of V4+ and V5+ (Fig. 2). As discussed earlier, in the literature, one semi-circle and semi-infinite linear mass-transport features of vanadium ions are also reported for the EIS recorded at the OCP in the electrolyte containing one of the species of the redox couple (either V4+ or V5+).8–12 Therefore, it is pertinent to understand the OCP, its changes with the concentration of the redox species, and its effect on the EIS features.
3.3 Change in the OCP with the concentration of the redox species
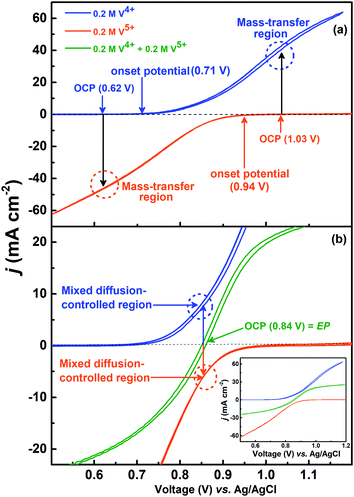
The voltammograms recorded with 0.2 M V4+ and 0.2 M V5+ electrolytes at 1600 rpm are shown in Fig. 4(a). The onset potential for the oxidation of V4+ is ∼0.71 V (blue curve), and that for the reduction of V5+ is ∼0.94 V (orange curve). The OCP measured prior recording the voltammograms was ∼0.62 V for V4+ electrolyte and ∼1.03 V for V5+ electrolyte. Hence, the OCP is away from the onset potential with both the electrolytes, and it suggests that no oxidation or reduction reactions can take place at OCP. Therefore, the EIS pattern recorded at the OCP with 0.2 M V5+ electrolyte shows a straight line capacitive feature and not the charge-transfer semi-circle (see Fig. 3).For the electrolyte containing equimolar concentration of V4+ and V5+, the EP is observed to be 0.84 V, (Fig. 4(b)) at the mid-point potential of the oxidation and reduction peak potentials of V4+ and V5+, respectively (see Fig. 1). Also, the EP is in the mixed diffusion-controlled region as shown in Fig. 4(b). Therefore, the EIS pattern recorded at EP in the electrolyte containing equimolar concentration of V4+ and V5+ shows features of charge-transfer (semi-circle) and semi-infinite linear mass-transport (45° line) of vanadium ions (see Fig. 2). Here, the oxidation and reduction currents increase with the overpotential and do not appear to reach a steady state for the 0.2 M V4+ (blue trace) and 0.2 M V5+ (orange trace) electrolytes, as compared to the oxidation and reduction currents of the equimolar (0.2 M) solution of V4+ and V5+ (green trace in inset to Fig. 4(b)). Also, the oxidation current in the 0.2 M V4+ electrolyte and the reduction current in the 0.2 M V5+ electrolyte are higher than the oxidation and reduction currents observed for the equimolar (0.2 M) solution of V4+ and V5+ electrolyte. This can be due to the complex nature of the VO2+/VO2+ redox reaction.46–48
To activate the electrode surface, potential cycling is often carried out prior recording the EIS patterns. Thus, the concentration of the redox species changes across the electrode surface and it affects the measured OCP. To study the deviation in OCP, the concentrations of V4+ and V5+ ions were varied by potential cycling without rotation (from 0.48 V to 1.2 V) and its effect on OCP was recorded and shown in Fig. 5. The final ratio of the V4+ and V5+ across the electrode surface is largely determined by the potential at which the CV scanning is terminated. Therefore, all the CVs are recorded such that it starts at EP (0.84 V) and terminates at the same potential as shown in Fig. 1.
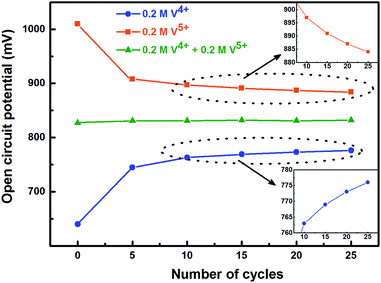 | ||
| Fig. 5 Change in measured OCP after recording CV without rotation on carbon-modified GCE at 20 mV s−1 scan rate for regular number of cycles. | ||
With the 0.2 M V5+ electrolyte, the OCP decreases with the potential cycling due to the V5+ reduction to V4+ across the electrode surface; the V4+/V5+ redox couple exhibits a quasi-reversible reaction (see Fig. 1). Both concentration of V4+ ions across the electrode surface and the OCP stabilize after certain number of cycles (∼25) (see Fig. S3†). Similarly, with the V4+ electrolyte, OCP increases with potential cycling due to the increase in V5+ ion concentration across the electrode surface. With the electrolyte containing equimolar concentration of V4+ and V5+, the EP is found to be stable with the potential cycling. Here, the concentration of V4+ and V5+ is equal in the bulk of the electrolyte as well as across the electrode surface. Thus, after potential cycling, concentration would not change to affect the EP. With the potential cycling, the OCP recorded in 0.2 M V4+ (blue trace) and 0.2 M V5+ (orange trace) electrolytes approaches towards the EP (green trace) recorded in equimolar (0.2 M) solution of V4+ and V5+ electrolytes. However, OCP in V4+ and V5+ electrolytes never reaches to the EP. In the V5+ electrolyte, the V5+ ions reduces to V4+ with the potential cycling, and the overall concentration of V5+ and V4+ across the electrode surface shifts the EP to a new value, which is lower than the initial value as discussed in Section 3.1 (see Fig. 1 and the relevant text). With the time, V4+ ions diffuses into the bulk of the electrolyte and thus the overall concentration of V5+ ions across the electrode surface remains higher than that of V4+ ions and the measured OCP (orange trace) does not reach to EP (green trace). Similar arguments holds for the V4+ electrolyte as well.
The concentration of V4+ and V5+ can be simply varied by holding the working electrode at any potential between the OCPs of the V4+ and V5+ electrolytes. Therefore, the working electrode was held at EP (0.84 V) which is a large overpotential for the V4+ oxidation as well as V5+ reduction (see Fig. 4) and the change in OCP was recorded with time. The changes in the value of OCP with the potential holding in 0.2 M V4+, 0.2 M V5+ and equimolar (0.2 M) solution of V4+ and V5+ are similar to the results observed with the potential cycling and it is shown in Fig. S4.†
3.4 EIS at OCP after potential cycling in 0.2 M V5+ electrolyte
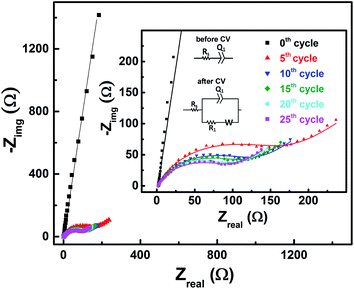
EIS patterns recorded at OCP with 0.2 M V5+ electrolyte after every 5 cycles are shown in Fig. 6. Prior to cycling, as already discussed in Section 3.2 (see Fig. 3), the recorded EIS pattern shows a straight line feature. After five cycles, the OCP shifts to lower potential (see Fig. 5) and the features of the EIS pattern recorded are different with a semi-circle and a 45° straight line. Here, it is to be noted that the semi-circle is not due to the V5+ reduction to V4+, but it is primarily a result of V4+ ions (generated across the electrode surface during CV) oxidation to V5+ since the OCP is a high overpotential for the oxidation of V4+ (see Fig. 4(a)). With further cycling, V4+ ion concentration increases across the electrode surface and the semi-circle diameter is observed to decrease. After 25 cycles, concentration of V4+ ions stabilizes across the electrode surface, and therefore, no further changes in the measured OCP and EIS features are observed. Similar features are observed for the EIS recorded at measured OCP after holding the working electrode at EP in 0.2 M V5+ electrolyte (see Fig. S5 in the SI†). This confirms that the EIS features strongly depends on the concentration of the redox species across the electrode surface.As shown in the Fig. 4, the OCP with V5+ electrolyte is a high overpotential for the oxidation of V4+ ions present across the electrode surface and it is in the mass-transfer region of the polarization curve recorded with V4+ electrolyte. Therefore, recording the EIS patterns at OCP in an electrolyte containing only a single redox species (either V4+ or V5+) of the redox couple may lead to wrong information. Depending on the surface area and pore volume of the electrode material, concentration of ions across the electrode surface would be different even after recording the CVs for equal number of cycles. Furthermore, the ions across the electrode surface disperse to the bulk of the solution with time. Hence, the features of the EIS patterns just after recording the CV and after certain time would be different. Therefore, the concentration of both the species (V4+ and V5+) of the redox couple should be equal in the electrolyte to maintain the equilibrium across the electrode surface.
The above experiments were carried out with the equimolar (0.2 M) concentration of V4+ and V5+ in 3 M H2SO4 electrolyte, which was optimized by recording CVs and EIS. The effect of the vanadium ions and H2SO4 concentration on CV and EIS is discussed in the following sections (Sections 3.5 and 3.6).
3.5 Effect of redox species concentration
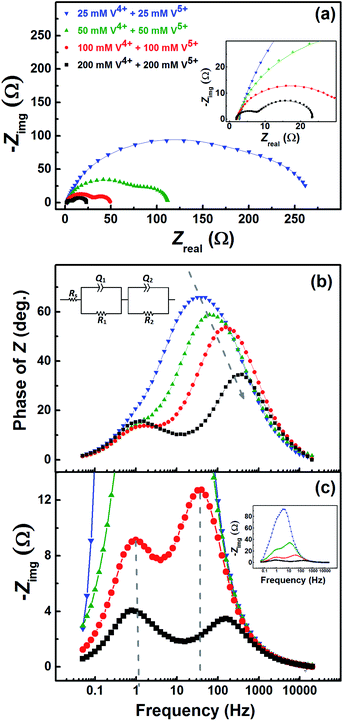
Fig. 7 shows the EIS patterns recorded at the EP with equimolar concentration of V4+ and V5+ in 3 M H2SO4. Two well-resolved semi-circles appear at high concentration (200 mM) of the vanadium ions (V4+/V5+) and they merge at lower concentrations. The EIS patterns are fitted with an EC consisting of a solution resistance Rs in series with two (R, Q) elements; the obtained values of charge-transfer resistance (Rct) and mass-transfer resistance (Rd) are shown in Table S3.† It is observed that the semi-circle diameter increases with the decrease in vanadium ions concentration, and it indicates rise in charge-transfer and mass-transfer resistance (see Table S3†). Further, in the Bode phase (Fig. 7(b)) plots, single peak corresponding to charge-transfer process is observed at the MF region for the lower concentration and the peak position shifts to higher frequency with the rise in V4+/V5+ concentration. It suggest that the charge-transfer becomes a limiting process at the lower concentration of V4+/V5+ and thus it is pushed to lower frequency. This can be the reason for the poor resolution of semi-circles in the Nyquist plots at lower concentrations. For the higher concentration of V4+/V5+, two well-separated peaks (HF and LF) corresponding to the charge-transfer and mass-transfer processes are observed.The corresponding Bode imaginary plots are shown in Fig. 7(c). Only a single peak is observed in the MF region for the low concentration (25 mM) of V4+/V5+, similar to the Bode phase plots. At higher concentrations (50 mM and above), it splits into two peaks; with increase in the V4+/V5+ concentration, the HF peak shifts to further higher frequencies and LF peak to further low frequencies. Thus, two well-resolved semi-circles are observed in the Nyquist plots with the higher concentration of V4+/V5+.
3.6 The role of supporting electrolyte
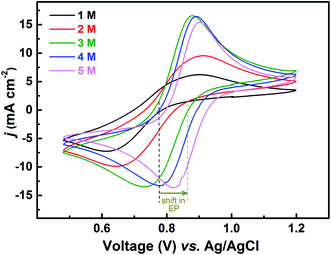
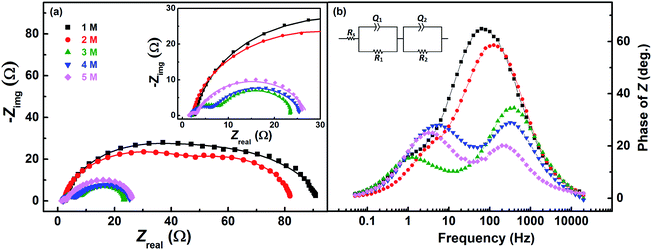
The redox reactions are usually investigated in acidic medium due to the low solubility of the salts in water. Ions from the supporting electrolyte also may take part in the charge-transfer reaction. In such cases, it is desirable to optimise the supporting electrolyte concentration; otherwise, it may limit the reaction. In this study, H2SO4 is used as a supporting electrolyte. So far, all the experiments discussed above were carried out in optimized H2SO4 concentration (3 M).Voltammograms recorded with equimolar (0.2 M) solution of V4+ and V5+ in H2SO4 electrolyte of different concentrations are shown in Fig. 8. As two H+ ions are involved in the V5+ (VO2+) reduction to V4+ (VO2+), the higher concentration of H2SO4 (than that of V5+), boosts peak current, reduces the peak to peak separation and facilitates the reaction. However, at concentration above 3 M, the reaction slows down perhaps due to rise in viscosity of the electrolyte. From eqn (1), the EP is dependent on the solution pH and it is found to shift with the increase in H2SO4 concentration. With increase in the SO42− ion concentration in the electrolyte, the specific adsorption of the SO42− changes the potential at the outer Helmholtz plane and increases the rate constant by the well-known Frumkin effect.49 The EIS patterns recorded at corresponding EP are shown in Fig. 9. The charge-transfer resistances decrease with H2SO4 concentration, whereas, the mass-transfer resistance decrease with H2SO4 concentration up to 3 M, and increases at further higher concentration (4 M and 5 M) due to rise in viscosity of the electrolyte.50–52 Similar observations were also reported by Yuehua et al.53 The solution resistance (Rs) is observed to be decreased with the rise in H2SO4 concentration. The solution resistance, charge-transfer resistance and mass-transfer resistance obtained from EC fitting are shown in Table S4.†
The semi-circles for the charge-transfer and mass-transfer processes are best resolved at 3 M H2SO4 concentration which is further supported by Bode phase plots shown in Fig. 9(b). The HF and LF peaks get well-separated on increasing the H2SO4 concentration. However, due to the rise in viscosity of electrolyte, at concentration above the 3 M H2SO4, the transport of the ions towards the electrode surface gets hindered and the mass-transfer becomes the limiting process. Therefore, the LF peak is found to be shifted to higher frequencies with the 4 M and 5 M H2SO4 concentrations, causing poor resolution of charge-transfer and mass-transfer processes. Therefore, it is essential to use the optimized concentration of supporting electrolyte, which is 3 M H2SO4 in the present case.
4. Conclusions
The evolution of EIS patterns with the applied potential, concentration of the redox species, and the concentration of the supporting electrolyte is investigated using the V4+/V5+ (VO2+/VO2+) redox couple on the carbon-modified GCE. For the electrolyte containing equimolar concentration of V4+ and V5+, the EIS pattern is characterized by the features of charge-transfer and mass-transfer processes at EP. When concentration of one of the species of the redox couple is not known or when the supporting electrolyte contains only one of the species before the start of the experiment, an OCP is not defined. In such cases, the EIS features will change with potential cycling. Therefore, it is imperative to record EIS at the EP to obtain reproducible EIS pattern and the kinetic parameters. Moreover, the charge-transfer process is observed to be influenced by the mass-transport conditions at the electrode/electrolyte interface. Optimum concentration of V4+/V5+ and supporting H2SO4 solution are required to resolve the charge-transfer and mass-transfer processes. At lower concentrations of the V4+/V5+, charge-transfer becomes a limiting process and shifts towards LF, which results in poor resolution of EIS features. At higher concentrations, charge-transfer process shifts towards higher frequency, resolving it from the LF mass-transfer process. In addition, it is essential to choose optimum concentration of the supporting electrolyte when the ions from the supporting electrolyte solution take part in the charge-transfer process.Conflicts of interest
There are no conflicts of interest to declare.Acknowledgements
India-UK Centre for Education and Research in Clean Energy (IUCERCE) is acknowledged for the financial support of the project (Grant No. 16DST050). Ministry of New and Renewable Energy (MNRE), India, is acknowledged for the financial support of the project through the National Centre for Photovoltaic Research and Education (NCPRE, P16MNRE002) at IIT Bombay.References
- A. Z. Weber, M. M. Mench, J. P. Meyers, P. N. Ross, J. T. Gostick and Q. Liu, J. Appl. Electrochem., 2011, 41, 1137–1164 CrossRef CAS.
- P. Alotto, M. Guarnieri and F. Moro, Renewable Sustainable Energy Rev., 2014, 29, 325–335 CrossRef CAS.
- J. Maruyama, S. Maruyama, T. Fukuhara and K. Hanafusa, J. Phys. Chem. C, 2017, 121, 24425–24433 CrossRef CAS.
- C. Wu, S. Lu, J. Zhang and Y. Xiang, Phys. Chem. Chem. Phys., 2018, 20, 7694–7700 RSC.
- C.-N. Sun, F. M. Delnick, D. S. Aaron, A. B. Papandrew, M. M. Mench and T. A. Zawodzinski, J. Electrochem. Soc., 2014, 161, A981–A988 CrossRef CAS.
- A. M. Pezeshki, R. L. Sacci, F. M. Delnick, D. S. Aaron and M. M. Mench, Electrochim. Acta, 2017, 229, 261–270 CrossRef CAS.
- N. Baram and Y. Ein-Eli, J. Phys. Chem. C, 2010, 114, 9781–9790 CrossRef CAS.
- Z. He, Y. Jiang, W. Meng, F. Jiang, H. Zhou, Y. Li, J. Zhu, L. Wang and L. Dai, Appl. Surf. Sci., 2017, 423, 111–118 CrossRef CAS.
- H. Gursu, M. Gencten and Y. Sahin, Electrochim. Acta, 2017, 243, 239–249 CrossRef CAS.
- I. Mustafa, I. Lopez, H. Younes, R. A. Susantyoko, R. A. Al-Rub and S. Almheiri, Electrochim. Acta, 2017, 230, 222–235 CrossRef CAS.
- Y. Huang, Q. Deng, X. Wu and S. N. Wang, Int. J. Hydrogen Energy, 2017, 42, 7177–7185 CrossRef CAS.
- M. H. Moghim, R. Eqra, M. Babaiee, M. Zarei-Jelyani and M. M. Loghavi, J. Electroanal. Chem., 2017, 789, 67–75 CrossRef CAS.
- J. J. Park, J. H. Park, O. O. Park and J. H. Yang, Carbon, 2016, 110, 17–26 CrossRef CAS.
- G. Wei, W. Su, Z. Wei, M. Jing, X. Fan, J. Liu and C. Yan, Electrochim. Acta, 2016, 199, 147–153 CrossRef CAS.
- S. Fu, C. Zhu, J. Song, M. H. Engelhard, D. Du and Y. Lin, Electroanalysis, 2017, 29, 1469–1473 CrossRef CAS.
- H. R. Jiang, W. Shyy, M. C. Wu, L. Wei and T. S. Zhao, J. Power Sources, 2017, 365, 34–42 CrossRef CAS.
- M. Jing, X. Zhang, X. Fan, L. Zhao, J. Liu and C. Yan, Electrochim. Acta, 2016, 215, 57–65 CrossRef CAS.
- N. Schweikert, H. Hahn and S. Indris, Phys. Chem. Chem. Phys., 2011, 13, 6234–6240 RSC.
- A. Lasia, Electrochemical Impedance Spectroscopy and its Applications, Springer, New York, 2014 Search PubMed.
- M. Eikerling and A. A. Kornyshev, J. Electroanal. Chem., 1999, 475, 107–123 CrossRef CAS.
- A. A. Kulikovsky and M. Eikerling, J. Electroanal. Chem., 2013, 691, 13–17 CrossRef CAS.
- M. M. R. Howlader, A. U. Alam, R. P. Sharma and M. J. Deen, Phys. Chem. Chem. Phys., 2015, 17, 10135–10145 RSC.
- R. K. Singh, R. Devivaraprasad, T. Kar, A. Chakraborty and M. Neergat, J. Electrochem. Soc., 2015, 162, F489–F498 CrossRef CAS.
- B. Bera, T. Kar, A. Chakraborty and M. Neergat, J. Electroanal. Chem., 2017, 805, 184–192 CrossRef CAS.
- A. Chakraborty, R. Devivaraprasad, B. Bera and M. Neergat, Phys. Chem. Chem. Phys., 2017, 19, 25414–25422 RSC.
- A. Chakraborty, B. Bera, D. Priyadarshani, P. Leuaa, D. Choudhury and M. Neergat, RSC Adv., 2019, 9, 466–475 RSC.
- A. J. Bard and L. R. Faulkner, Electrochemical Methods, Fundamentals and Applications, Wiley, New York, 2nd edn, 2001, vol. 226 Search PubMed.
- M. Neergat, V. Gunasekar and R. Rahul, J. Electroanal. Chem., 2011, 658, 25–32 CrossRef CAS.
- J. Friedl, C. M. Bauer, A. Rinaldi and U. Stimming, Carbon, 2013, 63, 228–239 CrossRef CAS.
- P. Leuaa, D. Priyadarshani, A. K. Tripathi and M. Neergat, J. Phys. Chem. C, 2019, 123, 21440–21447 CrossRef CAS.
- A. Lasia, B. E. Conway, J. O'M Bockris and R. E. White, Modern Aspects of Electrochemistry, Kluwer/Plenum, New York, 1999, vol. 32, p. 38 Search PubMed.
- A. Kulikovsky, Electrochem. Commun., 2017, 84, 28–31 CrossRef CAS.
- G. Barbero, Phys. Chem. Chem. Phys., 2016, 18, 29537–29542 RSC.
- J. Songa and M. Z. Bazant, J. Electrochem. Soc., 2013, 160, A15–A24 CrossRef.
- G. Barbero and I. Lelidis, Phys. Chem. Chem. Phys., 2017, 19, 24934–24944 RSC.
- A. S. Bondarenko, I. E. L. Stephens, H. A. Hansen, F. J. Perez-Alonso, V. Tripkovic, T. P. Johansson, J. Rossmeisl, J. K. Nørskov and I. Chorkendorff, Langmuir, 2011, 27, 2058–2066 CrossRef CAS.
- P. M. Gomadam and J. W. Weidner, Int. J. Energy Res., 2005, 29, 1133–1151 CrossRef CAS.
- M. H. Martin and A. Lasia, Electrochim. Acta, 2011, 56, 8058–8068 CrossRef CAS.
- M. Singh, K. Manoli, A. Tiwari, T. Ligonzo, C. Di Franco, N. Cioffi, G. Palazzo, G. Scamarcio and L. Torsi, J. Mater. Chem. C, 2017, 5, 3509–3518 RSC.
- J. Bisquert, G. Garcia-Belmonte, F. Fabregat-Santiago and P. R. Bueno, J. Electroanal. Chem., 1999, 475, 152–163 CrossRef CAS.
- H. Fink, J. Friedl and U. Stimming, J. Phys. Chem. C, 2016, 120, 15893–15901 CrossRef CAS.
- A. Bourke, M. A. Miller, R. P. Lynch, J. S. Wainright, R. F. Savinell and D. N. Buckley, ECS Trans., 2015, 66, 181–211 CrossRef CAS.
- R. Kotz and M. Carlen, Electrochim. Acta, 2000, 45, 2483–2498 CrossRef CAS.
- M. F. Mathias and O. Haas, J. Phys. Chem., 1993, 97, 9217–9225 CrossRef CAS.
- H. Scher and M. Lax, Phys. Rev. B: Solid State, 1973, 7, 4491–4502 CrossRef CAS.
- Y. Li, J. Parrondo, S. Sankarasubramanian and V. Ramani, J. Phys. Chem. C, 2019, 123, 6370–6378 CrossRef CAS.
- J. Maruyama, T. Hasegawa, S. Iwasaki, T. Fukuhara and M. Nogami, J. Electrochem. Soc., 2013, 160, A1293–A1298 CrossRef CAS.
- M. Gattrell, J. Park, B. MacDougall, J. Apte, S. McCarthy and C. W. Wu, J. Electrochem. Soc., 2004, 151, A123–A130 CrossRef CAS.
- H. Kaneko, K. Nozaki, Y. Wada, T. Aoki, A. Negishi and M. Kamimoto, Electrochim. Acta, 1991, 36, 1191–1196 CrossRef CAS.
- A. M. Cao-Paz, L. Rodríguez-Pardo, J. Farina and J. Marcos-Acevedo, Sensors, 2012, 12, 10604–10620 CrossRef CAS.
- D. Linden and T. B. Reddy, Handbook of Batteries, McGraw Hill, New York, NY, USA, 2002 Search PubMed.
- O. T. Fasullo, Sulfuric Acid: Use and Handling, McGraw-Hill Book Company, New York, 1965, at p. 305 Search PubMed.
- Y. Wen, H. Zhang, P. Qian, P. Zhao, H. Zhou and B. Yi, Acta Phys.-Chim. Sin., 2006, 22, 403–408 CrossRef CAS.
Footnote |
| † Electronic supplementary information (ESI) available. See DOI: 10.1039/d0ra05224h |
| This journal is © The Royal Society of Chemistry 2020 |

