The development of mechanoluminescence from organic compounds: breakthrough and deep insight
Yujun
Xie
a and
Zhen
Li
 *ab
*ab
aInstitute of Molecular Aggregation Science, Tianjin University, Tianjin, 300072, China. E-mail: lizhentju@tju.edu.cn; lizhen@whu.edu.cn
bDepartment of Chemistry, Wuhan University, Wuhan, 430072, China
First published on 4th October 2019
Abstract
Organic mechanoluminescence (ML) compounds have experienced breakthrough developments in recent years, with ML being discovered in many kinds of organic compounds. Accordingly, the ML composition is becoming more complicated; complications can be observed from the initial stages of nitrogen discharge to fluorescence, dual emission of fluorescence and phosphorescence and the more novel persistent room-temperature phosphorescence (RTP) on to photo-sensitive ML, presenting unique luminous properties with more perspectives. Since ML is found to be highly correlated with the molecular configuration and the intermolecular packing style in the aggregate state, the photophysical properties should be analyzed carefully with the consideration of MUSIC (Molecular Uniting Set Identified Characteristic). In this review paper, we summarized the recently reported organic ML compounds, which were classified according to their luminous and chemical structure features. The investigation of organic ML can promote the development of “aggregated state chemistry” and the luminous theory in the aggregate state.
Introduction
In the past decades, organic luminescent materials have experienced rapid development in both experimental and theoretical aspects and have been widely applied in the fields of organic light-emitting diodes (OLED), biological imaging, environmental protection, etc.1–6 Theoretically, luminescence arises from the electron transition from the excited state to the ground state. The identical and opposite electron spin multiplicities between the ground and excited states will lead to different excited states of singlet and triplet states, which radiatively decay as fluorescence and/or phosphorescence.7 Despite years of research, the organic luminescence mechanisms are still not fully understood due to the very complicated influence originating from chemical structure, spatial configuration, and ambient environment, etc. Generally, the spin–orbital coupling (SOC) coefficient of organic molecules is small because of the spin-forbidden transition between singlet and triplet states. As a result, the radiative decay rate of triplet excitons is far less than that of non-radiative, and triplet excitons can be easily quenched by oxygen in the air. Therefore, it is difficult to observe phosphorescence in purely organic luminophores at room temperature. However, triplet states have fantastic impacts on luminescence properties since their interplay with singlet states leads to lots of novel luminescence characteristics. For example, the small energy gap between singlet (S1) and triplet (T1) states can cause effective reverse intersystem crossing (RISC) in thermally activated delayed fluorescence (TADF) materials,8–10 whereas the large energy gap between high-lying triplet states (Tn) and T1 states as well as the close energy gaps between the high-lying singlet (Sn) and triplet (Tn) energy levels will result in hybridized local and charge-transfer (HLCT) emissions.11,12 However, many new luminescence mechanisms related to interactions between singlet and triplet states remain to be explored.Apart from the intrinsic electron levels, the external ambient environment is also very important to the luminous properties of organic molecules. In a dilute solution or dispersion in a solid matrix, luminescence arises from individual molecules once they become excited. In the aggregated state, the situation becomes more complicated, and the photophysical properties are quite different from that in a single molecular state. On the one hand, the molecular vibrations and rotations are strictly restricted by the physical space constraint in the aggregated state, which results in a reduced non-radiative transition rate. On the other hand, intermolecular interactions are enhanced due to the decreased intermolecular distances in the aggregated state. Therefore, the organic molecules will exhibit unique luminous properties in the aggregated state under the complicated effects, which has been widely reported in previous research. For example, the H-aggregates cause the blue-shift in absorption and red-shift in fluorescence but with reduced fluorescence efficiency, while the J-aggregates lead to a red-shift in absorption and fluorescence but with increased fluorescence efficiency.13 In 2001, Ben Zhong Tang et al. coined the concept of “Aggregation-Induced Emission (AIE)”, revealing that molecules with distorted spatial configurations show weak emission in the solution state but intense emission in the aggregated state.14 In recent years, organic room temperature phosphorescence (RTP), which is usually observed in molecular aggregates, has been undergoing booming development,15 and even some organic cocrystals have been reported with extraordinary properties in light emission, ferroelectricity, optical waveguide and stimuli responsiveness due to noncovalent intermolecular interactions.16–18 The photophysical properties in the aggregated state are highly correlated with the molecular structure and arrangement. Accordingly, in 2018, our group proposed the concept of “Molecular Uniting Set Identified Characteristic (MUSIC)” to describe unique photophysical characteristics in aggregated states.19 Although the research on chemical properties in the aggregated state is still in its infant stage, the “aggregated state chemistry” has exhibited a significant impact on the structure–property relationships in many fields, such as organic solar cells, organic field-effect transistors, non-linear optics, liquid crystals, etc. Even at the molecular level, Cao et al. reported that stacking two layers of graphene at a “magic angle” difference of about 1° regulated the carrier concentration through the gate voltage to achieve an insulator with a half-full band, which then achieved a 1.7 K superconductivity.20,21 The investigation of the chemical properties in aggregates could actually be the research hotspot of the future.
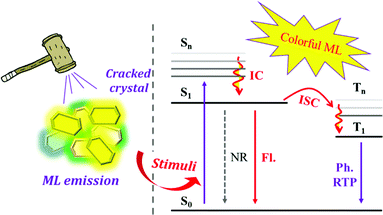
Mechanoluminescence (ML), also known as triboluminescence (TL), is a unique property of molecular aggregates, which refers to the phenomenon of light being produced upon the application of force to compounds (Fig. 1).22–27 ML is an ancient luminous phenomenon that dates back to 1605 when Francis Bacon observed a flash of light from hard sugar upon being scraped.22,28,29 It has now drawn great attention due to its potential applications in the fields of force sensors, lighting, displays, damage detections, bioimaging and phototherapy, etc.30–39 So far, various kinds of compounds have been found with ML properties, such as pure organic and inorganic crystals, metal-centred organic chelates, alkali halides, rare-earth-doped ceramics, ZnS crystals, semiconductors, polymers, metals and so on.24,40,41 Accordingly, different ML mechanisms of these compounds have been proposed.22,24 Although the mechanism of how mechanical force is transformed into light in organic compounds is still not fully understood, the crystal disorder, special molecular packing and piezoelectric effect are usually considered to play key roles in the production of excited states for light emission.22,42–44 In detail, the piezoelectric effect results from the acentric space group of crystals, which creates two opposite charge distributions across the crystal, producing an electric field that excites light when the crystal breaks. For organic non-aromatic compounds and some inorganic crystals, such as sucrose, tartaric acid, Li2SO4, etc., the electric field is strong enough to break down the air and cause nitrogen discharge.22 In organic aromatic compounds, the electric field would act as the excitation source to produce ML similar to the corresponding PL. However, there are also some cases of ML from centrosymmetric crystals, and Dickinson et al. concluded that the ML was excited by the electrons, ions, and neutral species that are produced from the fractured surface.45–47 Overall, ML is more prone to being observed in acentric crystals. According to statistics, ML occurs more frequently in crystals belonging to the acentric space group than those with the centric space group,44 and the MUSIC concept can be applied to the description of ML in organic compounds.
Thanks to the rapid development of experimental techniques and photophysical theory, colorful ML that is closely associated with the molecular configuration and singlet/triplet energy levels has been observed in organic compounds. However, the ML exhibited very different luminous characters in comparison with the corresponding photoluminescence (PL), and the mechanical force stimuli serve as different excitation modes as compared to light. For example, the ML composition could be fluorescence, phosphorescence, or a mixture of these and the emission wavelength or the intensity of the ML spectra would change as well, which might be different from their PL. Although there have recently been some review papers summarizing the research progress,25,27,48 the emerging ML compounds exhibit new characteristics and research prospects, which need to be discussed from a broader perspective. Herein, partially based on our systematic work on ML luminogens, we have collected recently published ML molecules, summarized their characteristics, and explored the inherent mechanisms. For the sake of better discussion, we have classified the ML compounds according to their luminous properties and chemical structural features as follows: compounds with ML in the form of fluorescence; ML from AIE compounds and especially the TPE derivatives; molecular configuration-related ML luminogens; compounds with ML consisting of the dual emission of fluorescence and phosphorescence.
Overall, the ML compounds exhibited mechanically-induced fluorescence, phosphorescence, and long lifetime phosphorescence, indicating the MUSIC feature.
Compounds with ML in the form of fluorescence
At room temperature, purely organic compounds usually emit fluorescence under light excitation, while phosphorescence is negligible due to the spin forbidden rule. Despite the different excitation modes of mechanical stimuli as compared to photo stimuli, the photophysical process of light emission is almost the same. Therefore, mechanofluorescence is the most common emission type in ML. Actually, all the reported organic ML compounds exhibited fluorescence in ML spectra, and the ML color is mostly blue or green, probably because of the relatively small degree of conjugation and high crystallinity of these molecules. Generally, the mechanofluorescent molecules usually exhibit strong photofluorescence at room temperature. In this section, we summarize some prominent compounds with ML in the form of fluorescence.It has been reported that some organic non-aromatic compounds like sugars, tartaric acid, etc., can produce ultra-violet (UV) and deep-blue emission under mechanical stimuli.29,49 However, their ML was proved to be generated by nitrogen discharge under the electric field between the two fracture surfaces. UV luminophores are relatively rare among organic aromatic compounds, and in 2018, Yang et al. reported a unique compound of BP-TPY, which exhibited deep-blue ML located in the UV region with a peak at 372 nm (Fig. 2A and B).50 Upon excitation of a UV lamp at 300 nm, BP-TPY produced emission at around 368 nm, and showed a narrow full width at half-maximum of 35 nm. At 77 K, both fluorescence and phosphorescence were observed (Fig. 2A); thus, the ML spectrum corresponded well to the PL spectrum. The single-crystal analysis revealed that there were two different twisted conformations present with the formed non-centrosymmetric space group of Pc in the monoclinic system, and the UV region ML should be ascribed to the twisted conformation and the small degree of conjugation.
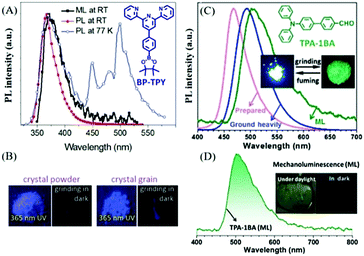 | ||
| Fig. 2 (A) The ML and PL spectra of BP-TPY crystals at room temperature (RT), and the PL spectrum recorded at 77 K under the excitation of a 300 nm light source. (B) The PL and ML images of crystalline BP-TPY powder and grains at 298 K. Reproduced with permission.50 Copyright 2018, Royal Society of Chemistry. (C) PL spectra of TPA-1BA before (as-prepared) and after grinding (ground heavily) in the solid-state, and ML spectrum; photos of TPA-1BA before and after grinding are presented in the inset. (D) ML spectrum of TPA-1BA; inset: the ML photos under daylight and in the dark. Reproduced with permission.51 Copyright 2017, Royal Society of Chemistry. | ||
Triphenylamine (TPA) is a common aromatic block in the design of optoelectric functional molecules having a good degree of conjugation and electron-donor properties. The flexible molecular structure and good crystallinity also make TPA derivatives sensitive to the phase transition. Accordingly, the Li group has built a series of TPA derivatives and found some interesting characteristics. In 2017, the benzaldehyde group was introduced to the TPA group as an electron acceptor, and the resultant compound of TPA-1BA51 emitted bright green ML that peaked at around 500 nm under mechanical stimuli (Fig. 2C and D). TPA-1BA also exhibited mechanochromism properties, and the PL of the as-prepared solid red-shifted from 467 to 492 nm after grinding. The single-crystals of TPA-1BA belong to the piezoelectric non-centrosymmetric space group Pca21, and have good crystallinity and high rigidity. The sharp and intense X-ray diffraction peaks remained after grinding, contributing significantly to the ML properties for the blocking of the possible energy-exhausting pathways.
In 2019, Li et al. reported more ML compounds from TPA derivatives with different halogen substituents.52 As shown in Fig. 3A, the F, Cl, and Br atoms were substituted at the para- or meta-position of the phenyl group of TPA-ph, to yield TPA-mF, TPA-mCl, TPA-mBr, TPA-mF, TPA-pCl, and TPA-pBr, respectively. The ortho-position substituted derivatives were also obtained but without ML. The ML intensities of these compounds were different: TPA-ph and TPA-pF showed weak ML with the centrosymmetric space group of P21/c1, while the strong ML peaks at 431, 433, 435, 443, and 436 nm were observed in the crystalline samples of TPA-mF, TPA-mCl, TPA-mBr, TPA-pCl, and TPA-pBr, respectively (Fig. 3B and C), with the non-centrosymmetric space group of C1c1. Their PL properties were also investigated, and TPA-ph without any halogen atoms emitted deep-blue fluorescence at 396 nm. The para-position-substituted TPA-pBr (429 nm) had greater red-shifted emission as compared to TPA-pF (391 nm) and TPA-pCl (390 nm), possibly due to the stronger intersystem charge transfer. However, the meta-position substituted TPA-mF (390 nm), TPA-mCl (403 nm), and TPA-mBr (397 nm) showed similar emissions at 390, 403, and 397 nm, respectively. As shown in Fig. 3B, high-contrast mechanochromism was observed in all compounds, with the PL red-shifting by about 51 nm after grinding. Thus, all the ML spectra corresponded well with the PL spectra of the ground samples, indicating that the ML was produced from the monomer at the cracked surface of the crystal.
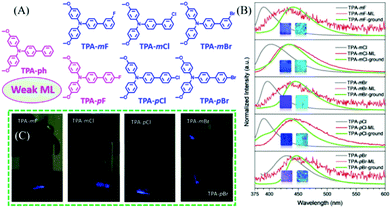 | ||
| Fig. 3 (A) The molecular structure of TPA-ph, TPA-mF, TPA-mCl, TPA-mBr, TPA-pF, TPA-pCl, and TPA-pBr. (B) PL spectra of TPA-mF, TPA-mCl, TPA-mBr, TPA-pCl, and TPA-pBr before (gray line) and after (green line) grinding, and the corresponding ML spectra (red line); inset: the photos of as-prepared and ground powder samples under irradiation of 365 nm UV light. (C) ML images. Reproduced with permission.52 Copyright 2019, John Wiley and Sons. | ||
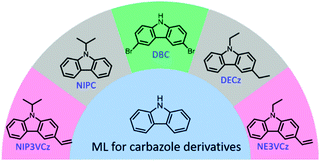
Carbazole is another famous molecular building block in the field of optoelectronic functional materials. It has been reported that the carbazole single-crystal produces ML, but the visible emission was too weak to be recorded by the naked eyes.53 Also, the carbazole crystals showed very good RTP features with ultralong lifetimes of 910 ms at 555 nm,55 further demonstrating their very complicated electron interactions. A series of carbazole derivatives also exhibited unique ML (Fig. 4). For example, N-isopropylcarbazole (NIPC) had a very strong blue ML that could be observed even under daylight conditions,56 and 3,6-dibromocarbazole (DBC) showed dual-modes of ML composed of weak fluorescence and strong phosphorescence according to the ML spectrum, which can be ascribed to the “heavy atom effect” of two bromine atoms.57N-Ethyl-3-vinyl-carbazole (NE3VCz), 9-isopropyl-3-vinyl-carbazole (NIP3VCz), and 3,9-diethyl-carbazole (DECz) were also reported to possess ML properties.58
Interestingly, some carbazole derivatives with extraordinary ML were recently reported. In 2018, Yang et al. reported that strong blue ML was observed in indoor natural light from the lamellar crystal of N-phenylcarbazole (NPC, Fig. 5A) upon gently touching with a metal spade, or by violently shaking or stirring with a magnetic bar.53 The lump crystal obtained from cooled melting and sublimation could also emit bright blue ML (Fig. 5C). Although the visible RTP with a lifetime of 13.4 ms and the low-temperature phosphorescence were observed, the ML was ascribed to fluorescence according to the emission spectrum, for the different excitation modes (Fig. 5A). The NPC crystal belonged to the orthorhombic system with the piezoelectric space group of Fdd2. Strong intermolecular interactions were observed in the crystal, which favored the production of ML. Sun et al. further explored NPC as the host matrix to realize multicolor ML.54 Due to its potential advantages of high thermal stability, and ease of crystallization with a moderate melting point of 91 °C, the bright blue ML of NPC can act as an excitation source. Furthermore, the melted NPC liquid can serve as a non-polar organic solvent for dissolving or dispersing organic fluorescence emitters. Four polar dyes, with green (PPO), yellow (ClDPP), orange (BrDPP) and red (PDPP) PL, were chosen as dopants (Fig. 5F) in amounts of 4–5 w%, by stirring the blends of NPC melting liquid and dyes at 110 °C, followed by cooling to room temperature; their corresponding PL spectra are listed in Fig. 5B. The polar dopants were dispersed in the NPC matrix in the form of small nanocrystals, and the commendable overlaps between the ML spectrum of NPC and the absorption spectra of the dopants (Fig. 5D) promoted the efficient energy transfer between them. The blends exhibited fluorescence and bright green, orange, and red ML due to the presence of dopants (Fig. 5E and F). Thus, this simple strategy provided a feasible approach for realizing bright multicolored ML without difficult molecular designs and syntheses.
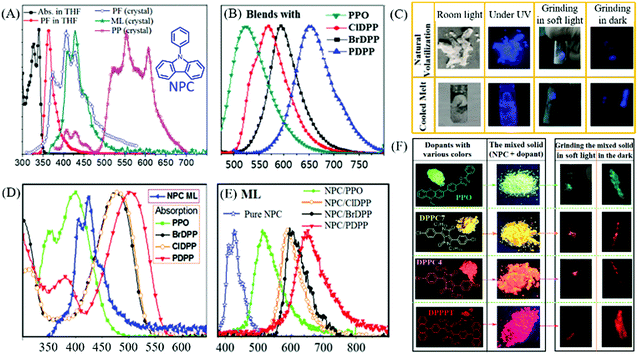 | ||
| Fig. 5 (A) The absorption (Abs.) and fluorescence (PF) spectra of NPC solution and crystals; ML and RTP (PP) spectra at room temperature; the inset shows the chemical structure of NPC. (B) The PL spectra of NPC blends (4–5 w%) with PPO, ClDPP, BrDPP and PDPP. (C) ML photos of the NPC samples prepared by natural volatilization and cooled melt under different conditions. (D) The absorption spectra of PPO, ClDPP, BrDPP and PDPP; ML spectrum of NPC. (E) ML spectra of NPC and the blended solids. (F) The molecular structure and photos of PPO, ClDPP, BrDPP and PDPP solids and blends in NPC under ultraviolet irradiation; the ML photos of blends ground in soft light and in the dark. Reproduced with permission.53,54 Copyright 2018, Royal Society of Chemistry. | ||
Chi et al. reported ML from carbazole derivatives as well.59 To achieve repeatable ML in devices for practical applications, they introduced a series of alkyl chains with different lengths at the N-position of the carbazole (Cz-alkyl-N,N = 2 to 8, in which, N is the number of carbon atoms in the alkyl chain). However, only Cz-alkyl-6 and Cz-alkyl-7 exhibited bright deep blue ML (Fig. 6A and B) similar to their PL spectra. The Cz-alkyl-6 crystal was non-centrosymmetric, while the Cz-alkyl-7 crystal was centrosymmetric. In single crystals, the alkyl chains of these two compounds aggregated and stacked together, and generated alkyl zones with very weak intermolecular interactions, which should be in favor of the sensitive ML for the reduced pressure threshold for ML. Furthermore, both Cz-alkyl-6 and Cz-alkyl-7 had a very strong tendency for crystallization at room temperature and very low melting temperatures of 68.8 and 35.9 °C, respectively. As a result, the polycrystalline samples of both compounds were simply obtained from the hot melting liquids with identical ML and X-ray diffraction (XRD) signals, and the strong emission was also observed during the crystallization process of Cz-alkyl-6 (crystalloluminescence). The ML of the two compounds could be recovered by simply heating, even under solar irradiation, thus making them fascinating solar-renewable organic ML materials (Fig. 6C). More interestingly, colorful organic ML was obtained by doping various fluorescent dyes (the molecular structures are presented in Fig. 6E) with Cz-alkyl-6. The ML properties of the doped system were similar to Cz-alkyl-6, especially the in situ solar-renewable and sensitive ML. As shown in Fig. 6D and F, the ML covered the whole visible region from blue to red with dual emission bands of the host (Cz-alkyl-6) and the guest (fluorescent dyes), and the ML emission color could also be changed by different doping concentrations. The sandwich-type organic ML devices were fabricated by placing the ML sample between quartz and a soft polymer layer. The devices exhibited extremely sensitive ML; for example, the devices doped with 1% of dye G emitted obvious green emission upon being lightly touched with fingers or blown with a gentle stream of nitrogen gas. Accordingly, the ML turn-on pressure threshold was measured to be about 5 kPa on the device surface, much smaller than that of typical inorganic ZnS (ca. 600 kPa).
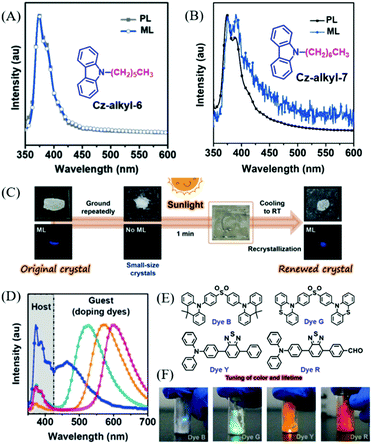 | ||
| Fig. 6 PL and ML spectra of Cz-alkyl-6 (A) and Cz-alkyl-7 (B); the inset shows the molecular structure. (C) The contactless solar-renewal process of Cz-alkyl-6 crystals by sunlight irradiation from a solar simulator. (D) ML spectra of Cz-alkyl-6 doping systems doped with dye B, dye G, dye Y, and dye R (from left to right). (E) The molecular structure of dyes B, G, Y and R. (F) ML photos of the doping system in daylight. Reproduced with permission.59 Copyright 2018, John Wiley and Sons. | ||
The ML from AIE compounds and especially the TPE derivatives
AIE compounds usually have a flexible spatial configuration and loose molecular packing in single crystals; accordingly, they exhibited highly efficient fluorescence and mechanochromism properties in the solid-state.61–67 Once AIEgens possess ML properties, the corresponding ML spectra are similar to their PL spectra, and the ML is always so bright that it can be seen under daylight. Prior to 2015, the Tang group discovered ML from AIE compounds of complexes of Cu(I)Cl, Cu(I)Br, and Cu(I)I (Fig. 7A),60 which were non-emissive in solution but emitted strongly when aggregated in the crystal state with high quantum yields of 61.1–77.9% (Fig. 7B). Intense ML was observed under mechanical stimuli (Fig. 7C).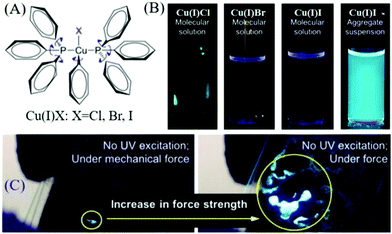 | ||
| Fig. 7 (A) Chemical structures of complexes of Cu(I)Cl, Cu(I)Br, and Cu(I)I. (B) Fluorescent photographs of Cu(I)Cl, Cu(I)Br, Cu(I)I in solution and Cu(I)I in a pyridine/water mixture with a water volume fraction of 90%. (C) The ML photograph of Cu(I)I under the application of increasing mechanical force without UV excitation. Reproduced with permission.60 Copyright 2015, American Chemical Society. | ||
A lot of pure organic AIE compounds were reported to show bright ML, mainly from the Chi and Li groups. In 2015, Chi et al. reported the first ML from purely organic AIEgen of SPFC,68 which showed a high PL (λem = 518 nm) quantum yield of 93.3% and TADF properties in the solid-state. The bright green ML could be observed even under daylight, and the ML spectrum corresponded well to its PL spectrum (Fig. 8A). The dissymmetric molecular configuration induced the polar structure, and the non-centrosymmetric space group of Pna21 should account for its ML property. In 2017, Tang et al. reported another compound of DBT-BZ-DMAC with the properties of TADF, AIE and ML.69 As shown in Fig. 8B, the very brilliant bluish-green ML was observed by scratching the crystalline powders obtained from vacuum sublimation. The single crystals of DBT-BZ-DMAC belonged to the polar space group of Pca2(1) in the orthorhombic system.
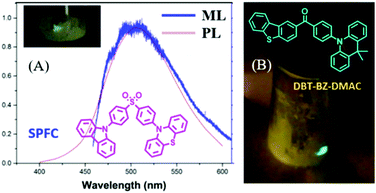 | ||
| Fig. 8 (A) The PL and ML spectra of SPFC; the inset shows the molecular structure and ML photo. Reproduced with permission.68 Copyright 2015, John Wiley and Sons. (B) The molecular structure and ML photos of DBT-BZ-DMAC. Reproduced with permission.69 Copyright 2017, John Wiley and Sons. | ||
Tetraphenylethene (TPE) is one of the most famous AIEgens, and has been utilized to construct many TPE-derivatives as AIEgens, for facile syntheses, easy chemical modification, good thermal stability, and high PL quantum yields.60,70–74 Almost all of the TPE derivatives exhibited mechanochromism for the twisted molecular configuration and the loose molecular packing in crystals. However, the intermolecular interactions of TPE derivatives could be intensified by the introduction of functional groups, while the molecular polarity and crystal space groups would change accordingly. To date, lots of TPE derivatives have been reported to possess ML properties, always showing intense brightness that can be seen even under daylight, thanks to the AIE characteristics.
In 2016, Chi et al. reported bright ML from a series of TPE-based aldehydes (Fig. 9A).75,76 All of these compounds possessed AIE properties with high fluorescence quantum yields. The single crystals of p-P4A belonged to the non-centrosymmetric polar space group of P(2)1, with the presence of compact intermolecular hydrogen bonding of C–H⋯π. The ML spectrum (λem = 487 nm) of p-P4A (Fig. 9B) corresponded well to its PL spectrum in the solid state, indicating the same excited state. However, when the aldehyde group was replaced by the acetyl group, or the TPE moiety with fluorene, the ML disappeared, confirming the important role of the TPE core and strong polar properties of the aldehyde group. When changing the substituent position of the aldehyde group from para- to meta-, or increasing the substituent number, the resultant compounds of m-P4A and p-P4A2 retained the ML character, with the maximum emission peak moving from 472 to 492 nm (Fig. 9C). The single crystal of m-P4A and p-P4A2 both belonged to the non-centrosymmetric polar space groups of P(2)1 and Pna(2)1, respectively. When the aldehyde-substituted thiophene was introduced into TPE, the P4TA compound exhibited more interesting ML in two polymorphs but the same non-centrosymmetric polar space group of P(2)1. The block-like polymorph (Cb phase) showed blue PL (λem = 476 nm), and that of the prism-like polymorph (Cg phase) was green (λem = 498 nm) (Fig. 9A). However, only crystals in the Cg phase exhibited bright green ML (λem = 517 nm) (Fig. 9D), while the crystals in the Cb phase were ML inactive. The phase transition was observed between two crystals, and the Cb phase could be induced to be ML active under fuming dichloromethane (denoted as Cbf phase).
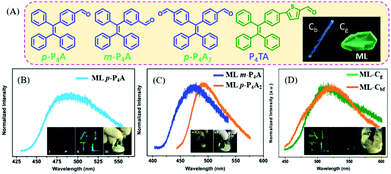 | ||
| Fig. 9 (A) The molecular structures of p-P4A, m-P4A, p-P4A2 and P4TA; the inset shows the Cb and Cg phase of P4TA. The ML spectra of p-P4A (B), m-P4A and p-P4A2 (C); the inset shows the ML photos. Reproduced with permission.75 Copyright 2016, Royal Society of Chemistry. (D) The ML spectra of P4TA in the Cg phase and Cbf phase (fumed by dichloromethane); the inset shows the ML photos. Reproduced with permission.76 Copyright 2015, Royal Society of Chemistry. | ||
In 2016, Li et al. also reported the ML of polymorphs from TMPE (Fig. 10A).77 It was found that the block-like crystal (Cp-form) was in the polar space group of P21(c), and the prism-like crystal (Cc-form) in the non-polar space group of C2. The Cp-form and the Cc-form PL emissions peaked at 420 and 429 nm (Fig. 10B), respectively. However, only the Cp-form crystal exhibited bright deep-blue ML with a peak at 460 nm (Fig. 10C), while the Cc-form was ML inactive. What caused the totally different ML in two polymorphs? Although the piezoelectric effect from the polar space group could contribute to the ML, an explanation on a molecular level would be more convincing. Crystal analysis revealed that the stronger intermolecular interactions, such as π–π and hydrogen bonding interactions of C–H⋯π and C–H⋯O, were found in the Cp-form crystal, resulting in greater compression resistance. Therefore, the well-ordered crystalline phase of the Cc-form crystal could be easily ground to amorphous powder under a tiny force as compared to the Cp-form crystal. The mechanical energy might be exhausted in non-radiative pathways through the slippage of molecular layers in the Cc-form crystal, whereas the non-radiative transition of the Cp-form crystal was greatly suppressed as the intermolecular slippage was largely blocked by the rigid crystal structure; thus, ML was produced since the radiative channel would open under the mechanical stimuli.
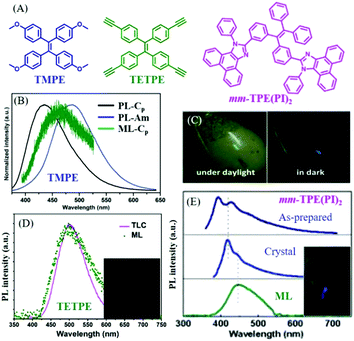 | ||
| Fig. 10 (A) The molecular structures of TMPE, TETPE, and mm-TPE(PI)2. (B) The PL spectra of TMPE in Cp crystal form and amorphous, and the ML spectrum of Cp crystal form. (C) ML photos of TMPE under daylight and dark conditions. Reproduced with permission.77 Copyright 2016, Royal Society of Chemistry. (D) The PL spectrum of TETPE absorbed by a TLC plate, and the ML spectrum; the inset shows a photograph of the ML. Reproduced with permission.78 Copyright 2017, Royal Society of Chemistry. (E) The PL spectra of solid mm-TPE(PI)2 in the as-prepared state, crystal state and the ML spectrum; the inset presents the ML photo. Reproduced with permission.79 Copyright 2018, Royal Society of Chemistry. | ||
In 2017, Li et al. further reported green ML (λem = 498 nm) from a pure hydrocarbon TPE derivative of TETPE (Fig. 10A and D),78 and the ML spectrum corresponded well with the PL spectrum of TETPE absorbed on a thin-layer chromatography (TLC) plate. It was interesting to find that TETPE was nonpolar and belonged to the centrosymmetric space group C2 (indicating the non-piezoelectric property), which was different from previous ML compounds. TETPE crystal emitted blue-greenish light peaked at 451 nm, and possessed strong intermolecular interactions. Since the crystal was difficult to grind into fine amorphous powder, TETPE showed weak mechanochromism properties. The triple bond of C![[triple bond, length as m-dash]](https://www.rsc.org/images/entities/char_e002.gif) C can also induce strong intermolecular interactions because of the positive electronic properties of terminal alkynes, induced by the electron-withdrawing C atom in the sp hybridization. ML could be ascribed to the strong static electronic interactions.
C can also induce strong intermolecular interactions because of the positive electronic properties of terminal alkynes, induced by the electron-withdrawing C atom in the sp hybridization. ML could be ascribed to the strong static electronic interactions.
In 2018, also from the Li group, another deep blue ML from a TPE derivative of mm-TPE(PI)2 was reported.79 As shown in Fig. 10A, two phenanthro[9,10-d]imidazole groups were introduced to the meta-positions of TPE. The ML emission maximum was observed at 445 nm, which red-shifted to the corresponding PL (λem = 417 nm) in the crystal state (Fig. 10E). The mm-TPE(PI)2 also exhibited the centrosymmetric space group of P21/n, and the ML could be ascribed to the large molecular dipole moment and very tight molecular packing in the crystal.
In 2017, Thilagar et al. reported ML from a diarylboryl-phenothiazine derivative of DMPBPTZ80 (Fig. 11A), which could be regarded as a TPE analog due to the isoelectronic property of the B–N bond as compared to the C![[double bond, length as m-dash]](https://www.rsc.org/images/entities/char_e001.gif) C one. Really, DMPBPTZ was AIE active with the mechanochromism property. The crystal belonged to the polar space group of R3c, and emitted green light with a peak at 513 nm (Fig. 11B). The bright greenish-yellow ML (λem = 530 nm) was observed (which red-shifted) under mechanical stimuli rather than PL. Ghosh et al. further connected the diarylboryl group to the phenyl unit of phenothiazine, and the resultant compound of BMBPTZ (Fig. 11A) also exhibited green ML.81 Because of the polar electron donor–acceptor molecular structure, the PL of BMBPTZ red-shifted from 491 to 520 nm after grinding, demonstrating mechanochromism (Fig. 11C). The ML spectrum (λem = 520 nm) corresponds well to the PL spectrum of the ground sample. As expected, the single crystal of BMBPTZ belonged to the non-centrosymmetric space group of P31.
C one. Really, DMPBPTZ was AIE active with the mechanochromism property. The crystal belonged to the polar space group of R3c, and emitted green light with a peak at 513 nm (Fig. 11B). The bright greenish-yellow ML (λem = 530 nm) was observed (which red-shifted) under mechanical stimuli rather than PL. Ghosh et al. further connected the diarylboryl group to the phenyl unit of phenothiazine, and the resultant compound of BMBPTZ (Fig. 11A) also exhibited green ML.81 Because of the polar electron donor–acceptor molecular structure, the PL of BMBPTZ red-shifted from 491 to 520 nm after grinding, demonstrating mechanochromism (Fig. 11C). The ML spectrum (λem = 520 nm) corresponds well to the PL spectrum of the ground sample. As expected, the single crystal of BMBPTZ belonged to the non-centrosymmetric space group of P31.
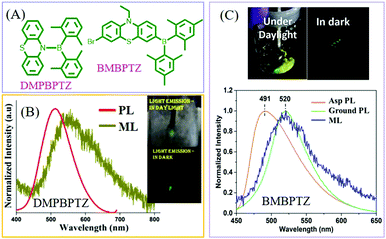 | ||
| Fig. 11 (A) The molecular structures of DMPBPTZ, and BMBPTZ. (B) The PL and ML spectra of DMPBPTZ. Reproduced with permission.80 Copyright 2017, Royal Society of Chemistry. (C) The PL spectra of the as-prepared (Asp) and ground sample, and the ML spectrum of BMBPTZ. The inset shows the ML photos under daylight and dark conditions. Reproduced with permission.81 Copyright 2017, John Wiley and Sons. | ||
Molecular configuration-related ML luminogens
As mentioned above, the ML spectra displayed emission characteristics of the corresponding PL spectra. Although some compounds exhibited changeable PL spectra in the solid-state as a result of mechanochromism, most of the ML spectra resembled PL in the single molecular state, probably because ML was produced at the cracked surface of the crystals. However, the PL of some compounds was strongly correlated with molecular configurations, and the PL characteristics were retained in the crystals. Therefore, the ML spectra should display these characters as well.In 2018, Li et al. reported interesting ML phenomena: the pyrene derivatives of Py-Bpin and Py-Br (Fig. 12A) had ML spectra composed of both monomer and excimer emissions.82 As shown in Fig. 12B, in the THF/water mixture solution of Py-Bpin, the PL intensity gradually increased when the water fracture (fW) increased from 0 to 80%. However, a distinct new red-shifted emissive band appeared at around 460 nm and further increased at higher fW, which should be ascribed to the excimer emission since the pyrene easily formed a dimer because of the planar structure. Both Py-Br (Fig. 12C) and Py-Bpin (Fig. 12D) can emit bright ML that can be observed under daylight. However, only one emission band was observed at around 459 nm in the ML spectrum of Py-Br, which corresponds well to the excimer emission in the solid-state. In contrast, Py-Bpin showed a much different ML spectrum than that of PL. The emission bands around 425 and 450 nm corresponded well to the single molecular emission, while the red-shifted emission band around 470 nm was consistent with the excimer emission in the solid-state. The excimer emission of ML indicated that the molecules inherited the luminous characteristics in the aggregated state, and the intermolecular interactions and molecular aggregates also contributed significantly to ML.
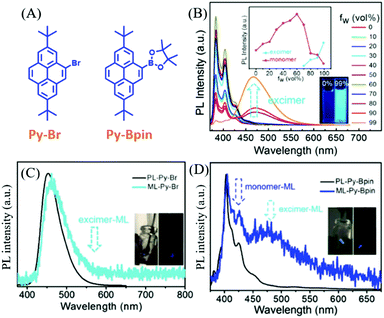 | ||
| Fig. 12 (A) The molecular structures of Py-Br and Py-Bpin. (B) PL spectra and the intensity of the monomer and excimer of Py-Bpin in THF/water mixtures with different water fractions; the inset shows photos of Py-Bpin in the mixture solution with water fractions of 0 and 99%, under the irradiation of 365 nm UV light. PL and ML spectra of (C) Py-Br (D) and Py-Bpin; the inset shows the ML photos under daylight and in dark conditions. Reproduced with permission.82 Copyright 2018, John Wiley and Sons. | ||
Also in 2018, the Li group reported a changeable ML phenomenon in the phenothiazine derivative of FCO-CzS (Fig. 13A),83 whose ML color changed from blue to white and yellow upon continuous mechanical stimuli. As shown in Fig. 13D, the dynamic ML spectra upon grinding were recorded. From Fig. 13B, the FCO-CzS crystal exhibited blue ML at the initial stage of grinding, with only one main emission band present at around 449 nm in the ML spectrum. However, the ML color changed to white upon further grinding, and another emission band arose at around 570 nm and gradually increased in accordance with the fracture of the crystal. The white emission was composed of blue and yellow ML emissions. As the crystal was ground into fine powder, the ML turned to yellow and only one emission band was seen at around 570 nm in the ML spectrum. The CIE coordinates changed from (0.27, 0.30) (blue) to (0.30, 0.35) (white), then to (0.43, 0.47) (yellow). The PL analysis revealed that the FCO-CzS was AIE active (Fig. 13A), and exhibited mechanochromism (Fig. 13E) similar to the ML changes. The crystal emitted fluorescence (λem = 434 nm, τ = 0.5 ns) with a quantum yield of 2%. The PL color changed to white and yellow upon continuous grinding, with the quantum yield increasing to 11%; the yellow emission peak at 544 nm appeared to be TADF with a lifetime of 5.1 ms. The novel PL and ML changes upon grinding could not be ascribed to the changes in the molecular packing from the crystal to the amorphous phase, but the molecular configurations should be considered. There are two configurations of phenothiazine, namely, quasi-axial and quasi-equatorial; the former has a higher energy gap and the latter has better conjugation structure. Therefore, the dynamic PL and ML should be explained by the molecular conformation transition of phenothiazine from quasi-axial to quasi-equatorial upon mechanical stimuli (Fig. 13C). The crystal structure also revealed that FCO-CzS was quasi-axial, which was also consistent with the phenomenon that the PL efficiency was low in the crystals but much higher after grinding.
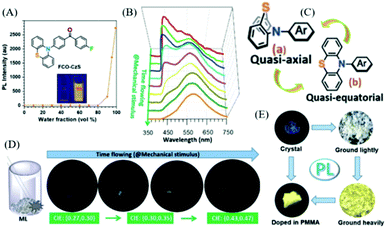 | ||
| Fig. 13 (A) PL intensity of FCO-CzS in a mixed solution of THF/water with different water fractions; the inset shows the photos of FCO-CzS in mixed solution with water fractions of 0 and 99%, under UV irradiation at 365 nm. (B) The ML spectra with different grinding times. (C) Quasi-axial and quasi-equatorial molecular configurations of phenothiazine. (D) ML photographs of FCO-CzS with different grinding times. (E) Photographs of FCO-CzS in different solid states taken under UV irradiation at 365 nm. Reproduced with permission.83 Copyright 2018, John Wiley and Sons. | ||
In 2018, Chi et al. also reported a color-changeable ML from CDpP (Fig. 14A).84 Two kinds of crystals CDpP-B and CDpP-G were cultured in the space groups of P21/n and Cc, respectively. As shown in Fig. 14B, the CDpP-B crystal emitted blue ML (λem = 473 nm) while the green ML for the CDpP-G crystal (λem = 504 nm), corresponded well to their PL spectra. The molecular geometry difference between two crystals is quite small, however, the intermolecular interactions of hydrogen bonding were different because of the different molecular packing in the crystals (Fig. 14C). Combined with the femtosecond transient spectra, the tunable ML of CDpP mainly originated from the different C–H⋯π interactions in the crystal. Crystalline CDpP-B exhibited more C–H⋯π interactions, and the blue ML could be ascribed to the locally excited (LE)-state since the twisting process in the excited state was restricted. However, the C–H⋯π interactions in the CDpP-G crystals were much fewer, and the green ML arose from the twisted intramolecular charge transfer (TICT) excited state as the diphenylamine moiety was relatively free to rotate. In this case, the weak intermolecular interactions in the crystal could also be used to tune the color of the ML.
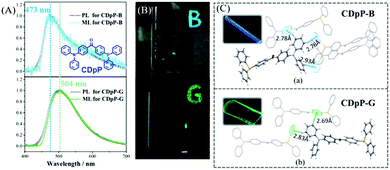 | ||
| Fig. 14 (A) PL and ML spectra of CDpP-B and CDpP-G; the inset shows the molecular structure of CDpP. (B) Photos of the solid-state PL with letters of “B” and “G” under the irradiation of 365 nm UV light; ML photos of CDpP-B (above) and CDpP-G (below). (C) Single crystal structures of CDpP-B and CDpP-G with intermolecular C–H⋯π interactions; the inset shows the corresponding luminescence photos under the irradiation of 365 nm UV light. Reproduced with permission.84 Copyright 2018, Royal Society of Chemistry. | ||
The ML of compounds consisting of the dual emission of fluorescence and phosphorescence
Generally, the phosphorescence of purely organic compounds is hard to observe at room temperature because of the spin-forbidden transition between the ground state and the triplet excited state. However, recent research has revealed that strong and persistent room-temperature phosphorescence (RTP) can be observed in molecular aggregates.85–88 The abnormal RTP was considered to originate from intermolecular interactions since the triplet exciton could be converted from a singlet activated by the spin–orbital coupling effect, and followed by stabilization through the delocalization of intermolecular orbitals. In 2018, the Li group reported the first example of photoinduced phosphorescence in CS-CF3.89 CS-CF3 did not exhibit visible RTP in the as-prepared single crystal sample; however, strong RTP with a lifetime of 299 ms was observed after irradiation by a normal UV lamp for 5 min, which returned to the initial state after two hours of standing under ambient conditions. The crystal structure analysis revealed that the intermolecular distance was shorter after UV irradiation, which led to stronger π–π interactions. The mechanical source is probably a more powerful excitation source than the photo source, and the mechano-phosphorescence was previously reported in some organic crystals. More excitingly, mechanically induced RTP and photosensitive switching between RTP and ML were recently discovered, indicating the peculiar properties of solid-state luminescence. Overall, although there have been some reports of mechanophosphorescence produced by non-phosphorescent crystals at room temperature,43,90 the mechanophosphorescence was often inherited from solid-state phosphorescence properties at room temperature, and the ML spectra were composed of both fluorescence and phosphorescence. As the photo-sensitive crystals underwent structural changes under photoirradiation, the ML properties changed accordingly.In 2017, Li et al. reported dual ML comprised of fluorescence (λem = 350 nm) and phosphorescence (λem = 450 nm) in DPP-BO (Fig. 15).91 However, the solid DPP-BO could not emit phosphorescence under ambient conditions, according to the PL spectrum, indicating that the excited state produced from mechanical stimuli should be different from that of photoirradiation.
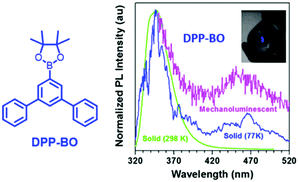 | ||
| Fig. 15 The molecular structure of DPP-BP; the PL spectra of solid DPP-BO at 298 K and 77 K, and the mechanoluminescent (ML) spectrum. Inset: The ML of the as-prepared DPP-BO sample upon grinding with a spatula in daylight. Reproduced with permission.92 Copyright 2017, John Wiley and Sons. | ||
The DPP-BO crystal belongs to the non-centrosymmetric Cmc21 space group. The efficient intermolecular and intramolecular interactions in the crystal enhance the intersystem crossing from the singlet to the triplet state, since the electronic excitation caused by the mechanical stimuli might be a much stronger excitation source than the photostimuli.
In 2017, Li et al. reported compounds of CzS-CH3 and CzS-C2H5 that possessed both RTP and ML properties.92 At room temperature, the PL of the CzS-C2H5 crystal was composed of fluorescence (λem = 426) and RTP (λem = 497, τ = 4.59 ms), and bright blue ML was observed with scraping (Fig. 16A); there was one main emission peak at around 430 nm and another peak tailing in the long wavelength region, which exhibited both fluorescence and phosphorescence. After thorough grinding, the high-contrast mechanochromism effect was observed in the CzS-C2H5 crystal with the color of PL changing from green to blue, and the resultant PL spectrum had similar characteristics to the ML spectrum. As a result, the corresponding RTP lifetime decreased to 1.59 ms, and the PL quantum yield decreased from 8.1% to 3.6% (Fig. 16B). Similar emission behaviour was also observed in CzS-CH3 for the RTP and mechanochromism properties; however, the ML was much weaker and could only be observed in the dark due to the low PL efficiency (ΦPL = 3.0% in crystal, 2.1% after grinding).
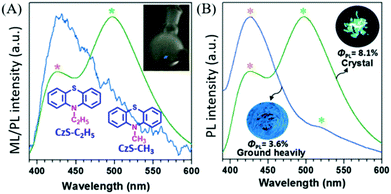 | ||
| Fig. 16 (A) The ML and PL spectra of CzS-C2H5 crystals. Inset: The molecular structure of CzS-C2H5, CzS-CH3, and the ML image of the CzS-C2H5 sample upon grinding with a glass rod in daylight. (B) The prompt PL spectra and photos of crystals of CzS-C2H5 and after grinding heavily, under 365 nm UV-irradiation. Reproduced with permission.91 Copyright 2017, John Wiley and Sons. | ||
In 2018, Babu et al. also reported a phosphorescence-type ML in PT-Bpin (Fig. 17C) at room temperature.93 PT-Bpin had mechanochromism, with its emission changing from blue to yellow upon grinding (Fig. 17A); accordingly, the RTP emission at around 590 nm (τ = 34 ms) gradually disappeared. At 77 K, the frozen solution of PT-Bpin in 2-methyltetrahydrofuran emitted a golden yellow phosphorescence with a lifetime of 1.7 s. Because of the similarity of the ML spectrum to the phosphorescence spectrum at 77 K (Fig. 17D), the ML should be phosphorescence, and the ground sample gradually lost ML in air (Fig. 17B). The single-crystal analysis revealed that the sterically bulky groups around PT-BPin prevented the compact molecular packing that could relieve the quenching of triplet excitons.
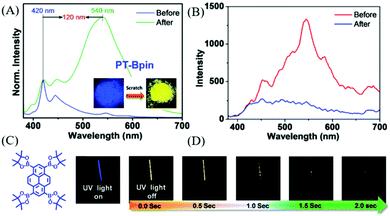 | ||
| Fig. 17 (A) The PL spectra of PT-Bpin before and after grinding/scratching for 2 min under the UV irradiation of 365 nm. The inset shows the corresponding photos. (B) Phosphorescence spectra of the solid at RT before and after grinding. (C) The molecular structure of PT-Bpin. (D) Phosphorescence images of the PT-Bpin glassy MTHF solution (at 77 K for 1 min) in a quartz tube (3 mm) recorded at different time intervals upon turning off the excitation source (365 nm) after 3 s of exposure. Reproduced with permission.93 Copyright 2018, Royal Society of Chemistry. | ||
In 2018, Li et al. also reported distinct ML from the BrFlu-CBr crystal (Fig. 18E),94 in which, the bromine atoms were introduced to increase the spin–orbital coupling and intersystem crossing, and strong Br⋯Br interactions were found in the crystal. BrFlu-CBr exhibited RTP emission at 480 nm upon UV irradiation (Fig. 18A), and the phosphorescence efficiency was 4.56%. More interestingly, as shown in Fig. 18B, after mechanical stimuli, cyan ML was observed, which consisted of the dual emission of fluorescence and phosphorescence, similar to the corresponding PL spectra. Further investigation revealed that after the mechanical stimuli, the green-white ML could still be observed under soft light (Fig. 18C). The ML spectrum was consistent well with the phosphorescence spectrum of the BrFlu-CBr crystal, confirming the mechanically induced RTP. After continuous grinding, the weak blue ML was observed from the obtained BrFlu-CBr powder (Fig. 21D), and the emission band in the long-wavelength region decreased in the ML spectrum. Therefore, the tri-color ML was obtained, and the corresponding CIE coordinates are presented in Fig. 18E. The ML under the different conditions obviously revealed that the molecular packing in the crystal played an important role in regulating the phosphorescence intensity and lifetime. The phosphorescence decay spectra also supported that the crystal state of BrFlu-CBr exhibited higher phosphorescence lifetime, which gradually decreased on further grinding (Fig. 18F).
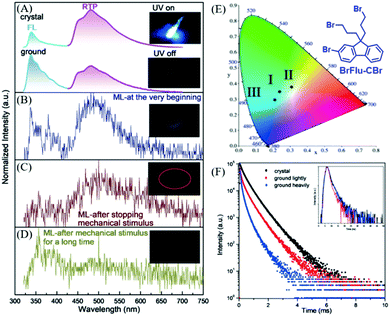 | ||
| Fig. 18 (A) PL spectra of crystals (top) and powder (after light grinding; bottom) of BrFlu-CBr. Inset: Photos of the luminescence of crystals of BrFlu-CBr before and after UV excitation (365 nm). (B) ML spectrum of BrFlu-CBr at the beginning; the inset shows the corresponding ML image. (c) The ML spectrum of BrFlu-CBr after removing the mechanical stimulus; the inset shows the corresponding ML image. (D) The ML spectrum of BrFlu-CBr after removing the mechanical stimulus after a long time; the inset shows the corresponding ML images. (E) The calculated CIE coordinates in the CIE 1931 color space chromaticity diagram based on the ML spectra at different times: I, at the very beginning; II, after stopping mechanical stimulus; III, after mechanical stimulus for a long time. (F) Phosphorescence decay curves of BrFlu-CBr in different states, inset: fluorescence decay curves of BrFlu-CBr in different states. Reproduced with permission.94 Copyright 2018, John Wiley and Sons. | ||
Phthalimide derivatives containing a trifluoromethylphenyl group have been reported to exhibit colorful ML, due to the dipolar molecular structure and the non-centrosymmetric space group.95,96 However, their phosphorescence properties have not been reported. In 2018, Chi et al. reported both phosphorescence and ML of phthalimide derivatives of ImF and ImBr (Fig. 19C). As shown in Fig. 19A, the ImF crystal could emit strong blue fluorescence (λem = 455 nm, τ = 16.8 ns) under the irradiation of 365 nm UV light, and the RTP was also observed at around 555 nm with the lifetime of 35.3 ms. When the fluorine atom was substituted by the bromine one, the resultant ImBr exhibited extraordinary dual-emissive bands (Fig. 19A). It was interesting to find that the blue emission peak at 457 nm showed a fast decay lifetime of 2.6 ns, and an intense emission band at around 548 nm with an ultralong lifetime of 102.1 ms. The RTP could be gradually intensified to the maximum in about 0.8 s upon excitation with UV light (Fig. 19B), and the corresponding emission color changed from blue to white (Fig. 19E). After ceasing excitation, strong yellow emission was observed for ImBr. The crystalline powder of ImF exhibited ML with the corresponding spectrum (λem = 462 nm) being similar to its PL spectrum (Fig. 19F and G). The similar color of ML was also observed for ImBr, but further investigation revealed that the transient ML changed from fluorescence (λem = 460 nm) to fluorescence–phosphorescence dual emission (λem = 462, 527 nm) in about 60 ms (Fig. 19D and F). While the steady-state ML spectrum corresponded well to the PL spectrum of the ground sample, it was amazing to find that following the blue ML at the force-bearing point, the yellow afterglow ribbon lasted for about one second. Thus, ImBr was persistently ML (p-ML) active. The spectrum of p-ML also showed similar emission bands to the PL (Fig. 19D), indicating that the p-ML experienced the same photophysical process, regardless of the different excitation mode.
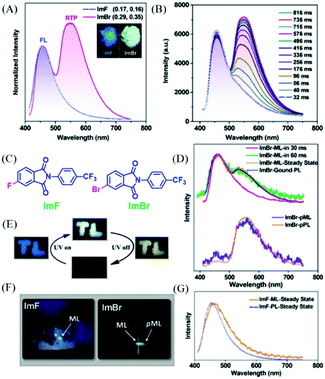 | ||
| Fig. 19 (A) PL spectra of ImF and ImBr in the solid-state (λEx = 365 nm); the inset shows the luminescence photos of the crystalline powders under the illumination of 365 nm UV light. (B) PL spectra of the ImBr crystalline powder under the illumination of 365 nm UV light. (C) The molecular structure of ImF and ImBr. (D) Transient and persistent ML and PL spectra of the pristine and ground samples of ImBr. (E) Tricolor emission switching of ImBr. The color of “TL” changed from blue to white under excitation of 365 nm UV light. After turning off the UV, the color changed to yellow. (F) ML and pML photos of ImF and ImBr taken at room temperature. (G) ML and PL spectra of ImF at room temperature. Reproduced with permission.97 Copyright 2018, John Wiley and Sons. | ||
In 2018, Chi et al. also found the similar p-ML phenomenon in compound CX (Fig. 20A).98 Under the excitation of 365 nm UV light, the yellow RTP (Fig. 20B) was observed in the crystal of CX49, which was recrystallized from a mixture solvent of dichloromethane and n-hexane (4/9, v/v). As shown in Fig. 20C, the dual emission of fluorescence (λem = 460, τ = 7.2 ns) and phosphorescence (λem = 545, τ = 0.15 s) had the overall quantum yield of 40%. The yellow p-ML was also observed after ceasing the mechanical stimuli at room temperature (delayed about 30 ms, Fig. 20E), and p-ML was even brighter at 77 K. The ML spectrum with an emission peak at 545 nm was similar to that of RTP (Fig. 20D).
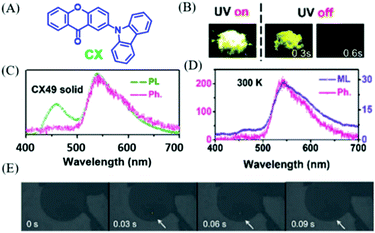 | ||
| Fig. 20 (A) The molecular structure of CX. (B) Photos of CX49 crystals before and after the UV-light irradiation. (C) PL phosphorescence (Ph, delayed 8 ms) spectra of CX in the crystalline (CX49) state. (D) Phosphorescence and ML spectra of CX49 crystals at 300 K. (E) ML photos of the CX49 crystal at 77 K, showing mechanically-induced persistent phosphorescence. Reproduced with permission.98 Copyright 2018, Royal Society of Chemistry. | ||
In 2019, Lin et al. reported a carbazole derivative of 2-(9H-carbazol-9-yl)ethanol (CZEO) with both ML and photo-induced RTP properties.99 The lifetime of CZEO at 555 nm was 15.6 ns, indicating the fluorescence properties. However, the lifetime increased to 739.6 ms after being irradiated for 2 min with UV light at 365 nm (Fig. 21A and C). The activated CZEO spontaneously deactivated when the UV irradiation stopped, and the RTP lifetime decreased to 0.03 ms after being deactivated for 560 s. Therefore, the photo-activated CZEO was metastable and would turn back to the pristine state after ceasing UV irradiation for several minutes. More interestingly, the CZEO crystal exhibited obvious deep blue ML under mechanical stimuli (Fig. 21B), and the ML spectrum corresponded well to its PL spectrum. However, the ML activity was switched off after being activated by UV irradiation for 2 min, demonstrating UV turn-on RTP and turn-off ML properties. The analysis of single crystals revealed that there were 16 molecules in one unit cell, and the cluster consisting of four molecules was fixed by hydrogen bonds with the C–H⋯π distance of 2.643 or 2.656 Å (Fig. 21D). The crystals were found to become tighter after photo-activation. Thus, the pristine looser crystal was easily separated by external mechanical stimuli, producing an electric field for the excitation of ML. After UV activation, the ML was switched off since the tighter crystal was difficult to destroy, and the RTP was generated as the non-radiative transition rate was suppressed. It was interesting that a similar photo stimuli response of the ML and RTP phenomena was found in a previously reported molecule of NIPC, in which, the RTP lifetime (λem = 550 nm, τ = 82.1 ms) was improved by about 10 times (833.9 ms) after being activated by UV light for 2 min, whereas the ML character disappeared.
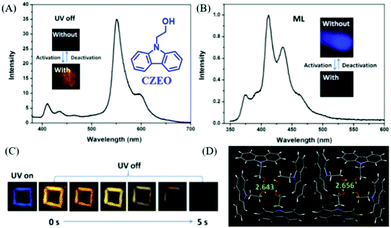 | ||
| Fig. 21 (A) RTP spectrum of the photo-activated CZEO, λEx = 364 nm, inset presents the photos of CZEO upon activation by UV light. (B) The ML spectrum of the photo-activated CZEO; the inset shows the ML photos of CZEO. (C) Photos of the UV-activated CZEO before and after the UV light was turned off. (D) The packing structure of CZEO in a unit cell; the C–H⋯π of hydrogen bond distance was also listed. Reproduced with permission.99 Copyright 2018, Royal Society of Chemistry. | ||
In 2019, Li et al. reported an interesting compound of TPA-B (Fig. 22A) with the combined properties of ML and photoinduced RTP.100 The deep blue ML was observed in TPA-B upon grinding (Fig. 23D), and there were no obvious responses or changes in ML during UV irradiation. Nevertheless, although no RTP was observed at the initial stage of UV irradiation, the intense yellow afterglow was observed and lasted for 1.0 s after the 20 min irradiation (Fig. 22B and C), and the corresponding RTP lifetime increased from 5.32 to 211.13 ms. Meanwhile, the fluorescence at 410 nm was enhanced by about two times with the lifetime increasing from 1.29 to 1.48 ns. After ceasing the UV irradiation, the photoinduced RTP lifetime and intensity decreased, and finally went to the original state after storage for over 100 min. At 77 K, the ML was similar to PL, and the phosphorescence peak at 525 nm could be observed in the ML spectrum. However, the phosphorescence demonstrated little change upon UV irradiation at 77 K, indicating that the photoinduced RTP should be ascribed to the molecular motion in crystals at room temperature, as molecular motion was prohibited at 77 K. The analysis of single crystals confirmed the subtle molecular motions and stronger intermolecular interactions after the photoinduction process.
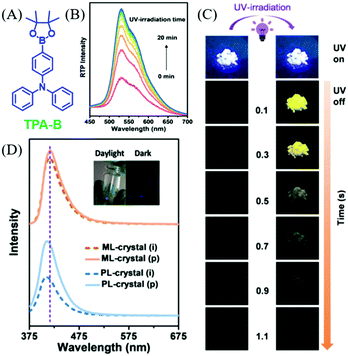 | ||
| Fig. 22 (A) The molecular structure of TPA-B. (B) RTP spectra of TPA-B crystals under UV irradiation from 0 to 20 min. (C) Photo-induced RTP behaviour of TPA-B crystals, including pictures of the fluorescence and afterglow for crystal (i) and crystal (p). (D) ML and PL spectra of TPA-B crystal in the initial state (crystal (i)) and after UV irradiation (crystal (p)). Inset: Photographs of TPA-B upon stirring with a glass rod in the daylight and in the dark. Reproduced with permission.100 Copyright 2018, John Wiley and Sons. | ||
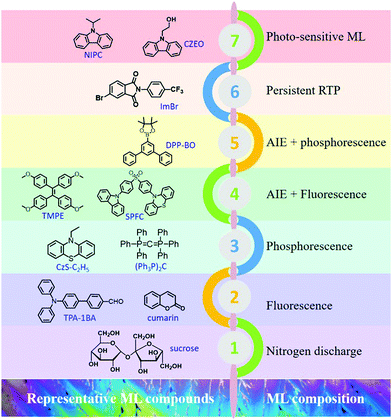 | ||
| Fig. 23 Representative ML compounds and ML compositions during the different periods of development. | ||
Summary and outlook
In summary, organic ML materials have achieved breakthrough developments in recent years, and more characteristics are being discovered from different aspects. It has been recognized that the luminous properties in the aggregated state could be analyzed with the consideration of the MUSIC concept; in other words, the luminous character is highly dependent on the molecular configuration and intermolecular packing style in the aggregate state. The representative ML compounds and ML compositions at different periods of development are listed in Fig. 23. ML has been discovered in different kinds of organic compounds, such as the traditional aromatic compounds, AIE compounds, TADF compounds, etc.101–103 The ML composition is also becoming more complicated, from the initial stage of nitrogen discharge, to the fluorescence, to the dual emission of fluorescence and phosphorescence, and the novel RTP, and photo-sensitive ML. The mechanical stimuli serve as the excitation source, and ML is the peculiar characteristic of molecules in the aggregated state, and more ML features emerge during the research progress. More importantly, the investigation of ML will broaden and deepen the understanding of the aggregate-state chemistry, and promote the development of the luminescence theory in the solid-state. However, it should be acknowledged that the study on organic ML is still in the initial stages, and the systemic theories on the characteristic of organic ML compounds are rare. Although some structural features have been gradually presented, the reported organic ML compounds are still limited to independent cases. On the other hand, the application research of organic ML is scarce, which may limit further development.Conflicts of interest
There are no conflicts to declare.Acknowledgements
This work was supported by the Starting Grants of Tianjin University and Tianjin Government.Notes and references
- Z. Yang, Z. Mao, Z. Xie, Y. Zhang, S. Liu, J. Zhao, J. Xu, Z. Chi and M. P. Aldred, Chem. Soc. Rev., 2017, 46, 915–1016 RSC
.
- T. Yu, L. Liu, Z. Xie and Y. Ma, Sci. China: Chem., 2015, 58, 907–915 CrossRef CAS
.
- Y. Im, M. Kim, Y. J. Cho, J.-A. Seo, K. S. Yook and J. Y. Lee, Chem. Mater., 2017, 29, 1946–1963 CrossRef CAS
.
- Q. Li and Z. Li, Adv. Sci., 2017, 4, 1600484 CrossRef
.
- K. Li and B. Liu, Chem. Soc. Rev., 2014, 43, 6570–6597 RSC
.
- B. Yang, J. Xiao, J. I. Wong, J. Guo, Y. Wu, L. Ong, L. L. Lao, F. Boey, H. Zhang, H. Y. Yang and Q. Zhang, J. Phys. Chem. C, 2011, 115, 7924–7927 CrossRef CAS
.
-
N. J. Turro, V. Ramamurth and J. C. Scaiano, Principles of molecular photochemistry: an introduction, University Science Books, Sausalito, California, 2009 Search PubMed
.
- S. Hirata, Y. Sakai, K. Masui, H. Tanaka, S. Y. Lee, H. Nomura, N. Nakamura, M. Yasumatsu, H. Nakanotani, Q. Zhang, K. Shizu, H. Miyazaki and C. Adachi, Nat. Mater., 2015, 14, 330–336 CrossRef CAS
.
- H. Uoyama, K. Goushi, K. Shizu, H. Nomura and C. Adachi, Nature, 2012, 492, 234–238 CrossRef CAS
.
- M. K. Etherington, F. Franchello, J. Gibson, T. Northey, J. Santos, J. S. Ward, H. F. Higginbotham, P. Data, A. Kurowska, P. L. Dos Santos, D. R. Graves, A. S. Batsanov, F. B. Dias, M. R. Bryce, T. J. Penfold and A. P. Monkman, Nat. Commun., 2017, 8, 14987 CrossRef PubMed
.
- Y. Pan, W. Li, S. Zhang, L. Yao, C. Gu, H. Xu, B. Yang and Y. Ma, Adv. Opt. Mater., 2014, 2, 510–515 CrossRef CAS
.
- Q. Peng, W. Li, S. Zhang, P. Chen, F. Li and Y. Ma, Adv. Opt. Mater., 2013, 1, 362–366 CrossRef
.
- Y. Deng, W. Yuan, Z. Jia and G. Liu, J. Phys. Chem. B, 2014, 118, 14536–14545 CrossRef CAS
.
- J. Luo, Z. Xie, J. W. Y. Lam, L. Cheng, B. Z. Tang, H. Chen, C. Qiu, H. S. Kwok, X. Zhan, Y. Liu and D. Zhu, Chem. Commun., 2001, 1740–1741 RSC
.
- X. Chen, W. Luo, H. Ma, Q. Peng, W. Z. Yuan and Y. Zhang, Sci. China: Chem., 2018, 61, 351–359 CrossRef CAS
.
- Y. Huang, Z. Wang, Z. Chen and Q. Zhang, Angew. Chem., Int. Ed., 2019, 58, 9696–9711 CrossRef CAS
.
- H. Ye, G. Liu, S. Liu, D. Casanova, X. Ye, X. Tao, Q. Zhang and Q. Xiong, Angew. Chem., Int. Ed., 2018, 57, 1928–1932 CrossRef CAS
.
- Y. Huang, J. Xing, Q. Gong, L. C. Chen, G. Liu, C. Yao, Z. Wang, H. L. Zhang, Z. Chen and Q. Zhang, Nat. Commun., 2019, 10, 169 CrossRef
.
- Q. Li, Y. Tang, W. Hu and Z. Li, Small, 2018, 14, 1801560 CrossRef
.
- Y. Cao, V. Fatemi, S. Fang, K. Watanabe, T. Taniguchi, E. Kaxiras and P. Jarillo-Herrero, Nature, 2018, 556, 43–50 CrossRef CAS
.
- Y. Cao, V. Fatemi, A. Demir, S. Fang, S. L. Tomarken, J. Y. Luo, J. D. Sanchez-Yamagishi, K. Watanabe, T. Taniguchi, E. Kaxiras, R. C. Ashoori and P. Jarillo-Herrero, Nature, 2018, 556, 80–84 CrossRef CAS
.
- A. J. Walton, Adv. Phys., 1977, 26, 887–948 CrossRef CAS
.
- G. E. Hardy and J. I. Zink, Inorg. Chem., 1976, 15, 3061–3065 CrossRef CAS
.
- Y. Xie and Z. Li, Chem, 2018, 4, 943–971 CAS
.
- E. Ubba, T. Yu, Z. Yang, J. Zhao, L. Wang and Z. Chi, Chem. – Asian J., 2018, 13, 3106–3121 CrossRef CAS
.
- S. Mukherjee and P. Thilagar, Angew. Chem., Int. Ed., 2019, 58, 2–13 CrossRef
.
- Dengfeng Peng, Bing Chen and F. Wang, ChemPlusChem, 2015, 80, 1209–1215 CrossRef CAS
.
- G. E. Hardy, J. C. Baldwin, J. I. Zink, W. C. Kaska, P.-H. Liu and L. Duboisi, J. Am. Chem. Soc., 1977, 99, 3552–3558 CrossRef CAS
.
- J. I. Zink, G. E. Hardy and J. E. Sutton, J. Phys. Chem., 1976, 80, 248–249 CrossRef CAS
.
- I. Sage, R. Badcock, L. Humberstone, N. Geddes, M. Kemp and G. Bourhill, Smart Mater. Struct., 1999, 8, 504–510 CrossRef
.
- C. N. Xu, T. Watanabe, M. Akiyama and X. G. Zheng, Appl. Phys. Lett., 1999, 74, 1236–1238 CrossRef CAS
.
- N. Terasaki, H. Yamada and C.-N. Xu, Catal. Today, 2013, 201, 203–208 CrossRef CAS
.
- S. M. Jeong, S. Song, K.-I. Joo, J. Kim, S.-H. Hwang, J. Jeong and H. Kim, Energy Environ. Sci., 2014, 7, 3338–3346 RSC
.
- N. Terasaki and C. N. Xu, J. Colloid Interface Sci., 2014, 427, 62–66 CrossRef CAS
.
- X. Wang, H. Zhang, R. Yu, L. Dong, D. Peng, A. Zhang, Y. Zhang, H. Liu, C. Pan and Z. L. Wang, Adv. Mater., 2015, 27, 2324–2331 CrossRef CAS
.
- J.-C. Zhang, Y.-Z. Long, X. Yan, X. Wang and F. Wang, Chem. Mater., 2016, 28, 4052–4057 CrossRef CAS
.
- Y. Chen, Y. Zhang, D. Karnaushenko, L. Chen, J. Hao, F. Ding and O. G. Schmidt, Adv. Mater., 2017, 29, 1605165 CrossRef
.
- D. Tu, C. N. Xu, A. Yoshida, M. Fujihala, J. Hirotsu and X. G. Zheng, Adv. Mater., 2017, 29, 1606914 CrossRef
.
- Y. Yuan and Y.-L. Chen, Chin. J. Polym. Sci., 2017, 35, 1315–1327 CrossRef CAS
.
- P. Jha and B. P. Chandra, Luminescence, 2014, 29, 977–993 CrossRef CAS
.
- D. O. Olawale, T. Dickens, W. G. Sullivan, O. I. Okoli, J. O. Sobanjo and B. Wang, J. Lumin., 2011, 131, 1407–1418 CrossRef CAS
.
- L. M. Sweeting and A. L. Rheingold, J. Am. Chem. Soc., 1987, 109, 2652–2658 CrossRef CAS
.
- J. I. Zink and W. C. Kaska, J. Am. Chem. Soc., 1973, 95, 7510–7512 CrossRef CAS
.
- B. P. Chandra and J. I. Zink, Inorg. Chem., 1980, 19, 3098–3102 CrossRef CAS
.
- J. T. Dickinson, L. B. Brix and L. C. Jensen, J. Phys. Chem., 1984, 88, 1698–1701 CrossRef CAS
.
- J. T. Dickinson and L. C. Jensen, J. Polym. Sci., 1985, 23, 873–888 CAS
.
- J. T. Dickinson, L. C. Jensen and S. K. Bhattacharya, J. Vac. Sci. Technol., A, 1985, 3, 1398–1402 CrossRef CAS
.
- M. Liu, Q. Wu, H. Shi, Z. An and W. Huang, Acta Chim. Sin., 2018, 76, 246–258 CrossRef CAS
.
- B. P. Chandra and M. Elyas, Krist. Tech., 1978, 13, 1341–1343 CrossRef CAS
.
- Q. Sun, L. Tang, Z. Zhang, K. Zhang, Z. Xie, Z. Chi, H. Zhang and W. Yang, Chem. Commun., 2018, 54, 94–97 RSC
.
- M. Fang, J. Yang, Q. Liao, Y. Gong, Z. Xie, Z. Chi, Q. Peng, Q. Li and Z. Li, J. Mater. Chem. C, 2017, 5, 9879–9885 RSC
.
- Y. Yu, C. Wang, Y. Wei, Y. Fan, J. Yang, J. Wang, M. Han, Q. Li and Z. Li, Adv. Opt. Mater., 2019, 18, 1900505 CrossRef
.
- K. Zhang, Q. Sun, Z. Zhang, L. Tang, Z. Xie, Z. Chi, S. Xue, H. Zhang and W. Yang, Chem. Commun., 2018, 54, 5225–5228 RSC
.
- Q. Sun, K. Zhang, Z. Zhang, L. Tang, Z. Xie, Z. Chi, S. Xue, H. Zhang and W. Yang, Chem. Commun., 2018, 54, 8206–8209 RSC
.
- C. Sun, X. Ran, X. Wang, Z. Cheng, Q. Wu, S. Cai, L. Gu, N. Gan, H. Shi, Z. An, H. Shi and W. Huang, J. Phys. Chem. Lett., 2018, 9, 335–339 CrossRef CAS
.
- R. Nowak, A. Krajewska and M. Samoc, Chem. Phys. Lett., 1982, 94, 270–271 CrossRef
.
- W. Wu, T. Narisawa and S. Hayashi, Jpn. J. Appl. Phys., 2001, 40, 1294–1296 CrossRef CAS
.
- N. Kitamura, O. Saravari, H.-B. Kim and S. Tazuke, Chem. Phys. Lett., 1986, 152, 360–363 CrossRef
.
- W. Li, Q. Huang, Z. Mao, Q. Li, L. Jiang, Z. Xie, R. Xu, Z. Yang, J. Zhao, T. Yu, Y. Zhang, M. P. Aldred and Z. Chi, Angew. Chem., Int. Ed., 2018, 57, 12727–12732 CrossRef CAS
.
- J. Mei, N. L. Leung, R. T. Kwok, J. W. Lam and B. Z. Tang, Chem. Rev., 2015, 115, 11718–11940 CrossRef CAS
.
- Y. W. Wu, A. J. Qin and B. Z. Tang, Chin. J. Polym. Sci., 2016, 35, 141–154 CrossRef
.
- Y. Duan, X. Xiang and Y. Dong, Acta Chim. Sin., 2016, 74, 923–928 CrossRef CAS
.
- X. Ye, Y. Liu, Y. Lv, G. Liu, X. Zheng, Q. Han, K. A. Jackson and X. Tao, Angew. Chem., Int. Ed., 2015, 54, 7976–7980 CrossRef CAS
.
- Y. Xie, T. Zhang, Z. Li, Q. Peng, Y. Yi and Z. Shuai, Chem. – Asian J., 2015, 10, 2154–2161 CrossRef CAS
.
- W. Z. Yuan, Y. Gong, S. Chen, X. Y. Shen, J. W. Y. Lam, P. Lu, Y. Lu, Z. Wang, R. Hu, N. Xie, H. S. Kwok, Y. Zhang, J. Z. Sun and B. Z. Tang, Chem. Mater., 2012, 24, 1518–1528 CrossRef CAS
.
- Y. Bai, D. Liu, Z. Han, Y. Chen, Z. Chen, Y. Jiao, W. He and Z. Guo, Sci. China: Chem., 2018, 61, 1413–1422 CrossRef CAS
.
- S. Wang, F. Wang, C. Li, T. Li, D. Cao and X. Ma, Sci. China: Chem., 2018, 61, 1301–1306 CrossRef CAS
.
- S. Xu, T. Liu, Y. Mu, Y. F. Wang, Z. Chi, C. C. Lo, S. Liu, Y. Zhang, A. Lien and J. Xu, Angew. Chem., Int. Ed., 2015, 54, 874–878 CrossRef CAS
.
- J. Guo, X.-L. Li, H. Nie, W. Luo, S. Gan, S. Hu, R. Hu, A. Qin, Z. Zhao, S.-J. Su and B. Z. Tang, Adv. Funct. Mater., 2017, 27, 1606458 CrossRef
.
- J. W. Y. L. Zujin Zhao and B. Z. Tang, Curr. Org. Chem., 2010, 14, 2109–2132 CrossRef
.
- R. Hu, N. L. Leung and B. Z. Tang, Chem. Soc. Rev., 2014, 43, 4494–4562 RSC
.
- M. Gao and B. Z. Tang, ACS Sens., 2017, 2, 1382–1399 CrossRef CAS
.
- J. Mei, Y. Hong, J. W. Lam, A. Qin, Y. Tang and B. Z. Tang, Adv. Mater., 2014, 26, 5429–5479 CrossRef CAS
.
- Q. Xia, Z. Chen, Z. Zhang and R. Liu, Chin. J. Org. Chem., 2018, 38, 2700–2705 CrossRef CAS
.
- B. Xu, W. Li, J. He, S. Wu, Q. Zhu, Z. Yang, Y.-C. Wu, Y. Zhang, C. Jin, P.-Y. Lu, Z. Chi, S. Liu, J. Xu and M. R. Bryce, Chem. Sci., 2016, 7, 5307–5312 RSC
.
- B. Xu, J. He, Y. Mu, Q. Zhu, S. Wu, Y. Wang, Y. Zhang, C. Jin, C. Lo, Z. Chi, A. Lien, S. Liu and J. Xu, Chem. Sci., 2015, 6, 3236–3241 RSC
.
- C. Wang, B. Xu, M. Li, Z. Chi, Y. Xie, Q. Li and Z. Li, Mater. Horiz., 2016, 3, 220–225 RSC
.
- Y. Xie, J. Tu, T. Zhang, J. Wang, Z. Xie, Z. Chi, Q. Peng and Z. Li, Chem. Commun., 2017, 53, 11330–11333 RSC
.
- F. Liu, J. Tu, X. Wang, J. Wang, Y. Gong, M. Han, X. Dang, Q. Liao, Q. Peng, Q. Li and Z. Li, Chem. Commun., 2018, 54, 5598–5601 RSC
.
- K. K. Neena, P. Sudhakar, K. Dipak and P. Thilagar, Chem. Commun., 2017, 53, 3641–3644 RSC
.
- C. Arivazhagan, A. Maity, K. Bakthavachalam, A. Jana, S. K. Panigrahi, E. Suresh, A. Das and S. Ghosh, Chem. – Eur. J., 2017, 23, 7046–7051 CrossRef CAS
.
- Y.-B. Gong, P. Zhang, Y.-R. Gu, J.-Q. Wang, M.-M. Han, C. Chen, X.-J. Zhan, Z.-L. Xie, B. Zou, Q. Peng, Z.-G. Chi and Z. Li, Adv. Opt. Mater., 2018, 6, 1800198 CrossRef
.
- J. Yang, J. Qin, P. Geng, J. Wang, M. Fang and Z. Li, Angew. Chem., Int. Ed., 2018, 57, 14174–14178 CrossRef CAS
.
- Z. Xie, T. Yu, J. Chen, E. Ubba, L. Wang, Z. Mao, T. Su, Y. Zhang, M. P. Aldred and Z. Chi, Chem. Sci., 2018, 9, 5787–5794 RSC
.
- Z. He, W. Zhao, J. W. Y. Lam, Q. Peng, H. Ma, G. Liang, Z. Shuai and B. Z. Tang, Nat. Commun., 2017, 8, 416 CrossRef
.
- Y. Xie, Y. Ge, Q. Peng, C. Li, Q. Li and Z. Li, Adv. Mater., 2017, 29, 1606829 CrossRef
.
- B. Zhou and D. Yan, Adv. Funct. Mater., 2019, 29, 1807599 CrossRef
.
- Z. Lin, R. Kabe, N. Nishimura, K. Jinnai and C. Adachi, Adv. Mater., 2018, 30, 1803713 CrossRef
.
- J. Yang, X. Zhen, B. Wang, X. Gao, Z. Ren, J. Wang, Y. Xie, J. Li, Q. Peng, K. Pu and Z. Li, Nat. Commun., 2018, 9, 840 CrossRef
.
- J. I. Zink, J. Am. Chem. Soc., 1974, 96, 6775–6777 CrossRef CAS
.
- J. Yang, X. Gao, Z. Xie, Y. Gong, M. Fang, Q. Peng, Z. Chi and Z. Li, Angew. Chem., 2017, 56, 15299–15303 CrossRef CAS
.
- J. Yang, X. Gao, Z. Xie, Y. Gong, M. Fang, Q. Peng, Z. Chi and Z. Li, Angew. Chem., Int. Ed., 2017, 56, 15299–15303 CrossRef CAS
.
- V. C. Wakchaure, K. C. Ranjeesh, Goudappagouda, T. Das, K. Vanka, R. Gonnade and S. S. Babu, Chem. Commun., 2018, 54, 6028–6031 RSC
.
- J. Wang, C. Wang, Y. Gong, Q. Liao, M. Han, T. Jiang, Q. Dang, Y. Li, Q. Li and Z. Li, Angew. Chem., Int. Ed., 2018, 57, 16821–16826 CrossRef CAS
.
- J. Nishida, H. Ohura, Y. Kita, H. Hasegawa, T. Kawase, N. Takada, H. Sato, Y. Sei and Y. Yamashita, J. Org. Chem., 2016, 81, 433–441 CrossRef CAS
.
- H. Nakayama, J.-I. Nishida, N. Takada, H. Sato and Y. Yamashita, Chem. Mater., 2012, 24, 671–676 CrossRef CAS
.
- J. A. Li, J. Zhou, Z. Mao, Z. Xie, Z. Yang, B. Xu, C. Liu, X. Chen, D. Ren, H. Pan, G. Shi, Y. Zhang and Z. Chi, Angew. Chem., 2018, 57, 6449–6453 CrossRef CAS
.
- Y. Mu, Z. Yang, J. Chen, Z. Yang, W. Li, X. Tan, Z. Mao, T. Yu, J. Zhao, S. Zheng, S. Liu, Y. Zhang, Z. Chi, J. Xu and M. P. Aldred, Chem. Sci., 2018, 9, 3782–3787 RSC
.
- Q. Huang, X. Mei, Z. Xie, D. Wu, S. Yang, W. Gong, Z. Chi, Z. Lin and Q. Ling, J. Mater. Chem. C, 2019, 7, 2530–2534 RSC
.
- Q. Dang, L. Hu, J. Wang, Q. Zhang, M. Han, S. Luo, Y. Gong, C. Wang, Q. Li and Z. Li, Chem. – Eur. J., 2019, 25, 7031–7037 CrossRef CAS
.
- J. Yang, Z. Chi, W. Zhu, B. Z. Tang and Z. Li, Sci. China: Chem., 2019, 62, 1090–1098 CrossRef CAS
.
- Q. Li and Z. Li, Sci. China Mater., 2019, 62 DOI:10.1007/s40843-019-1172-2
.
- Y. Xie and Z. Li, Chem. – Asian J., 2019, 14, 2524–2541 CrossRef CAS
.
| This journal is © the Partner Organisations 2020 |

