 Open Access Article
A novel application of nanoporous gold to humidity sensing: a framework for a general volatile compound sensor†
Timothy S. B.
Wong
 and
Roger C.
Newman
*
Department of Chemical Engineering and Applied Chemistry, University of Toronto, 200 College Street, Toronto, ON M5S 3E5, Canada. E-mail: tsb.wong@utoronto.ca
First published on 8th January 2020
Abstract
Volatile organic compounds (VOC) are ubiquitous in industrial applications creating a pressing desire for novel transduction pathways to build a broad family of new gas sensors. Nanoporous gold (NPG) is a material with a vast range of untapped potential applications; offering a high surface area found generally in nanomaterials, while also being comparatively simple to fabricate. NPG based sensors can also leverage the unique physics of gold at the nanoscale. In this work, we leverage the multiple unique nanoscale phenomena associated with NPG to demonstrate two novel transduction mechanisms to sense humidity, a model compound. Through direct electrical measurements of NPG, we were able to sense changes in the electronic properties of NPG induced by ambient humidity. We propose two novel transduction mechanisms: chemoresistive changes induced by surface adsorption and electrochemical capacitive changes induced by the electric double layer to detect humidity. To our knowledge this is the first reported application of both these mechanisms for sensing any volatile compounds utilizing NPG.
Introduction
Volatile compounds are applied in a wide variety of industries, ranging from solvents in manufacturing to their direct usage as precursors in chemical synthesis – almost no industry is exempt from the usage of volatile chemicals. However, these chemicals pose significant health & safety risks to workers, the public at large, and the environment. Leaks can often go unnoticed and toxic exposure levels can be reached quickly.1–3 Therefore versatile, robust, and specific gas sensors have the potential to tangibly improve public safety.As a proof of concept to demonstrate the principles of volatile compound sensing with nanoporous gold (NPG), we used humidity as a model system and studied the application of NPG as a humidity sensor. While humidity is often seen as innocuous compared to other volatiles, it plays a central role in industrialized society. From the corrosion of artifacts to the efficiency of catalysts, humidity plays an important role in many chemical processes relevant to everyday life.4 Many industries constantly struggle to manage humidity. For instance, data centers must carefully monitor and maintain humidity to prevent both short circuits in humid environments and static discharges in dry environments.5 Many manufacturing processes also have a very narrow range of suitable humidity. Humidity sensors are the essential first step in addressing these challenges; they provide rapid and accurate feedback to control systems. Humidity sensors, like the wider family of volatile chemical sensors, are built upon a variety of different transduction methods, such as optical or gravimetric methods.6–10 However very few humidity sensors integrate multiple transduction pathways into a single multivariate sensor. While multivariate sensors are inherently more complex, they offer greater robustness as they draw on multiple information sources, to combat noise and sources of systematic bias, and impart an increased degree of selectivity.
Nanomaterials, with their unique properties and high surface area, make excellent candidates for future multi-variate sensors. In particular, NPG is a remarkably attractive advanced material due to the ease of fabrication in comparison to other nanofabrication methods.11–14 In a process inspired by corrosion, an electrochemical bias is applied to a AgAu alloy in an acidic solution. The bias induces the dissolution of Ag but is insufficient to dissolve Au. As Au atoms diffuse on the surface into a more stable configuration, a nanoporous network forms.12,13,15 Furthermore, the geometry of NPG can be controlled through the dealloying conditions and through the addition of small fractions of Pt; offering interesting opportunities for sensor engineering.16–18
While some literature exists leveraging NPG for humidity sensing by cantilever actuation upon water adsorption, the sensing range is limited to a narrow to a band of approximately 15% relative humidity.19 This limited sensing range indicates the need for alternative transduction mechanisms for practical applications. Our proposed application of NPG to sense volatile compounds leverages two key nanoscale phenomena to independently transduce the environmental humidity. The first transduction path is via surface scattering of conduction electrons. In conventional bulk systems, conducting electrons experience electrical resistance through bulk scattering via phonons. However in conductive nanoscale features, the available conduction pathway is shorter than that of the electron mean free path – rather than scattering off phonons in the bulk, electrons scatter at the ligament surfaces.20 This scattering is strongly modulated by changes in the surface.21–23 In humidity sensing applications, water adsorbs to the surface, shifting the surface scattering properties (Fig. 1). As the amount of adsorbed water depends on the environmental humidity, one can deduce relative humidity through changes in resistance measurements. The high surface area of nanomaterials is crucial in amplifying the resistance change by increasing the number of scattering events.
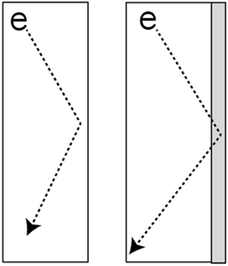 | ||
| Fig. 1 Electron scattering at the ligament surface is the primary resistance to conduction in NPG and is strongly modulated by the substances adsorbed on the surface. | ||
Concurrently, capacitance measurements can be used as a parallel transduction pathway. At metal-electrolytic solution interfaces, a pseudo-capacitive electrical double layer (EDL) forms. Ions in solution distribute themselves in accordance with the local potential difference, storing charges like a capacitor.24 This capacitance is associated with the out of phase alternating current (AC) signal response. The value of the capacitance is sensitive to the physical geometry of the solution within the pore. Induced by changing humidity, the size of the electrical double layer changes both as multiple monolayers of water adsorb to the surface and as the pores fill. While pore filling typically occurs at saturated relative humidity (RH), capillary condensation occurs at partial pressures substantially smaller than the saturation pressure in nanoscale capillaries, due to the reduction in the thermodynamic barrier facilitated by the high curvature of liquids inside nanopores.25–27
In this paper, we prepared NPG samples of different pore sizes by dealloying different alloy compositions. These NPG samples were integrated into a sensing platform which was driven by a sinusoidal signal, and the in-phase and out of phase signal responses were captured to characterize the resistance and capacitance changes. The responses were characterized for a variety of different humidity conditions to demonstrate the feasibility of NPG humidity sensors. Condensation characteristics were also measured by quartz crystal microbalance (QCM). Sensor characteristics, such as sensitivity, hysteresis, and lag time, were also determined. While NPG has been applied to various aqueous and gas sensors,15,28–30 this is the first reported application of NPG to sensing volatile compounds using these transduction mechanisms. The results are promising for the development of a general class of NPG based sensors for detecting volatile compounds.
Materials and methods
Materials
AgAu (23 at% Au) alloys, for electrochemical dealloying, were obtained from Goodfellow, Cambridge, UK. Samples, sized approximately 10 mm × 5 mm, were cut from a 200 μm thick sheet, polished, and annealed at 900 °C for 3 h under a Ar/H2 (2.5% H2) gas flow in a tube furnace. AgAuPt (19 at% Au, 3 at% Pt) was obtained as a cold-rolled 200 μm sheet from Ames National Laboratory – US Department of Energy, Iowa, USA. AuAgPt samples were annealed in the same Ar/H2 atmosphere at 1050 °C for 15 h. 0.1 μm thick white gold leaves (50 wt% Au) for free dealloying were purchased from Gwartzman's Art Supplies, Toronto, Canada.Dealloying
Material characterization
Dealloyed samples were imaged using a Hitachi S5200 SEM in secondary electron mode with an acceleration voltage of 1.0 kV and a beam current of 20 μA.Quartz crystal microbalance mass measurements
Quartz crystal sensors from Stanford Research Systems were covered with dealloyed golf leaf and installed in the quartz crystal holder for the SRS QCM 200. The resonance frequency was captured over 10 second intervals. The QCM holder was placed inside the humidity chamber; the humidity was adjusted, and the corresponding resonance frequency changes were recorded.The humidity chamber (∼750 ml) was constructed from a sealed polypropylene chamber with an inflow rate of 500 ml min−1 maintained for all experiments. A separate port allowed for the probe wiring and the quartz crystal holder to pass through. After placing the sensor into the chamber, the port was covered and sealed. Relative humidity was adjusted by the volume-controlled mixing of dry air and water saturated air streams. Humidity was verified by a third party Arduino humidity sensor. The system equilibrated for 5 minutes after humidity adjustment before measurements were made. Equilibration in frequency measurements was allowed to occur before further humidity changes were made. Mass changes were inferred based on the quartz crystal sensitivity factor provided by Stanford Research Systems.31
Electronic response characterization
Electronic characterization of NPG samples was performed using a four-point probe, with current delivery and voltage measurement performed by separate pairs of probes, in order to accurately measure the impedance of NPG. A 0.1 Vpp, 1 kHz signal was applied, and the NPG response was captured and amplified by an AD620 instrumentation amplifier. The amplified response signal and a reference signal from a 1 Ω series resistor were captured by a Gould Instrument Systems ViewGraf. The reference and output signals were converted into Fourier space by DFT (Discrete Fourier Transform). The signal amplitude was adjusted according to the amplification factor. Impedance was calculated by taking the complex ratio of the reference and output signals.32Transient impedance measurements
Transient impedance was calculated by applying Short Time Fourier Transform (STFT) instead of the DFT to estimate the instantaneous impedance; STFT is a DFT performed on a shifting window of data. Otherwise the same procedure for calculating the impedance was used at each time step.Results and discussion
Dealloying and material characterization
Electrochemical dealloying of bulk AgAu and AgAuPt proceeded in a stable manner, with current densities that ranged from 5–6 mA cm−2 in AgAu samples and 3–4 mA cm−2 in AgAuPt samples. Color changes were observable after a few seconds of dealloying.Electrochemical dealloying of AgAu alloys has been well studied in our group. Previous work using the same dealloying procedure established that the expected mean ligament width is 14 nm with a mean pore size of 17 nm.18 SEM imaging of dealloyed samples qualitatively verified these results (Fig. 2a).
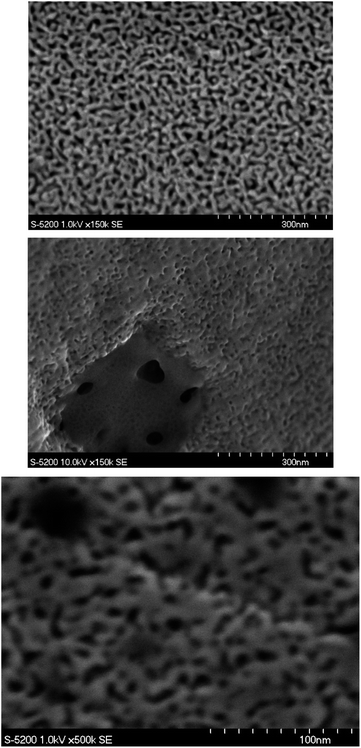 | ||
| Fig. 2 (a) SEM image of electrochemically dealloyed NPG. (b) SEM image of white gold leaf dealloyed in nitric acid. (c) SEM image of electrochemically dealloyed NPG-Pt. | ||
Free dealloying of white gold leaves proceeded rapidly upon submersion of white gold leaf into concentrated nitric acid. The color changed from silver-white to gold-brown within one minute. After quenching the dealloying process, leaves floated on the surface of the acid solution and were easily removed by quartz crystals or SEM stages before being rinsed with deionized water (Fig. 2b).
Comparing the free dealloyed ligaments and electrochemically dealloyed AgAu ligaments, the observed pore sizes are on the same length scale (10–30 nm). When assessing the viability of capillary condensation, one must primarily consider the surface properties and the size of the pores. Since the elemental surface composition and the observed pore sizes of electrochemically dealloyed NPG and free dealloyed NPG are similar, one can reasonably assume that the condensation behaviour is similar.33 While it is clear that free dealloyed gold foil is not identical in its physical properties to electrochemically dealloyed NPG, the similar pore size and surface properties allow for qualitative comparisons of the adsorption behavior to be made.
Furthermore, it is well established that Pt content results in a refinement of the pore and ligament size, with previous work in our group establishing the mean ligament width of 4.3 nm and a mean pore size of 5.5 nm.18 This was observed in SEM images of dealloyed AuAgPt (NPG-Pt) samples (Fig. 2c.). Since smaller pore sizes further reduce the thermodynamic barrier to condensation, one can expect capillary condensation to occur at lower RH when comparing electrochemically dealloyed NPG-Pt and NPG.
Mass change measurements
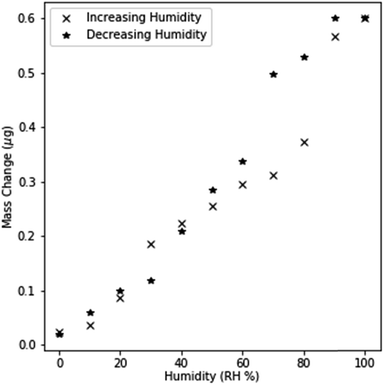
In order to validate that surface adsorption and capillary condensation occurred in NPG, the mass changes were monitored by QCM as humidity was changed at 10% RH intervals. Free dealloyed leaves were used rather than electrochemical dealloyed NPG, as free dealloyed leaves coupled mechanically to the quartz crystal sensor. Small mass changes were observed at low humidity levels (<40% RH) indicating the formation of a monolayer and subsequent multilayers. This dependence of mass change on humidity is similar to Type II IUPAC adsorption, which models multilayer adsorption.33,34 Results deviate from a Type II isotherm at higher RH as mass changes suddenly increase between 60% and 90% RH. This is indicative of pore filling as significant spontaneous condensation of water occurs below the saturation point. Spontaneous condensation is driven by the shifted thermodynamic equilibrium at extremely small curvatures as described by the Kelvin equation.33Further evidence for capillary condensation within the pores is shown by the hysteretic behavior in mass changes (Fig. 3.). The separation between the increasing and decreasing cycle response is most prominent between 60 and 90% RH, indicating that necks within the pores prevent the evaporation of condensed water even when it is locally thermodynamically preferred. Filled pore necks create a metastable state; the condensed liquid in wider capillary regions cannot evaporate until the liquid within the pore neck evaporates. These results are best described by a Type IV adsorption isotherm, which models condensation in mesoporous materials.33 These observations demonstrate that both monolayer adsorption and capillary condensation of water occur within dealloyed NPG. While an imperfect comparison to electrochemically dealloyed NPG, the observed adsorption isotherm indicates that mesoporous condensation can be expected in electrochemically dealloyed NPG.
Electronic response to humidity
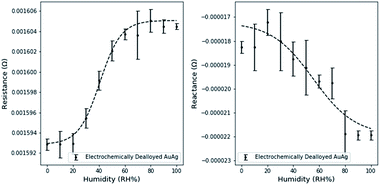
Resistance and reactance measurements were shown to depend on the relative humidity (Fig. 4.). 3 measurements were taken at intervals of 10% RH, the average value was used for plotting and the standard deviation was used to estimate error bounds. Similar experiments on free dealloyed leaves are included in the ESI.†Interestingly, resistance and reactance changes are sensitive in different RH regimes. We observed that resistance changes are largely limited to <60% RH. This can be attributed to the proposed fundamental mechanisms of resistance changes – surface scattering. Since surface scattering is limited to the near surface region, only the first few adsorbed layers induce resistance changes. Therefore, the resistance change effects are limited to low RH levels. Based on existing literature, 60% RH is equivalent to ∼8 layers of atomic water on flat gold surfaces.35 At higher relative humidity, additional water molecules adsorb too far from the surface to affect surface scattering.
Capacitance changes are characterized by the reactance changes, which are not limited to the low RH regime and are sensitive up to 90% RH. This is in line with the expectation that capacitance changes are driven by changes in the size of the electrical double layer, as multiple layers adsorb, and condensation occurs. Partially filled porous materials have been reported before, but not yet leveraged for use in a holistic sensing platform.36
Using a simple linear model, the maximum resistance sensitivity was 2.0 × 10⁻⁷ Ω per (RH%) and the maximum reactance sensitivity was 8.3 × 10⁻⁸ Ω per (RH%). Sensitivity was calculated by estimating the slope in the linear region of resistance and reactance separately. The linear range of resistance was between 20 and 60% RH. The linear range of reactance was between 20 and 80% RH.
The impact of measuring both the resistance and reactance is readily apparent using a simple regression algorithm. Using a k-Nearest Neighbors model (kNN) from the sklearn library in python to predict the humidity based on resistance and reactance measurements. kNN regression was chosen due to the observed non-linearity of the resistance and reactance response. The models were evaluated using a 10 fold shuffle split, where 10% of the data was reserved for model evaluation. kNN was selected due to the highly non-linear nature of the physics and therefore the data set being analysed was also highly non-linear. kNN is well suited for fitting these complex trends. The average R2 value from the resistance only model was 0.743, while the R2 of the reactance only model was 0.119. The combined kNN model produced an R2 of 0.885. This increase in R2 demonstrates that sensing significantly improves through the incorporation of multiple data features. Comparing the predicted humidity and true humidity using this model, we observed that non-linear bias is prevalent at humidity > 80% RH. This is due to the saturation of the response upon complete capillary condensation (Fig. 5). This non-linearity is a clear demonstration of the limitation of the sensing range to <80% RH.
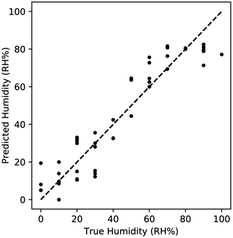 | ||
| Fig. 5 Performance of kNN regression utilizing both features. Sensing improves when combining features, with non-linearity manifesting at high RH% due to saturation. | ||
CO2 scrubbing
In a humid environment, an electrical double layer (EDL) forms at the pore surface, which facilitates capacitive effects. The liquid phase of the EDL is composed of a diffuse concentration gradient of ions in solution. In a humid air stream, there are two possible candidate ions to form the EDL: bicarbonate ions (HCO3−) from dissolved carbon dioxide, and hydroxide (OH−) and a balancing number of hydrogen ions (H+). Using the average concentration of carbon dioxide in air of 350 ppm,37 one expects an equilibrium pH of ∼5.7, versus pH 7, the equilibrium pH of water alone. Since the EDL is dependent on the ion concentration, one would expect the capacitive response to be depend on the ambient carbon dioxide.To verify this hypothesis, we passed the air through an additional column of molecular sieves (10 Å), which removes carbon dioxide from the air stream.38 In a direct comparison to the non-carbon dioxide scrubbed experiment, resistance once again increases with increasing relative humidity in an identical manner (Fig. 6.), but the reactance behavior varied greatly between the two environments. No observable reactance changes are observed at any RH in CO2 scrubbed environments. This lack of reactance changes indicates that there are no measurable changes in capacitive effects associated with the double layer.
These observations demonstrate that even trace gases in the ambient can play a role in electronic measurements, via partition into the solution layer. Careful consideration must be taken in more complex chemical environments when performing electronic characterization. Conversely, this also offers interesting opportunities in indirectly sensing trace compounds if they dissociate into soluble charged species to support the formation of an EDL.
Hysteresis characterization
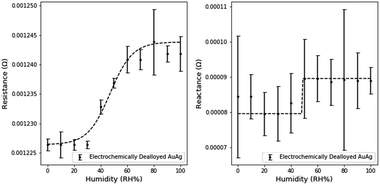
Hysteresis is common in many porous humidity sensors and its characterization is important in evaluating sensor performance.10 Minimal hysteresis is observed in the resistance measurements, while significant hysteresis is observed between 20 and 70% RH in reactance measurements (Fig. 7). This observation can be attributed to the differences in the fundamental mechanisms of transduction in electrical properties. Surface scattering effects are limited to the first ∼8 adsorbed layers based on earlier observations, while capacitance effects are sensitive to the extent of pore filling. Capillary condensation is well known to experience hysteresis due to aforementioned necking effects.26 This hysteresis is borne out not only in the observed reactance hysteresis, but also previously discussed QCM results. This also further underscores the importance of concurrent resistance and reactance measurements. While reactance measurements experience hysteresis, resistance measurements can be used to mitigate the measurement uncertainty. Similarly, reactance measurements can compensate for resistance measurements at high RH, when resistance is no longer sensitive to humidity changes.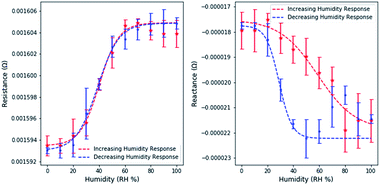 | ||
| Fig. 7 Resistance changes are largely consistent between forward and reverse cycling in electrochemically dealloyed NPG. Reactance changes are highly dependent on historic sensor state. | ||
Sensor delay characterization
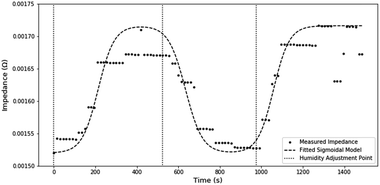
Examining the transient impedance, estimated through STFT, it takes ∼200 s for impedance readings to stabilize (Fig. 8). A large amount of this delay can be associated with the residence time of gas in the humidity chamber and the algorithmic delay caused by the shifting window used in STFT. Using the extreme assumptions that no mixing occurs and an algorithmic delay of 15 s, a lower estimate of the non-transducer delay is roughly ∼105 s. Therefore, the maximum transducer delay can be estimated at 95 s.The transient response also demonstrates the functional stability of the sensor, as the measured impedance is consistent after humidity cycling.
Effect of pore size
Similar electronic characterizations of NPG-Pt were performed at the 10% RH humidity intervals. Small Pt contents are well known to reduce the surface mobility of Au atoms in the dealloying process. This pinning effect refines the pore and ligament sizes.18 The expected impact on sensing would be an increased sensitivity due to the increased surface area, but a decrease in the sensitivity range due to the onset of pore filling at lower RH.The effect of the smaller dimensions is evident when analyzing the humidity response (Fig. 9). The resistance and reactance of NPG-Pt are of a larger magnitude than NPG. The average resistance sensitivity was 1.5 × 10⁻⁶ Ω per (RH%) and the average reactance sensitivity was 1.8 × 10⁻⁷ Ω per (RH%), which represents a significant improvement on NPG. Sensitivities were calculated using the above method with the linear range for resistance between 0 and 60% RH and the linear range for reactance between 10 and 90% RH.
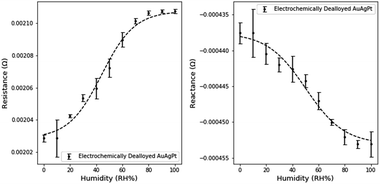 | ||
| Fig. 9 Change in electrical characteristics with variations in humidity levels in electrochemically dealloyed NPG-Pt3. | ||
Furthermore, due to the higher surface area for transduction, the measured noise was also significantly reduced. However the sensing range of NPG-Pt was observed to be limited to ∼80% relative humidity as neither the resistance nor the reactance measurably changed beyond this range. Based on previous work in our group, the mean pore size of NPG-Pt3 is ∼5 nm (NPG-Pt) versus ∼17 nm (NPG).18 Using the Kelvin–Laplace equation as a simple approximation of condensation in cylindrical pores and the assumption of a 55° water-gold contact angle, the approximate condensation point is 84% RH for NPG-Pt3 and 92% RH for NPG.39 These predictions slightly underestimate our observed limitations in the sensing range for NPG and NPG-Pt, but are good approximations of the expected sensing range.
Using a similar kNN model discussed for regression in AuAg based sensors, we observed a R2 of 0.862 for the resistance only model and a R2 of 0.617 for the reactance only model. Similar to the AuAg based sensor, we observed a significant improvement in R2 to 0.928 when using both resistance and reactance data. This further emphasizes the synergistic benefits of utilizing both resistance and reactance data.
Comparing the predicted humidity to the true humidity, we once again observe non-linear bias at high humidity (Fig. 10). At RH > 90% the response is once again saturated due to the effects of capillary condensation. The non-linearity demonstrates that sensing is limited to <90% RH.
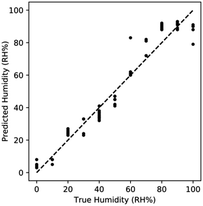 | ||
| Fig. 10 Performance of kNN regression utilizing both features for AuAgPt. Sensing improves when combining features, with non-linearity manifesting at high RH% due to saturation. | ||
Conclusions
We applied nanoporous gold as a novel application in multivariate gas sensing, where resistance and capacitance information were synthesized to sense environmental humidity. The key conclusions of our work were:• Condensation in free dealloyed gold follows a Type IV IUPAC condensation through a study of mass changes.
• Hysteretic effects were observed in mass changes and reactance measurements. Based on the geometry of the porous network, hysteresis effects were attributed to capillary condensation.
• Minimal hysteresis was observed in resistive effects due to the lack of hysteresis in initial adsorption of the first few monolayers in adsorption. We approximated the resistance modulation effects to be limited to roughly 8 atomic layers of waters.
• In NPG, the maximum resistance sensitivity was 2.0 × 10⁻⁷ Ω per (RH%) and the maximum reactance sensitivity was 8.3 × 10⁻⁸ Ω per (RH%).
• A kNN model utilizing both resistance and reactance data improved the R2 value from 0.743 and 0.119 for individual resistance and reactance models to 0.885 in AuAg.
• The capacitive transduction mechanism was demonstrated to be reliant on ambient carbon dioxide, indicating that trace amounts of gases can play a key role in the sensing process.
• The sensor response was demonstrated to be stable through multiple humidity cycles. The maximum sensor transduction delay was estimated to have an upper bound of 95 s.
• Refined pores were shown to decrease the noise and increase the sensitivity, at the expense of sensing range.
• A kNN model utilizing both resistance and reactance data improved the R2 value from 0.862 and 0.617 for individual resistance and reactance models to 0.928 in AuAg.
To our knowledge, this is the first reported concrete application of nanoporous metals to sensing humidity and the first to integrate the complex electronic properties for gas measurement. The basis of this work also opens more interesting opportunities in a wider family of sensors for volatile compound as well as further mechanistic studies of electronic behaviors of materials during condensation.
Conflicts of interest
There are no conflicts to declare.Notes and references
- L. C. Holcomb and B. S. Seabrook, Indoor Environ., 1995, 4, 7–26 CAS.
- S.-H. Hong, D.-C. Shin, Y.-J. Lee, S.-H. Kim and Y.-W. Lim, Hum. Ecol. Risk Assess. Int. J., 2017, 23, 1454–1465 CrossRef CAS.
- M. Hodgson, H. Levin and P. Wolkoff, J. Allergy Clin. Immunol., 1994, 94, 8 Search PubMed.
- C. Leygraf and T. Graedel, Atmospheric Corrosion, John Wiley and Sons, New York, 2000 Search PubMed.
- I. Manousakis, S. Sankar, G. McKnight, T. D. Nguyen and R. Bianchini, Proceedings of the 14th USENIX Conference on File and Storage Technologies (FAST '16), Santa Clara, CA, USA, February 22–25, 2016. Search PubMed.
- P. Fürjes, Sens. Actuators, B, 2003, 95, 140–144 CrossRef.
- T. Islam, U. Mittal, A. T. Nimal and M. U. Sharma, Int. J. Smart Nano Mater., 2014, 5, 169–179 CrossRef.
- R. K. Nahar, V. K. Khanna and W. S. Khokle, J. Phys. D: Appl. Phys., 1984, 17, 2087–2095 CrossRef CAS.
- P. J. Skabara, L. Li, F. Vilela, D. Uttamchandani and J. Forgie, Micro Nano Lett., 2009, 4, 84–87 CrossRef.
- M.-Z. Yang, C.-L. Dai and D.-H. Lu, Sensors, 2010, 10, 10095–10104 CrossRef CAS PubMed.
- J. Biener, M. M. Biener, R. J. Madix and C. M. Friend, ACS Catal., 2015, 5, 6263–6270 CrossRef CAS.
- Y. Ding and Z. Zhang, in Nanoporous Metals for Advanced Energy Technologies, Springer International Publishing, Cham, 2016, pp. 37–81 Search PubMed.
- A. Wittstock, J. Biener and M. Bäumer, Nanoporous Gold: From an Ancient Technology to a High-Tech Material, RSC Publishing, 2012 Search PubMed.
- J. Erlebacher, M. J. Aziz, A. Karma, N. Dimitrov and K. Sieradzki, Nature, 2001, 410, 450–453 CrossRef CAS PubMed.
- A. Wittstock, J. Biener and M. Bäumer, Phys. Chem. Chem. Phys., 2010, 12, 12919 RSC.
- A. A. El-Zoka, J. Howe, R. C. Newman, S. Dogel, M. Reynolds, H. Hosseinkhannazer and D. D. Perovic, Microsc. Microanal., 2016, 22, 1968–1969 CrossRef.
- A. A. El-Zoka, J. Howe, P. Brodersen, D. D. Perovic and R. C. Newman, Microsc. Microanal., 2018, 24, 1946–1947 CrossRef.
- A. A. Vega and R. C. Newman, J. Electrochem. Soc., 2014, 161, C1–C10 CrossRef CAS.
- E. Detsi, Z. G. Chen, W. P. Vellinga, P. R. Onck and J. T. M. D. Hosson, J. Nanosci. Nanotechnol., 2012, 12, 4951–4955 CrossRef CAS PubMed.
- T. Fujita, H. Okada, K. Koyama, K. Watanabe, S. Maekawa and M. W. Chen, Phys. Rev. Lett., 2008, 101(16), 166601 CrossRef CAS PubMed.
- P. Wahl, T. Traußnig, S. Landgraf, H.-J. Jin, J. Weissmüller and R. Würschum, J. Appl. Phys., 2010, 108, 073706 CrossRef.
- M. Hakamada, N. Kato and M. Mabuchi, Appl. Surf. Sci., 2016, 387, 1088–1092 CrossRef CAS.
- M. Hakamada, N. Kato, N. Miyazawa and M. Mabuchi, Scr. Mater., 2016, 123, 30–33 CrossRef CAS.
- V. S. Bagotsky, Fundamentals of Electrochemistry, John Wiley and Sons, Hoboken, New Jersey, 2006 Search PubMed.
- F. Casanova, C. E. Chiang, C.-P. Li, I. V. Roshchin, A. M. Ruminski, M. J. Sailor and I. K. Schuller, Nanotechnology, 2008, 19, 315709 CrossRef PubMed.
- E. Kierlik, P. A. Monson, M. L. Rosinberg, L. Sarkisov and G. Tarjus, Phys. Rev. Lett., 2001, 87, 055701 CrossRef CAS PubMed.
- D. Wallacher, N. Künzner, D. Kovalev, N. Knorr and K. Knorr, Phys. Rev. Lett., 2004, 92, 195704 CrossRef CAS PubMed.
- B. Demirdjian, F. Bedu, A. Ranguis, I. Ozerov and C. R. Henry, Langmuir, 2018, 34, 5381–5385 CrossRef CAS PubMed.
- D. Summerlot, A. Kumar, S. Das, L. Goldstein, S. Seal, D. Diaz and H. J. Cho, Procedia Eng., 2011, 25, 1457–1460 CrossRef CAS.
- F. Zhao, J. Zeng and W.-C. Shih, Sensors, 2017, 17, 1519 CrossRef PubMed.
- Operation and Service Manual, QCM 200, Quartz Crystal Microbalance, Digital Controller, QCM 25, 5 MHz Crystal Oscillator, Stanford Research Systems, Revision 2.5 Published, June 2018. Search PubMed.
- X. Wang, in Life System Modeling and Intelligent Computing, ed. K. Li, M. Fei, L. Jia and G. W. Irwin, Springer Berlin Heidelberg, Berlin, Heidelberg, 2010, vol. 6329, pp. 499–504 Search PubMed.
- J. N. Israelachvili, Intermolecular and Surface Forces, Elsevier, 2011 Search PubMed.
- T. Horikawa, D. D. Do and D. Nicholson, Adv. Colloid Interface Sci., 2011, 169, 40–58 CrossRef CAS PubMed.
- S. Lee and R. W. Staehle, Mater. Corros., 1997, 48, 86–94 CrossRef CAS.
- T. K. Tokunaga, Water Resour. Res., 2011, 47 DOI:10.1029/2011WR010676.
- U. Satish, M. J. Mendell, K. Shekhar, T. Hotchi, D. Sullivan, S. Streufert and W. J. Fisk, Environ. Health Perspect., 2012, 120, 1671–1677 CrossRef CAS PubMed.
- R. V. Siriwardane, M.-S. Shen, E. P. Fisher and J. A. Poston, Energy Fuels, 2001, 15, 279–284 CrossRef CAS.
- S. J. Spencer, G. T. Andrews and C. G. Deacon, Semicond. Sci. Technol., 2013, 28, 055011 CrossRef.
Footnote |
| † Electronic supplementary information (ESI) available. See DOI: 10.1039/d0na00010h |
| This journal is © The Royal Society of Chemistry 2020 |

