 Open Access Article
TiO2 surfaces self-doped with Ag nanoparticles exhibit efficient CO2 photoreduction under visible light†
Yanzhao Zhang,
Xiya Wang,
Peimei Dong,
Zhengfeng Huang,
Xiaoxiao Nie and
Xiwen Zhang *
*
State Key Laboratory of Silicon Materials Science, School of Material Science & Engineering, Zhejiang University, Hangzhou, Zhejiang 310027, P. R. China. E-mail: zhangxw@zju.edu.cn
First published on 30th April 2018
Abstract
Doping with intrinsic defects to enhance the photocatalytic performance of TiO2 has recently attracted attention from many researchers. In this report, we developed an original approach to realise stabilized surface doping using intrinsic defects with the loading of Ag nanoparticles (AgNPs) on the surface. Herein, atmospheric pressure dielectric barrier discharge (DBD) cold plasma was used to help load the AgNPs, and ethanol treatment was used to introduce intrinsic defects (oxygen vacancies and Ti3+) on the surface of materials. This method avoids environmentally hazardous reducing regents and is undertaken under atmospheric pressure, thus reducing energy-consuming and complex operation. We combine the advantages of noble metal nanoparticles and surface doping to enhance the photocatalytic performance under the visible light. The characterization of the materials indicates that the loading of AgNPs and introduction of intrinsic defects can change the electronic structure of the composite material and improve its efficiency. The samples show significant enhancement in CO2 photoreduction to obtain CO and CH4, with yields reaching 141 μmol m−2 and 11.7 μmol m−2, respectively. The formation mechanism of the method for TiO2 modification and CO2 reduction is also discussed.
1. Introduction
The development of TiO2 in the CO2 photoreduction field is restricted by the wide band gap and the high recombination rates of the electrons and holes.1–5 Researchers have modified TiO2 to improve its photocatalytic efficiency, mainly by three methods including making semiconductor heterojunctions,6–8 doping9,10 and the loading of noble metals.11–13 Combining TiO2 with other specific semiconductors could change the electronic structures of the composite materials and therefore restrain the recombination of the photoelectrons and holes.14,15 In this way, these composite materials exhibit high photoreduction efficiency. However, it is always a complex process to prepare these composite materials, which has an adverse effect on this method. Loading noble metals could also be a useful approach to increase the photoreduction efficiency of TiO2, as noted above. These noble metals, such as Ag, Au, Pt and Pd, can act as an electron trap, resulting in the separation of the photoelectrons and holes. Some of these noble metal nanoparticles can also increase the absorption of the visible-light due to their localized surface plasmon resonance effect (LSPR).16–18Doping is also an efficient way to change the electronic structure of a photocatalyst to enhance its photocatalytic activity under visible light. A large amount of different elements have been doped in TiO2 by various ways, including non-metal elements and transition metal elements. However, these doping atoms are always recombination centres during the migration of photogenerated charge carriers from the bulk to the surface.10,19 Therefore, developing a surface doping method is also a promising approach to modifying TiO2, and some researchers have accordingly focused on surface doping. For example, Wang et al. employed an etching and doping method to realise tungsten-doping on the surface of TiO2 nanorods, which promoted its photoelectrochemical performance.9 Chang et al. verified that the surface vanadium-doped TiO2 performed efficiently than the bulk doped TiO2.20 Cho et al. applied thermal treatment to TiO2 to realize tungsten and carbon co-doping on the surface, which improved the photoelectrochemical water splitting efficiency.21
Among the different elements of surface doping, self-doping (intrinsic defects: Ti3+ and oxygen vacancies) has attracted attention because this approach does not need to introduce foreign elements, thus avoiding contamination and pollution by chemicals. In addition, these defects always serve as the active sites during the photocatalytic process. The target substances which participate in the photoreduction or photooxidation can easily adsorb on these active sites, which can promote the photocatalytic process.1,22 However, the surface intrinsic defects in TiO2 can be easily oxidized by oxygen when the photocatalyst is exposed to the air. It is common circumstance that after the photocatalyst is treated with hydrogenation methods and other methods, the surface of the material is oxidized immediately.5,22 The oxidized surface prevents the bulk of the TiO2 from being oxidized by the oxygen in air. Under these circumstances, the intrinsic defects are more widely present in the bulk of the material rather than on the surface. These materials can respond to the visible light due to the intrinsic defects in the bulk but they cannot help CO2 and other target substances adsorb on the surface because of the lack of surface doping.
In order to address the problems outlined above, we herein have developed a different kind of material which can achieve steady surface self-doping. This original approach does not need to use high pressure and toxic chemicals, thus avoiding high energy consumption, toxicity and pollution. This method is based on ethanol treatment and a DBD cold plasma technique. The ethanol treatment process can introduce the intrinsic defects into the TiO2 and the DBD cold plasma with AgNPs loading can help stabilize the surface doping.
2. Experimental section
2.1. Materials
Commercial Ti-foil which was of 99.9% purity was purchased from XinXin Metal Material Company, China. Silver nitrate (AgNO3), hydrochloric acid (HCl, 36%), ethanol (C2H6O) and ammonium hydroxide (NH3·H2O, 26%) were purchased from China Experiment Reagent Co., Ltd. (analytical grade) and were used without further purification.2.2. Deposition of Ag nanoparticles on TiO2 film
The TiO2 film was prepared through the method which was recently reported by our group using pristine TiO2 in the experiments.23 The deposition of the Ag nanoparticles was accomplished by a simple two-step method that is illustrated in Scheme 1. The as-prepared TiO2 film was immersed into the AgNO3 solution of a certain concentration (50 mL). Then, 0.15 M NH3·H2O was added dropwise into the solution under magnetic stirring (Scheme 1(a)). The film was kept in the solution for 15 min until its colour changed to brown and then dried in air.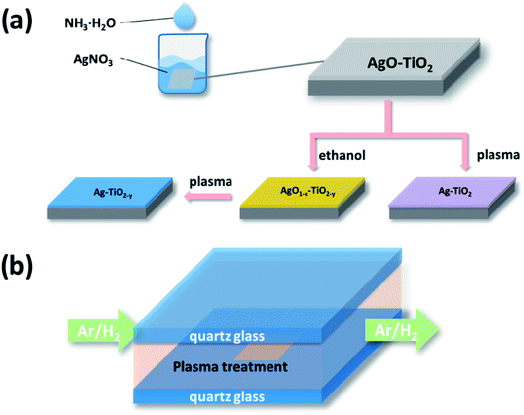 | ||
| Scheme 1 Schematic illustration of the deposition processes of AgNPs (a) and the subsequent DBD cold plasma treatment undertaken at atmospheric pressure (b). | ||
Subsequently the sample was reduced by the DBD cold plasma method. Scheme 1(b) shows the diagram of the DBD cold plasma device. The voltage can be applied to the reactor by two electrodes which are put on the two sides of the quartz glass of the reactor. A mixture of hydrogen and argon (weight ratio 1![[thin space (1/6-em)]](https://www.rsc.org/images/entities/char_2009.gif) :
:![[thin space (1/6-em)]](https://www.rsc.org/images/entities/char_2009.gif) 1) was pumped into the reactor (50 mL min−1). The power source supplied a bipolar sine wave output of 45–200 W at a frequency of 10–20 kHz. The DBD plasma treatment lasted for 30 s. The weight of silver nitrate was controlled to be variously 0.01 g, 0.02 g and 0.03 g, and the corresponding resulting samples were labelled as AP1, AP2 and AP3, respectively.
1) was pumped into the reactor (50 mL min−1). The power source supplied a bipolar sine wave output of 45–200 W at a frequency of 10–20 kHz. The DBD plasma treatment lasted for 30 s. The weight of silver nitrate was controlled to be variously 0.01 g, 0.02 g and 0.03 g, and the corresponding resulting samples were labelled as AP1, AP2 and AP3, respectively.
Additionally, three samples loaded with the same amount of Ag2O as AP1, AP2 and AP3 were treated by heated ethanol before they were reduced by the DBD cold plasma. Each sample was put into a porcelain boat with 10 mL ethanol and covered by another porcelain boat. They were then calcined in a muffle furnace at the heating rate of 10 °C min−1. The samples were kept at 200 °C for 60 min and then naturally cooled. Finally they were treated by DBD cold plasma as mentioned above. The corresponding resulting samples were labelled as ACP1, ACP2 and ACP3, respectively.
2.3. Characterisation
The morphologies of the fabricated samples were examined using scanning electron microscopy (SEM, Hitachi S4800) and transmission electron microscopy (TEM, JEM 2100F). The dispersion of elements (Ag, Ti, and O) on the Ag/TiO2 samples was analyzed by an energy dispersive spectrometer (EDS). The crystal phases of all as-prepared samples were determined using X-ray diffraction (XRD), which was performed on an X′ Pert PRO X-ray diffractometer equipped with Cu Kα radiation (λ = 0.1541 nm). X-ray photoelectron spectroscopy (XPS) was performed on a VG ESCALAB Mark II instrument using Mg-Kα (photon energy = 1253.6 eV) as the excitation source, and its energy analyser working at 50 eV with the overall resolution of 0.2 eV. Due to relative surface charging, the binding energy displayed a shift which was rectified using the C 1s binding energy of 284.6 eV as an internal standard. UV-vis diffuse reflectance spectra of the samples were obtained using a UV-vis spectrophotometer (Shimadzu UV-3600, Japan). BaSO4 was used as a reflectance standard in the UV-vis diffuse reflectance experiments. Raman spectra were obtained on a LabRam HRUVat room temperature.2.4. Photoreduction testing
The CO2 photoreduction experiments with H2O vapor were carried out in a self-assembled reactor (capacity 4500 mL) as reported in our previous study.23 The as-prepared samples were placed at the centre of the reactor under the illumination of two 300 Watt xenon lamp simulated solar light sources. A 350 W ultraviolet lamp was used as the ultraviolet source with the wavelength shorter than 420 nm. Before illumination, ultra-pure CO2 (Air Products, 99.995%) was pumped into the reactor at a flow rate of 300 mL min−1 for 1 h to purge residual air with a flask filled with de-ionized water to add the H2O vapour into the reactor. After purging, illumination commenced and the CO2 flow was stopped. The gaseous products in the reactor were periodically analyzed by gas chromatography (GC/FID, Thermo-Fisher, Trace GC). The room temperature remained at 25 °C during the testing.3. Results and discussion
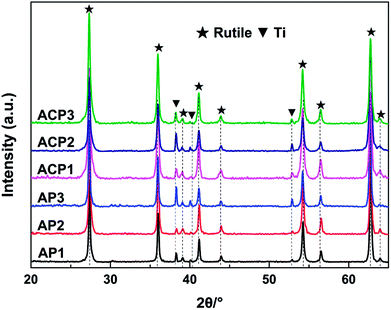
The surface self-doping process on the TiO2 film occurs mainly by three steps. In the first step, Ag2O nanoparticles are deposited on the surface of the film by a chemical precipitation method. The AgNO3 solution reacts with ammonium hydroxide to generate Ag2O nanoparticles and these nanoparticles are deposited on the surface of the film. In the ethanol treatment process, the TiO2 and Ag2O will be partly reduced by the ethanol (Fig. S1; see ESI†). In this process, ethanol liquid becomes gas under 200 °C and the hydroxyl group of the ethanol gas reacts with an oxygen atom in TiO2 to produce acetaldehyde and water, leaving an oxygen vacancy in the crystal lattice, which was revealed in a previous report.10 The main function of the DBD cold plasma is to totally reduce the Ag2O nanoparticles. After this process, the Ag2O nanoparticles are totally reduced to AgNPs and the intrinsic defects in the TiO2 film are preserved.The crystal structures of the six samples were investigated by their corresponding XRD patterns. All of the sample types exhibited a rutile phase (JCPDS card no. 21-1276, Fig. 1). The diffraction peaks appearing at 2θ = 27.4°, 36.1°, 39.1°, 41.2°, 44.1°, 54.3°, 56.6°, 62.74° and 64.03° are attributed to the (110), (101), (200), (111), (210), (211), (220), (002) and (310) lattice planes of the rutile phase, respectively. In addition, the diffraction peaks at 2θ = 38.4°, 40.2° and 53.0° are attributed to the (002), (101), and (102) lattice planes of the Ti metal (JCPDS card no.44-1294), respectively. The sharp diffraction peaks of the XRD patterns reveal that the TiO2 films have good crystallinity. There are no peaks attributed to silver detected in any of the samples. The reason for this may be that the levels of the deposited AgNPs of small diameter are too low to be detected by XRD. This may also illustrate the uniform distribution of the AgNPs. The perfect match of the XRD patterns suggests that neither the process of the DBD plasma nor the annealing in ethanol significantly affected the crystalline structures of the TiO2 film (Fig. 1).
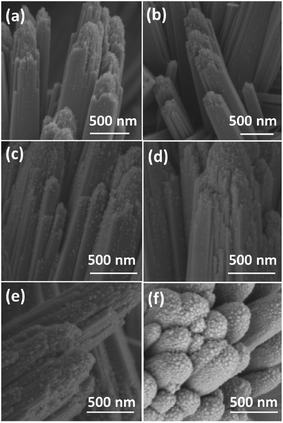
The morphologies of the films were observed by SEM (Fig. 2 and S2†). The film consists of rutile nanorods with loaded AgNPs. These sliver nanoparticles are distributed homogeneously on the surface of the TiO2 nanorods and the diameter of the nanoparticles is typically smaller than 20 nm. With increasing concentration of the AgNO3 solution, the density of AgNPs becomes higher. A single deposited Ag nanoparticle and TiO2 nanorods are further revealed by TEM and HRTEM in Fig. 3. AgNPs deposited on the AP2 (Fig. 3a) were not calcined and the lattice fringes of 0.24 nm can be attributed to the (111) plane of metallic silver. The TiO2 nanorods can be revealed by the 0.32 nm spacing which is attributed to the rutile phase in the (110) plane. According to the SAED pattern of AP2, the rutile phase is a kind of perfect single crystal whose crystal defects are less than those of the polycrystalline phase. This is an important characteristic that can reduce the recombination of the photoelectrons and holes, which helps improve the photocatalytic efficiency. The EDS spectrum of AP2 (Fig. 3b) reveals its elemental composition. The elemental copper originates from the TEM sample holding grid and Ti, O, and Ag are from the sample AP2. The spectrum also illustrates that the present experimental approach can help avoid contamination by impurity elements. The HRTEM image of ACP2 (Fig. 3c) and the EDS spectrum (Fig. 3d) are nearly the same as those of AP2.
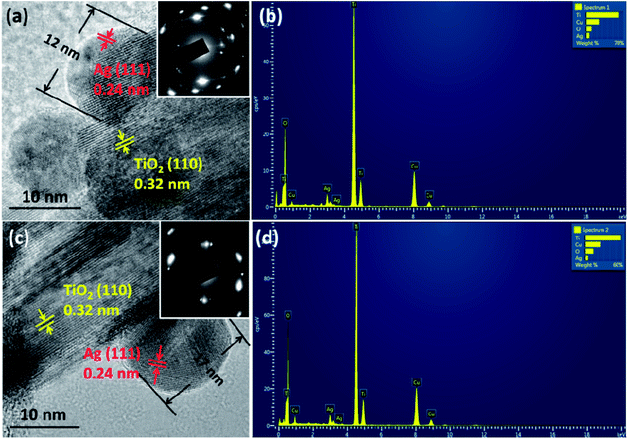 | ||
| Fig. 3 HRTEM images of the samples: AP2 (a) and ACP2 (c). The insets are their corresponding SAED patterns; (b) (d): EDS spectra of AP2 and ACP2, respectively. | ||
Comparison between AP1–3 and ACP1–3 indicates that their SEM images are nearly the same with regard to the density of AgNPs, which also verifies that the ethanol treatment and DBD plasma did not change the morphology and microstructure of the films.
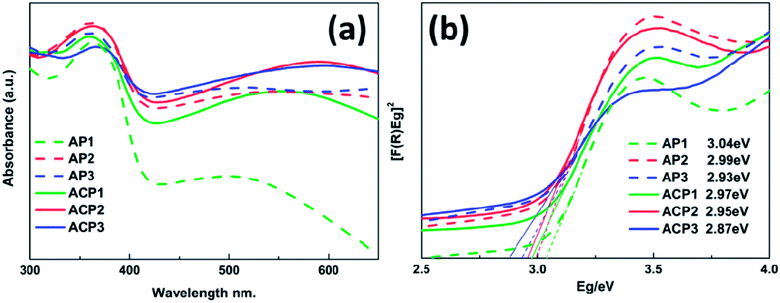
The UV-vis spectra of various samples are shown in Fig. 4a and the corresponding band gap values are also indicated by Tauc plots in Fig. 4b. These samples are characterized by strong absorption in the UV region (below 410 nm wavelength), which is a typical rutile TiO2 absorption.24–26 It is apparent that the deposited AgNPs can expand the absorption of these films and with the increasing amount of the deposited AgNPs, these samples have better response to visible-light (above 420 nm wavelength). In addition, the absorption edges of these samples also have a slight red shift due to the deposited AgNPs; this trend becomes more significant with the increasing concentration of the AgNPs, which is consistent with results of the SEM images. Compared to the AP1–3 series of samples, the ACP1–3 series of samples exhibits more positive response to the visible light which may be owing to the introduction of the surface doping intrinsic defects that can be revealed by XPS and Raman spectra. There is a wide absorption range from about 460 nm to 600 nm with peaks at about 540 nm, which is attributed to the LSPR effect of the metallic sliver nanoparticles.16–18 The UV-vis spectrum of pristine TiO2 film is shown in the Fig. S3† which indicates that AP and ACP samples increase the visible light absorption.
As can be seen in Fig. S4,† peaks attributed to Ag, O, Ti and C are present, which is consistent with the EDS results indicating the existence of these pure elements. High resolution XPS was employed to investigate the surface chemical bonding of the samples (Fig. 5). Fig. 5a and b show Ag 3d high resolution XPS spectra of samples AP1 and ACP1, respectively. In these two spectra, there are only two symmetrical peaks at 367.9 eV and 373.9 eV which can be attributed to Ag0 3d5/2 and 3d3/2, respectively.27–29 Their spin energy separation is 6.0 eV, which means that the AgNPs exist as metallic silver. These results confirm the results of the crystal plane in the HRTEM images, indicating that the DBD plasma can thoroughly reduce the Ag+ to Ag0. The spectra in Fig. 5c and d show Ti 2p states with binding energies of 458.22 and 463.85 eV, consistent with the standard 2p3/2 and 2p1/2 binding energies, respectively for Ti4+ in rutile. The XPS spectra of ACP1 are different from those of AP1. The spectrum in Fig. 5d shows not only the peak of the Ti4+ 2p states but also the binding energies of 457.59 and 462.83 eV which are consistent with the standard 2p3/2 and 2p1/2 binding energies for Ti3+, respectively.30–33 These results illustrate that the ethanol treatment has introduced Ti3+ into the films. Samples AP1 and ACP1 show an O 1s state with a binding energy of 529.49 eV, consistent with the standard binding energy for O in rutile. This peak has two shoulders at 530.79 and 531.99 eV attributed to an oxygen vacancy and surface hydroxyl band, respectively.30–32 There were oxygen vacancies (Fig. 5e) found in sample AP1. According to the previous reports, the numerous un-coordinated O atoms existing on the surface of the rutile can facilitate the formation of oxygen vacancies. However, it is apparent that the shoulder peak attributed to oxygen vacancy (Fig. 5f) accounts for a greater proportion in sample ACP1, which illustrates that the ethanol treatment can introduce oxygen vacancies in rutile. As the detection depth of XPS is restricted to several nanometers below the surface of TiO2, the results indicate that these intrinsic defects are distributed mainly on the surface. The additional experiment (Fig. S5†) also illustrates that the AgNPs help introduce these intrinsic defects onto the surface of the samples.
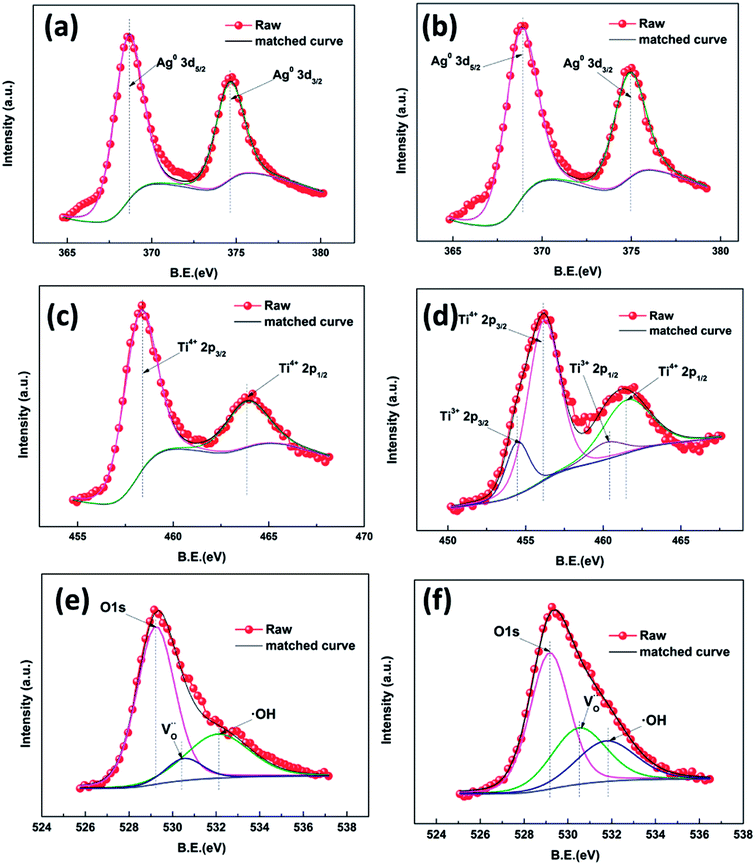 | ||
| Fig. 5 High resolution XPS spectra of Ag 3d of different samples: AP1 (a) and ACP1 (b);Ti 2p: AP1 (c) and ACP1 (d); O 1s: AP1 (e) and ACP1 (f). | ||
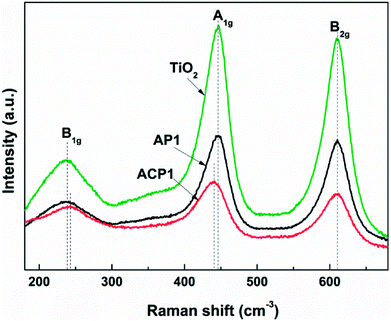
In order to obtain better confirmation on the presence of intrinsic defects, Raman spectra of the samples (Fig. 6) were also observed. Three typical Raman bands at 230 (B1g mode), 440 (A1g mode), and 610 (B2g mode) cm−1 are observed which are attributed to rutile.34,35 The results of the phase composition revealed from the Raman spectra also corroborate the XRD results. Compared with the Raman spectra of pristine TiO2 and AP1, the Raman spectrum of ACP1 shows a clear blueshift at 230 (B1g mode) and redshift at 440 cm−1 (A1g mode). At the same time, the peak at 610 cm−1 (B2g mode) does not show any difference among these three samples. According to a previous report, these phenomena indicate that the sample ACP1 was doped with intrinsic defects by the ethanol treatment.35 However, the sample AP1 that has not been treated with ethanol conforms to the pristine TiO2, which means that intrinsic defects have not been introduced into the sample AP1. These results are in good accordance with those from the XPS and UV-vis spectra.
Fig. 7 shows the CO2 photoreduction activity of the different samples in the presence of H2O vapor under the influence of visible light. Before the experiments, blank tests were performed, which consisted of measurements of light-illuminated CO2 + H2O without the photocatalyst, CO2 + H2O with the photocatalyst in the dark, and light-illuminated photocatalyst in H2O without CO2, respectively, and no target products were detected in the blank tests. It is obvious that the samples ACP1–3 exhibits higher photocatalytic efficiency than samples AP1–3 under both two kinds of light. The highest CO and CH4 production rates of ACP3 are about 141 μmol m−2 and 11.7 μmol m−2 under simulated solar light, respectively, while the production rates of AP3 are about 88 μmol m−2 and 7.9 μmol m−2. The highest CO and CH4 production rates of ACP3 are about 47 μmol m−2 and 5.5 μmol m−2 under visible light, respectively, while the production rates of AP3 are about 37 μmol m−2 and 4.6 μmol m−2. The samples that deposited Ag nanoparticles exhibit excellent photocatalytic performance compared with the P25 under visible light, which should be attributed to the LSPR effect of the Ag nanoparticle. This is also consistent with the results of the UV-vis spectra.
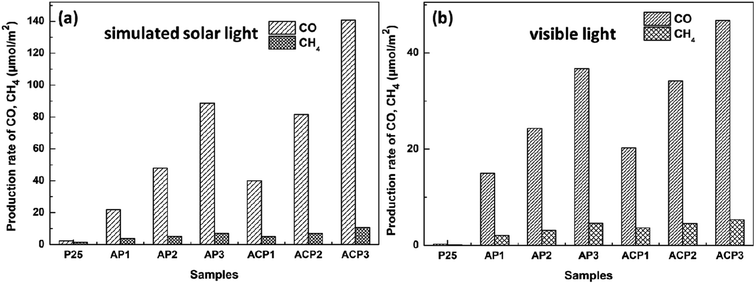 | ||
| Fig. 7 Evolution of CO and CH4 yields of different samples under simulated solar light (a) and visible light (b). | ||
The probable mechanism of the enhanced photocatalytic activity may be due to the following explanation. The AgNPs deposited on the TiO2 surface are motivated by the visible light due to the LSPR effect. The photoelectron flow injects into the conduction band (CB) of TiO2, causing separation between electrons and holes, attributed to the Schottky barrier between TiO2 and AgNPs.36–39 The resulting LSPR effect can also promote the charge migration by producing the local surface electronic field and restraining the recombination of electrons and holes.38,40,41 TiO2 nanorods act as electron acceptors, and the reactants H2O and CO2 adsorbed on the surface of the nanorods will react with the electrons.1,22 The reason for the higher photocatalytic efficiency of sample ACP1–3 is due to the surface doping. The surface defects will act as adsorption and reaction sites. CO2 molecules adsorbed on the surface of the TiO2 film accept the separated electrons to produce an anion radical. The different possible products obtained are a result of the consuming of different numbers of electrons. As shown in Scheme 2, one CH4 molecule obtained consumes more electrons (8H) than the generation of CO (2H). The CO is not only a product but also a reactant of the CH4. As a result, the yield of CO is generally much higher than that of CH4.42,43
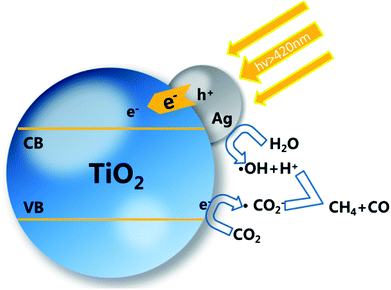 | ||
| Scheme 2 Schematic of mechanism for photocatalytic process of TiO2 decorated with AgNPs and surface self-doping. | ||
4. Conclusions
In conclusion, Ag–TiO2 films with surface self-doping of intrinsic defects were obtained by a facile method involving ethanol treatment as the reducing reagent to realize the self-doped films. The films with AgNPs and intrinsic defects have broadened response to visible light and promote the adsorption of reactive reagents, thus enhancing the photocatalysis performance of the films for reduction of CO2 to CO and CH4 under visible light. The highest yields of CO and CH4 under visible light were about 141 μmol m−2 and 11.7 μmol m−2, respectively. The loaded AgNPs change the band gap of the photocatalyst which broadens the absorption of the film in the visible light and the near-infrared regions, thereby achieving photocatalytic activity. The deposited AgNPs are likely to help stabilize the surface intrinsic defects, which can promote the photoreduction on the surface. These results indicate that the composite films presented herein may be a way to combine the advantages of noble metal addition and self-doping. We hold the opinion that the deposited noble metal nanoparticles can have an impact on the surface self-doping, which should be further studied. It is an edification for researchers who are interested in TiO2 self-doping and noble metal deposition.Conflicts of interest
The authors declare that there is no conflict of interest.References
- X. Pan and Y.-J. Xu, J. Phys. Chem. C, 2013, 117, 17996–18005 CAS.
- X. Chen, L. Liu, P. Y. Yu and S. S. Mao, Science, 2011, 331, 746–750 CrossRef CAS PubMed.
- Z. Wang, C. Yang, T. Lin, H. Yin, P. Chen, D. Wan, F. Xu, F. Huang, J. Lin, X. Xie and M. Jiang, Energy Environ. Sci., 2013, 6, 3007–3014 CAS.
- H. Cui, W. Zhao, C. Yang, H. Yin, T. Lin, Y. Shan, Y. Xie, H. Gu and F. Huang, J. Mater. Chem., 2014, 2, 8612–8616 RSC.
- Y. Zhou, C. Chen, N. Wang, Y. Li and H. Ding, J. Phys. Chem. C, 2016, 120, 6116–6124 CAS.
- C. Y. Su, C. C. Wang, Y. C. Hsueh, V. Gurylev, C. C. Keic and T. P. Perng, Nanoscale, 2015, 7, 19222–19230 RSC.
- L. Wang, S. Liu, Z. Wang, Y. Zhou, Y. Qin and Z. L. Wang, ACS Nano, 2016, 10, 2636–2643 CrossRef CAS PubMed.
- Y. J. Yuan, Z.-J. Ye, H.-W. Lu, B. Hu, Y. H. Li, D.-Q. Chen, J.-S. Zhong, Z.-T. Yu and Z.-G. Zou, ACS Catal., 2016, 6, 532–541 CrossRef CAS.
- Y. Wang, Y.-Y. Zhang, J. Tang, H. Wu, M. Xu, Z. Peng, X.-G. Gong and G. Zheng, ACS Nano, 2013, 7, 9375–9383 CrossRef CAS PubMed.
- L. Kong, Z. Jiang, C. Wang, F. Wan, Y. Li, L. Wu, J.-F. Zhi, X. Zhang, S. Chen and Y. Liu, ACS Appl. Mater. Interfaces, 2015, 7, 7752–7758 CAS.
- K. Lee, R. Hahn, M. Altomare, E. Selli and P. Schmuki, Adv. Mater., 2013, 25, 6133–6137 CrossRef CAS PubMed.
- J. Fei and J. Li, Adv. Mater., 2015, 27, 314–319 CrossRef CAS PubMed.
- R. Dong, Q. Zhang, W. Gao, A. Pei and B. Ren, ACS Nano, 2016, 10, 839–844 CrossRef CAS PubMed.
- T. J. Athauda, J. G. Neff, L. Sutherlin, U. Butt and R. R. Ozer, ACS Appl. Mater. Interfaces, 2012, 4, 6916–6925 Search PubMed.
- X. Chen, J. Wei, R. Hou, Y. Liang, Z. Xie, Y. Zhu, X. Zhang and H. Wang, Appl. Catal., B, 2016, 188, 342–350 CrossRef CAS.
- H. Zhang, G. Wang, D. Chen, X. J. Lv and U. H. Jinghong, Chem. Mater., 2008, 20, 6543–6549 CrossRef CAS.
- J. H. He, I. Ichinose, T. Kunitake and A. Nakao, Langmuir, 2002, 18, 10005–10010 CrossRef CAS.
- K. Awazu, M. Fujimaki, C. Rockstuhl, J. Tominaga, H. Murakami, Y. Ohki, N. Yoshida and T. Watanabe, J. Am. Chem. Soc., 2008, 130, 1676–1680 CrossRef CAS PubMed.
- M. Kong, Y. Li, X. Chen, T. Tian, P. Fang, F. Zheng and X. Zhao, J. Am. Chem. Soc., 2011, 133, 16414–16417 CrossRef CAS PubMed.
- S.-m. Chang and W.-s. Liu, Appl. Catal., B, 2011, 101, 333–342 CrossRef CAS.
- I. S. Cho, C. H. Lee, Y. Feng, M. Logar, P. M. Rao, L. Cai, D. R. Kim, R. Sinclair and X. Zheng, Nat. Commun., 2013, 4, 1723 CrossRef PubMed.
- L. Liu, Y. Jiang, H. Zhao, J. Chen, J. Cheng, K. Yang and Y. Li, ACS Catal., 2016, 6, 1097–1108 CrossRef CAS.
- X. Cheng, P. Dong, Z. Huang, Y. Zhang, Y. Chen, X. Nie and X. Zhang, J. CO2 Util., 2017, 20, 200–207 CrossRef CAS.
- D. Li, H. Haneda, N. K. Labhsetwar, S. Hishita and N. Ohashi, Chem. Phys. Lett., 2005, 401, 579–584 CrossRef CAS.
- J. Choi, H. Park and M. R. Hoffmann, J. Phys. Chem. C, 2010, 114, 783–792 CAS.
- J. C. Yu, J. G. Yu, W. K. Ho, Z. T. Jiang and L. Z. Zhang, Chem. Mater., 2002, 14, 3808–3816 CrossRef CAS.
- D. Wang, Z.-H. Zhou, H. Yang, K.-B. Shen, Y. Huang and S. Shen, J. Mater. Chem., 2012, 22, 16306–16311 RSC.
- X. Yang, Y. Wang, L. Xu, X. Yu and Y. Guo, J. Phys. Chem. C, 2008, 112, 11481–11489 CAS.
- J. G. Yu, J. F. Xiong, B. Cheng and S. W. Liu, Appl. Catal., B, 2005, 60, 211–221 CrossRef CAS.
- H. Tong, S. X. Ouyang, Y. P. Bi, N. Umezawa, M. Oshikiri and J. H. Ye, Adv. Mater., 2012, 24, 229–251 CrossRef CAS PubMed.
- H. L. Cui, W. Zhao, C. Y. Yang, H. Yin, T. Q. Lin, Y. F. Shan, Y. Xie, H. Gu and F. Q. Huang, J. Mater. Chem., 2014, 2, 8612–8616 RSC.
- S. S. Kim, H. Lee, B. K. Na and H. K. Song, Catal. Today, 2004, 89, 193–200 CrossRef CAS.
- X. D. Cheng, P. M. Dong, Z. F. Huang, Y. Z. Zhang, Y. Chen, X. X. Nie and X. W. Zhang, J. CO2 Util., 2017, 20, 200–207 CrossRef CAS.
- J. Qiu, S. Li, E. Gray, H. Liu, Q.-F. Gu, C. Sun, C. Lai, H. Zhao and S. Zhang, J. Phys. Chem. C, 2014, 118, 8824–8830 CAS.
- J. C. Parker and R. W. Siegel, Appl. Phys. Lett., 1990, 57, 943–945 CrossRef CAS.
- X. Lin, F. Rong, D. Fu and C. Yuan, Powder Technol., 2012, 219, 173–178 CrossRef CAS.
- C. Gunawan, W. Y. Teoh, C. P. Marquis, J. Lifia and R. Amal, Small, 2009, 5, 341–344 CrossRef CAS PubMed.
- H. M. Sung-Suh, J. R. Choi, H. J. Hah, S. M. Koo and Y. C. Bae, J. Photochem. Photobiol., A, 2004, 163, 37–44 CrossRef CAS.
- H. Zhao, F. Huang, J. Hou, Z. Liu, Q. Wu, H. Cao, Q. Jing, S. Peng and G. Cao, ACS Appl. Mater. Interfaces, 2016, 8, 26675–26682 CAS.
- M. Z. Ge, C. Y. Cao, S. H. Li, Y. X. Tang, L. N. Wang, N. Qi, J. Y. Huang, K. Q. Zhang, S. S. Al-Deyab and Y. K. Lai, Nanoscale, 2016, 8, 5226–5234 RSC.
- M. Pelaez, N. T. Nolan, S. C. Pillai, M. K. Seery, P. Falaras, A. G. Kontos, P. S. M. Dunlop, J. W. J. Hamilton, J. A. Byrne, K. O'Shea, M. H. Entezari and D. D. Dionysiou, Appl. Catal., B, 2012, 125, 331–349 CrossRef CAS.
- S. N. Habisreutinger, L. Schmidt-Mende and J. K. Stolarczyk, Angew. Chem., Int. Ed., 2013, 52, 7372–7408 CrossRef CAS PubMed.
- E. Karamian and S. Sharifnia, J. CO2 Util., 2016, 16, 194–203 CrossRef CAS.
Footnote |
| † Electronic supplementary information (ESI) available. See DOI: 10.1039/c8ra02362j |
| This journal is © The Royal Society of Chemistry 2018 |

