Thermal and optical properties of multiblock macrocycles with hysteretic polymorphic transition†
Kota
Nabeya
a,
Takahiro
Muraoka
 *ab,
Norihisa
Hoshino
c,
Miho
Aizawa
d,
Takashi
Kajitani
d,
Tomoyuki
Akutagawa
 c,
Atsushi
Shishido
 d,
Takanori
Fukushima
 d and
Kazushi
Kinbara
 *a
*a
aSchool of Life Science and Technology, Tokyo Institute of Technology, 4259 Nagatsuta-cho, Midori-ku, Yokohama 226-8503, Japan. E-mail: muraoka@go.tuat.ac.jp; kkinbara@bio.titech.ac.jp
bPRESTO, Japan Science and Technology Agency, 4-1-8 Honcho, Kawaguchi, Saitama 332-0012, Japan
cInstitute of Multidisciplinary Research for Advanced Materials, Tohoku University, 2-1-1 Katahira, Aoba-ku, Sendai, 980-8577, Japan
dLaboratory for Chemistry and Life Science, Institute of Innovative Research, Tokyo Institute of Technology, 4259 Nagatsuta-cho, Midori-ku, Yokohama 226-8503, Japan
First published on 22nd February 2018
Abstract
The thermal phase transition properties of macrocyclic molecules 1 and 2 consisting of aromatic 1,4-bis(phenylethynyl)benzene (BPEB) components and tetraethylene glycol (TEG) chains were investigated. 1 and 2 are structural isomers with a small difference at the connecting points of the BPEB units with TEG chains, where 1 has a lower structural symmetry than 2. 1 forms a crystal Cr1 upon cooling from the isotropic liquid. 1 at Cr1 shows a crystal-to-crystal polymorphic transition upon heating affording Cr2. Since the Cr1-to-Cr2 phase transition of 1 is an exothermic process, Cr2 is considered to be thermodynamically more stable than Cr1. Indeed, cooling from Cr2 shows no phase transition, and this hysteretic polymorphic transition allows the preparation of 1 in different crystalline states, namely Cr1 and Cr2, at room temperature. In contrast, 2 shows a reversible transition between a crystal and a nematic phase upon temperature changes. Based on the polymorphism of 1, switching of an optical property as a memory function is also demonstrated. Thus, the molecular structure of 1 with a lower structural symmetry than that of 2 is likely an important factor for the crystallization and its thermoresponsive polymorphic phase transition property.
Introduction
Manipulation of alignment and orientation of molecules by external stimuli potentially leads to actuating, switching and memory materials. The fluidic properties of liquid crystals with one- or two-dimensionally ordered molecular alignment and orientation enable them to be applied in dynamic devices such as displays.1 Meanwhile, the three-dimensional ordered alignment of molecules with close packing in molecular crystals is attractive to develop solid materials with optical, electrical and magnetic properties. However, dynamic functions are generally difficult to be performed by molecular crystals due to the rigid packing of molecules.2 Photo-reactions can be a trigger for the dynamic response of the crystals, and photoresponsive mechanical actuation was demonstrated by the crystals of photoisomerizable molecules such as diarylethene derivatives.3–10 Crystal design with thermal polymorphic transition is another approach for dynamic responses.11–14 In our continuing studies on the functional multiblock amphiphiles,15–21 we have recently reported a thermoresponsive property of a crystalline macrocyclic compound consisting of two aromatic groups, trans-azobenzene and 1,4-bis(phenylethynyl)benzene (BPEB), strapped by two tetraethylene glycol (TEG) chains.11,12 The macrocyclic compound affords needle-shaped single crystals that show a reversible thermal polymorphic transition between two crystalline states. This polymorphic transition is triggered by a conformational change at the TEG chains, allowing macroscopic bending as well as a change in the dielectric constant of the crystal upon changes in temperature. Based on our previous study, herein we report a fundamental study on the thermal responses of TEG-containing macrocycles, 1 and 2, with significant influence of the small structural differences of the molecules on their thermoresponsive behaviors.Results and discussion
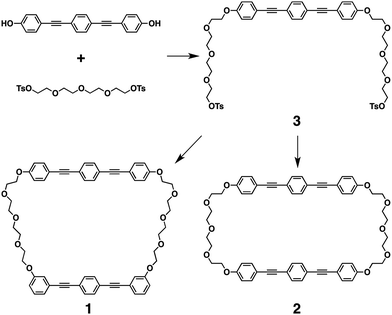
Macrocycles 1 and 2 consist of two BPEB units that are strapped by two TEG chains (Scheme 1), where the symmetry of the molecules is higher for 2 than that for 1 due to the slightly different connection mode of the TEG chains to one of the BPEB units from each other. 1 and 2 were synthesized from ditosylate 3,11 as a common precursor, by Williamson ether coupling with 3,3′-{1,4-phenylenebis(ethyne-2,1-diyl)}diphenol and 4,4′{1,4-phenylenebis(ethyne-2,1-diyl)}diphenol, respectively (Scheme 1). Although, interestingly, 1 and 2 are structural isomers with small differences, their solubility is largely different from each other. Namely, 1 is readily soluble in most common organic solvents such as tetrahydrofuran (THF), CHCl3 and toluene at 25 °C. In contrast, 2 is a poorly soluble compound for many of the common organic solvents and is slightly soluble in CHCl3 at high temperatures close to the boiling point. Its solid-state morphology is also different from each other, where 1 was obtained as a needle-like white crystalline solid, while 2 was a fine powdery solid.Single crystals of 1 with a needle shape were successfully obtained by vapor diffusion between THF and n-hexane. X-ray crystallographic analysis at 100 K revealed that the crystal belongs to a monoclinic system with the P21/c space group.‡ The two BPEB units of 1 adopt a vertical geometry in the molecule (Fig. 1 and Fig. S1 in the ESI†).
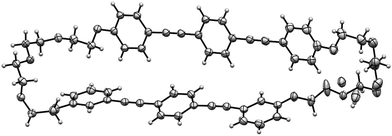 | ||
| Fig. 1 ORTEP drawing of 1 (50% thermal ellipsoids). The X-ray diffraction data were collected at 100 K. The TEG chain contains disordered parts. | ||
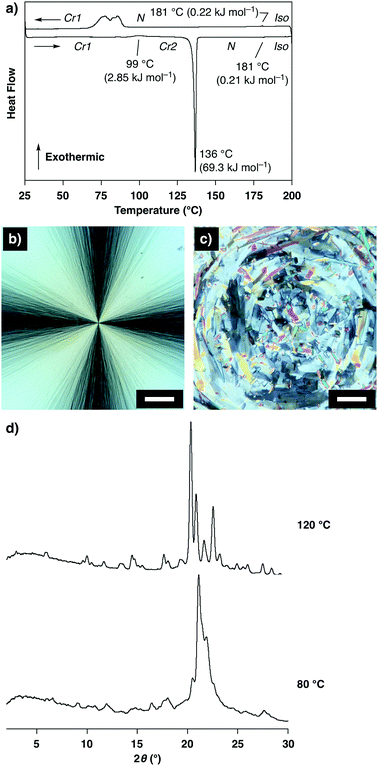
Unlike the compound reported in our previous paper,11,12 the as-grown crystals of 1 prepared by vapor diffusion between THF and n-hexane showed no thermal polymorphic transition, while transitions into a nematic phase and isotropic liquid were observed at 136 °C and 181 °C, respectively, in the heating process as indicated by differential scanning calorimetry (DSC) measurements, polarized optical microscopic (POM) observations and powder X-ray diffraction (XRD) measurements (Fig. S2 and S3, ESI†). Interestingly, a crystal-to-crystal transition with a characteristic hysteretic behavior was observed in the heating process after cooling from 200 °C (isotropic liquid). At 80 °C after cooling from 200 °C to 25 °C followed by heating, 1 was non-fluidic, and powder XRD measurements displayed multiple well-defined peaks in the small- and wide-angle regions (Fig. 2d, 80 °C), suggesting the formation of a crystalline phase (Cr1). In the DSC measurements, heating of 1 at Cr1 showed a broad exothermic peak at 99 °C (ΔH = 2.85 kJ mol−1), and further heating triggered two endothermic phase transitions at 136 and 181 °C (ΔH = 69.3 and 0.21 kJ mol−1, respectively; Fig. 2a). POM observations displayed a submillimeter scale spherocrystalline texture at Cr1 (Fig. 2b). At 99 °C, the texture changed into a mosaic pattern (Fig. 2c), and further heating resulted in a schlieren texture (T > 136 °C) followed by a dark-field image (T > 181 °C). In the powder XRD measurements of 1 at Cr1, diffraction patterns were substantially unchanged at 25 and 80 °C, which significantly changed at 120 °C in the temperature elevation process to show multiple well-defined peaks (Fig. 2d). These results suggest a crystal-to-crystal (Cr1 to Cr2) thermal polymorphic transition of 1 upon heating.§
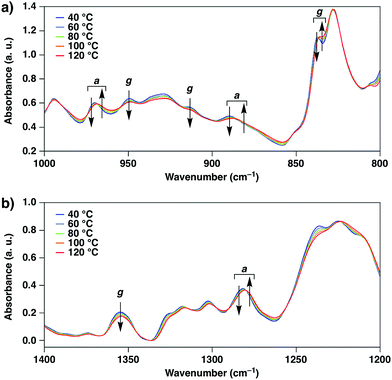
Variable-temperature infrared (IR) spectroscopic measurements of 1 in Cr1 showed changes in the intensities and shapes of the vibrational absorption bands upon temperature elevation. Notably, the changes in the absorption bands assigned to the C–C bonds at the TEG chains with gauche (837, 915, 950 and 1352 cm−1) and anti (890, 968 and 1282 cm−1) forms indicate the conformational changes at the TEG chains (Fig. 3).22 Thus, it is suggested that the conformations at the TEG chains of 1 alter upon temperature changes, which likely triggers the Cr1-to-Cr2 thermal polymorphic transition.
The exothermic transition from Cr1 to Cr2 of 1 at 99 °C suggests that Cr2 is thermodynamically more stable than Cr1. Indeed, DSC showed no peak in the cooling process from 125 °C (Cr2) and also in the subsequent heating process up to 136 °C (Fig. 4a). The texture observed by POM and the powder XRD pattern was essentially retained in this cooling process (Fig. 4b–d). These results indicate that once Cr2 of 1 is formed upon heating from Cr1, Cr2 remains below 136 °C, thereby suggesting the higher thermodynamic stability of Cr2 than Cr1 which allows a significant hysteretic behavior.
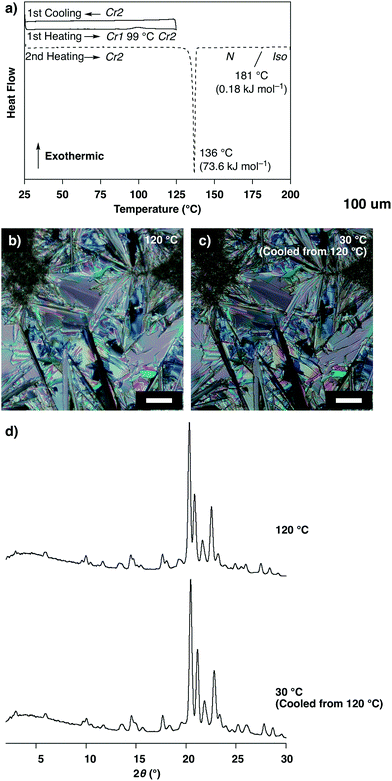 | ||
| Fig. 4 (a) Differential scanning calorimetric (DSC) profile of 1 at Cr1 in the temperature elevation process followed by reduction process between 25 and 125 °C (solid lines) and the subsequent temperature elevation process (broken line, rate: 5.0 °C min−1), N and Iso represent the nematic phase and isotropic liquid, respectively; (b and c) polarized optical micrographs of 1 (b) at 120 °C in the temperature elevation process from the Cr1 and (c) at 30 °C after subsequent cooling from 120 °C (scale bars: 50 μm); (d) powder X-ray diffraction patterns of 1 at 120 and 30 °C corresponding to the conditions of (b) and (c), respectively. The pattern at 120 °C is the same as shown in Fig. 2d. | ||
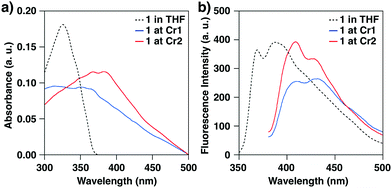
To study the changes in the alignment of the BPEB units of 1, UV-vis absorption and fluorescence spectra of 1 were measured at 25 °C (Fig. 5). In THF, 1 showed the maximal absorption band at λAbs: 325 nm, and the fluorescence spectrum upon excitation at 325 nm showed vibrational bands at λFL: 369 and 388 nm associated with the C–C stretching modes of the arylethynyl units.23 In the crystalline states, 1 displayed red-shifted absorption and fluorescence bands compared to those in the THF solution. At Cr1, the maximal bands were observed at λAbs: 351 and 364 nm, and the absorption peaks are red-shifted to 367 and 382 nm at Cr2. The fluorescence spectral profiles at Cr1 and Cr2 are also different from each other. Thus, it is indicated that the intra- and/or intermolecularly stacked geometry of the BPEB units of 1 in the crystalline states changes upon thermal polymorphic transition.
In sharp contrast to 1, 2 shows an unremarkable phase transition property (Fig. S4 and S5, ESI†). In the heating process of 2 after cooling from 250 °C, an endothermic peak was observed at 230 °C (ΔH = 36.1 kJ mol−1) in the DSC measurement. A reversible profile with an exothermic peak at 225 °C (ΔH = 33.7 kJ mol−1) was observed in the subsequent cooling process. In the powder XRD measurement, multiple defined peaks were observed at 50 °C after cooling from 250 °C. POM displayed a birefringent texture with small domains at 30 °C. Upon heating, the XRD peaks disappeared at a temperature higher than 230 °C, where a schlieren texture was observed using a POM. Hence, 2 likely forms a crystal at room temperature and melts into a nematic phase at 230 °C upon heating. The small difference in the molecular structures between 1 and 2 results in such significantly different crystallization properties and thermal responses, suggesting structural sensitivity of the TEG-containing macrocycles.
The hysteretic thermal transition behavior of 1 between Cr1 and Cr2 is expected to allow bistability of the physical properties of the crystals at the same temperature region, so as to realize a memory function. As a demonstration, we investigated the regulation of an optical property of 1 by a thermal process. Retardation values R of 1 at Cr1 and Cr2 were evaluated under polarized optical microscopy at 25 °C, where 1 was enclosed in a glass cell with an interval of 5.65 μm. R of 1 at Cr1 was evaluated to be RCr1 = 238 nm (birefringence Δn = 0.042). By heating 1 at Cr1 to 130 °C followed by cooling to 25 °C at a rate of 5.0 °C min−1, 1 at Cr2 was prepared, where 1 at Cr2 showed a significantly higher R value (RCr2 = 474 nm, Δn = 0.084) than RCr1.¶ Thus, by taking advantage of the hysteretic thermal polymorphic transition, an optical property of the crystal could be successfully switched at room temperature.
Experimental
General methods
1H and 13C nuclear magnetic resonance (NMR) spectra were recorded using a Bruker BioSpin AVANCE III 400 or on a Bruker BioSpin AVANCE III 500, where the chemical shifts were determined with respect to tetramethylsilane (TMS) or a residual non-deuterated solvent as an internal standard. Electrospray ionization time-of-flight mass (ESI-TOF MS) spectra were recorded using a Bruker micrOTOF-Q II-S1 with MeOH or MeCN as a solvent. Matrix-assisted laser desorption/ionization time-of-flight mass (MALDI-TOF MS) spectra were recorded using a Bruker Daltonics autoflex speed spectrometer in positive and reflector mode with α-cyano-4-hydroxycinnamic acid (CHCA) as a matrix. Fourier-transform infrared (FT-IR) spectra were recorded using a JASCO FT/IR-4100 spectrometer equipped with a JASCO ATR PRO 670H-S. Analytical thin layer chromatography (TLC) was performed on a precoated, glass-backed silica gel Merck 60 F254. Differential scanning calorimetry (DSC) measurements were carried out using a Mettler–Toledo DSC 1 differential scanning calorimeter, where temperature and enthalpy were calibrated with In (430 K, 3.3 J mol−1) and Zn (692.7 K, 12 J mol−1) standard samples in sealed Al pans. Cooling and heating profiles were recorded and analyzed using the Mettler–Toledo STARe software system. Optical microscopic observation was carried out using an Olympus BX51 optical polarizing microscope with a Linkam 10002 hot stage. Variable temperature powder X-ray diffraction measurements were carried out using a Rigaku Nano-viewer system equipped with a Pilatus 100K (Dectris) detector. Temperature was controlled using a Mettler Toledo FP82 hot stage. Retardation (R) was evaluated using a polarized optical microscope (Olympus, BX50) equipped with a hot stage (Mettler Toledo, FP-90 and FP-82HT) and a Berek compensator (Olympus, U-CBE) or a tint plate (Olympus, U-TP137).24 UV-Vis absorption spectroscopy was carried out using a JASCO V-670 spectrometer with an integrating sphere attachment. Fluorescence spectroscopy was carried out using a JASCO FP-6500 spectrometer with an integrating sphere attachment.Reagents
3 was synthesized following the procedure described in our previous study.11 CHCA, 1,4-diethynylbenzene, and PdCl2(PPh3)2 were purchased from Tokyo Chemical Industry. CuI, K2CO3, NaCl and Na2SO4 were purchased from Nacalai Tesque. Deuterated solvents were purchased from Kanto Chemical. These commercial reagents were used without purification. Anhydrous N,N-dimethylformamide (DMF) and tetrahydrofuran (THF) were purchased from Kanto Chemical and passed through sequential two or three drying columns on a Glass-Contour system just prior to use. Anhydrous NEt3 was purchased from Sigma-Aldrich. Deionized water (filtered through a 0.22 μm membrane filter, >18.2 MΩ cm) was purified using a Milli-Q system (Millipore).Synthesis of 3,3′-[1,4-phenylenebis(ethyne-2,1-diyl)]diphenol
To a dry NEt3 (20 mL) solution of 3-iodophenol (2.2 g, 10 mmol), PdCl2(PPh3)2 (0.14 g, 0.20 mmol) and CuI (76 mg, 0.40 mmol) a NEt3 (20 mL) solution of 1,4-diethynylbenzene (0.50 g, 4.0 mmol) was added dropwise at 25 °C under Ar. After being stirred overnight at 25 °C, the reaction mixture was evaporated to dryness under reduced pressure. To the residue CH2Cl2 was added, and the yellow precipitates were collected by filtration followed by washing with 2 M HCl aq. and water. The yellow solid was dissolved in MeOH at 60 °C followed by filtration. The filtrate was evaporated under reduced pressure to yield 3,3′-[1,4-phenylenebis(ethyne-2,1-diyl)]diphenol as a yellow solid (0.92 g, 74% yield).1H NMR (400 MHz, CD3OD): δ = 7.49 (s, 4H), 7.19 (t, J = 8.0 Hz 2H), 6.99 (d, J = 8.0 Hz, 2H), 6.93 (s, 2H), 6.81 (d, J = 8.0 Hz, 2H), ppm; 13C NMR (400 MHz, CD3OD): δ = 158.7, 132.7, 130.8, 125.3, 124.7, 124.1, 119.2, 117.3, 92.3, 89.3 ppm; ESI-TOF MS (MeOH, negative mode): m/z = 310.08 (calculated monoisotopic mass of C22H14O2: 310.10).
Synthesis of 1
To a dry DMF (100 mL) solution of 3 (0.97 g, 1.0 mmol) and 3,3′-[1,4-phenylenebis(ethyne-2,1-diyl)]diphenol (0.31 g, 1.0 mmol) K2CO3 (1.38 g, 10 mmol) was added at 25 °C under Ar. After being stirred overnight at 60 °C, the reaction mixture was evaporated to dryness under reduced pressure. The residue was dissolved in CHCl3 followed by filtration. Then, the filtrate was washed with brine three times, and the organic phase was dried over Na2SO4. Insoluble materials were filtered off, and the filtrate was evaporated to dryness under reduced pressure. The residue was purified by size exclusion chromatography (Japan Analytical Industry LC-9201 Recycling Preparative HPLC system, JAIGEL-1H and 2H columns) with CHCl3 as an eluent at a flow rate of 3.5 mL min−1 and by silicagel column chromatography with CHCl3 and MeOH (100/0 to 50/1) as eluents to yield 1 as a white solid (0.12 g, 13%).1H NMR (500 MHz, CDCl3 containing 0.03% TMS): δ = 7.43 (s, 4H), 7.33 (d, J = 8.5 Hz, 4H), 7.32 (s, 4H), 7.23 (t, J = 8.0 Hz, 2H), 7.12 (d, J = 8.0 Hz, 2H), 7.01 (s, 2H), 6.91 (d, J = 8.0 Hz, 2H), 6.82 (d, J = 8.5 Hz, 4H), 4.10 (m, 4H), 4.04 (m, 4H), 3.84–3.79 (m, 8H), 3.70 (m, 4H), 3.67 (s, 12H) ppm; 13C NMR (500 MHz, CDCl3 containing 0.03% TMS): δ = 159.0, 158.7, 133.1, 131.7, 131.4, 129.6, 124.7, 124.1, 123.1, 123.0, 116.9, 115.8, 115.3, 114.9, 91.3, 91.2, 89.2, 88.1, 70.9, 70.8, 69.72, 69.68, 67.7, 67.6 ppm; MALDI-TOF MS (CHCA, positive reflector mode): m/z = 936.61 (calculated monoisotopic mass of C60H56O10: 936.39). High-resolution ESI-TOF MS spectrum is shown in Fig. S6a (ESI†).
Synthesis of 2
To a dry DMF (100 mL) solution of 3 (0.97 g, 1.0 mmol) and 4,4′-[1,4-phenylenebis(ethyne-2,1-diyl)]diphenol (0.31 g, 1.0 mmol) K2CO3 (1.38 g, 10 mmol) was added at 25 °C under Ar. Then, the reaction mixture was stirred overnight at 60 °C, and the precipitates were collected by filtration, dispersed in THF followed by washing with brine twice. The organic phase was dried over Na2SO4. Insoluble materials were filtered off, and the filtrate was evaporated to dryness under reduced pressure to yield 2 as a yellow solid (0.59 g, 63%).1H NMR (400 MHz, CDCl3 containing 0.03% TMS): δ = 7.38 (d, J = 8.8 Hz, 8H), 7.35 (s, 8H), 6.76 (d, J = 8.8 Hz, 8H), 4.00–3.98 (m, 8H), 3.90–3.87 (m, 8H), 3.76–3.70 (m, 16H) ppm; MALDI-TOF MS (CHCA, positive reflector mode): m/z = 936.65 (calculated monoisotopic mass of C60H56O10: 936.39). High-resolution ESI-TOF MS spectrum is shown in Fig. S6b (ESI†).
Conclusions
The thermal phase-transition properties of TEG-containing macrocycles, 1 and 2, were studied. Despite the small differences in the molecular structures, 1 and 2 exhibit significantly different phase-transition properties from each other. Namely, 1 forms crystals (Cr1) after cooling from the isotropic liquid (T > 181 °C). 1 in Cr1 shows a crystal-to-crystal transition to Cr2 at 99 °C. The Cr2 state of 1 is more stable than the Cr1 state, so that 1 provides two different crystalline states at room temperature. Switching the optical property such as retardation was successfully demonstrated by the polymorphism of 1 controlled by the hysteretic thermal process. On the other hand, 2 forms crystals and melts into a nematic phase at 230 °C upon heating. The TEG-containing molecular structure of 1 with a lower symmetry compared to 2 is likely an important factor for crystallization and functionalization with a thermoresponsive polymorphic transition.Conflicts of interest
There are no conflicts of interest to declare.Acknowledgements
This work was partially supported by the Grant-in-Aid for Scientific Research B (16H04129 to KK), the Grant-in-Aid for Scientific Research on Innovative Areas “π-System Figuration (No. 2601)” (26102001 to TM, TA and TF), the Grant-in-Aid for Young Scientists (17H04885 to TM), Iketani Science and Technology Foundation (to TM), and the Management Expenses Grants for National Universities Corporations from MEXT, Japan. This work was also supported in part by “Dynamic Alliance for Open Innovation Bridging Human, Environment and Materials” from MEXT, Japan.Notes and references
- Handbook of Liquid Crystals, ed. J. W. Goodby, P. J. Collings, T. Kato, C. Tschierske, H. Gleeson, P. Raynes, Wiley-VCH, Weinheim, 2014 Search PubMed.
- M. A. Garcia-Garibay, Angew. Chem., Int. Ed., 2007, 46, 8945 CrossRef PubMed.
- R. O. Al-Kaysi, A. M. Müller and C. J. Bardeen, J. Am. Chem. Soc., 2006, 128, 15938 CrossRef PubMed.
- S. Kobatake, S. Takami, H. Muto, T. Ishikawa and M. Irie, Nature, 2007, 446, 778 CrossRef PubMed.
- M. Irie, Bull. Chem. Soc. Jpn., 2008, 81, 917 CrossRef.
- K. Uchida, S. Sukata, Y. Matsuzawa, M. Akazawa, J. J. D. de Jong, N. Katsonis, Y. Kojima, S. Nakamura, J. Areephong, A. Meetsma and B. L. Feringa, Chem. Commun., 2008, 326 RSC.
- H. Koshima, N. Ojima and H. Uchimoto, J. Am. Chem. Soc., 2009, 131, 6890 CrossRef PubMed.
- M. Morimoto and M. Irie, J. Am. Chem. Soc., 2010, 132, 14172 CrossRef PubMed.
- P. Naumov, J. Kowalik, K. M. Solntsev, A. Baldridge, J.-S. Moon, C. Kranz and L. M. Tolbert, J. Am. Chem. Soc., 2010, 132, 5845 CrossRef PubMed.
- H. Koshima, K. Takechi, H. Uchimoto, M. Shiro and D. Hashizume, Chem. Commun., 2011, 47, 11423 RSC.
- T. Shima, T. Muraoka, N. Hoshino, T. Akutagawa, Y. Kobayashi and K. Kinbara, Angew. Chem., Int. Ed., 2014, 53, 7173 CrossRef CAS PubMed.
- T. Muraoka, T. Shima and K. Kinbara, ACS Omega, 2018, 3, 414 CrossRef CAS.
- Recently, Sagara, Weder and co-workers reported thermal responses of macrocycles consisting of two aromatic units containing anthracene moieties and TEG chains: Y. Sagara, Y. C. Simon, N. Tamaoki and C. Weder, Chem. Commun., 2016, 52, 5694 RSC.
- N. K. Nath, M. K. Panda, S. C. Sahoo and P. Naumov, CrystEngComm, 2014, 16, 1850 RSC.
- T. Muraoka, T. Shima, T. Hamada, M. Morita, M. Takagi and K. Kinbara, Chem. Commun., 2011, 47, 194 RSC.
- T. Muraoka, T. Shima, T. Hamada, M. Morita, M. Takagi, K. V. Tabata, H. Noji and K. Kinbara, J. Am. Chem. Soc., 2012, 134, 19788 CrossRef CAS PubMed.
- T. Shima, T. Muraoka, T. Hamada, M. Morita, M. Takagi, H. Fukuoka, Y. Inoue, T. Sagawa, A. Ishijima, Y. Omata, T. Yamashita and K. Kinbara, Langmuir, 2014, 30, 7289 CrossRef CAS PubMed.
- T. Shima, T. Muraoka, K. V. Tabata, H. Noji and K. Kinbara, Pure Appl. Chem., 2014, 86, 1259 CrossRef CAS.
- T. Muraoka, T. Endo, K. V. Tabata, H. Noji, S. Nagatoishi, K. Tsumoto, R. Li and K. Kinbara, J. Am. Chem. Soc., 2014, 136, 15584 CrossRef CAS PubMed.
- R. Li, T. Muraoka and K. Kinbara, Langmuir, 2016, 32, 4546 CrossRef CAS PubMed.
- T. Muraoka, K. Umetsu, K. V. Tabata, T. Hamada, H. Noji, T. Yamashita and K. Kinbara, J. Am. Chem. Soc., 2017, 139, 18016 CrossRef CAS PubMed.
- K. Chrissopoulou, K. S. Andrikopoulos, S. Fotiadou, S. Bollas, C. Karageorgaki, D. Christofilos, G. A. Voyiatzis and S. H. Anastasiadis, Macromolecules, 2011, 44, 9710 CrossRef CAS.
- M. Levitus, K. Schmieder, H. Ricks, K. D. Shimizu, U. H. F. Bunz and M. A. Garcia-Garibay, J. Am. Chem. Soc., 2001, 123, 4259 CrossRef CAS PubMed.
- M. Born and E. Wolf, Principles of Optics, Cambridge University Press, Cambridge, 1999 Search PubMed.
Footnotes |
| † Electronic supplementary information (ESI) available: Differential scanning calorimetry profiles, polarized optical micrographs, and X-ray diffraction profiles. CCDC 1590061. For ESI and crystallographic data in CIF or other electronic format see DOI: 10.1039/c7qm00621g |
| ‡ Crystal data for 1 at 100 K: C60H56O10, Mw = 937.04, monoclinic, P21/c, a = 9.1235(2) Å, b = 60.8969(13) Å, c = 8.8517(2) Å, β = 93.0300(10)°, V = 4911.07(19) Å3. Z = 4, ρcalcd = 1.267 g cm−3, μ = 6.90 cm−1, F000 = 1984, theta range 4.356 to 68.199°, CuKαλ = 1.54187 Å, T = 100(2) K, no. of unique reflections = 8933 (Rint = 0.0402), GOF = 1.138, R1 = 0.0560 (I > 2σ(I)), wR2 = 0.1577 (I > 2σ(I)). The X-ray crystallographic coordinates for the structure at 100 K reported in this paper, CCDC 1590061.† |
| § The powder XRD pattern of as-grown crystals of 1 is shown in Fig. S7 (ESI†), suggesting that the crystal structure of the single crystal is different from either Cr1 or Cr2. |
| ¶ RCr2 = 420 nm (Δn = 0.074) and RCr2 = 372 nm (Δn = 0.066) were also observed locally. |
| This journal is © the Partner Organisations 2018 |

