Virtual staining of colon cancer tissue by label-free Raman micro-spectroscopy†
D.
Petersen‡
a,
L.
Mavarani§‡
a,
D.
Niedieker
a,
E.
Freier¶
 a,
A.
Tannapfel
b,
C.
Kötting
 a,
K.
Gerwert
*a and
S. F.
El-Mashtoly
a
aDepartment of Biophysics and Protein Research Unit Europe (PURE), Ruhr University Bochum, ND/04 Nord, 44780 Bochum, Germany. E-mail: gerwert@bph.ruhr-uni-bochum.de; Fax: +49 234 3214238; Tel: +49 234 3224461
bKlinikum Bergmannsheil, Ruhr-University Bochum, 44780 Bochum, Germany
First published on 3rd November 2016
Abstract
The great capability of the label-free classification of tissue via vibrational spectroscopy, like Raman or infrared imaging, is shown in numerous publications (review: Diem et al., J. Biophotonics, 2013, 6, 855–886). Herein, we present a new approach, virtual staining, that improves the Raman spectral histopathology (SHP) images of colorectal cancer tissue by combining the integrated Raman intensity image in the C–H stretching region (2800–3050 cm−1) with the pseudo-colour Raman image. This allows the display of fine structures such as the filamentous composition of muscle tissue. The morphology of the virtually stained images is in agreement with the gold standard in medical diagnosis, the haematoxylin–eosin staining. The virtual staining image also represents the whole biochemical fingerprint, and several tissue components including carcinoma were identified automatically with high sensitivity and specificity. For fast tissue classifications, a similar approach was applied on coherent anti-Stokes Raman scattering (CARS) spectral data that is faster and therefore potentially more suitable for clinical applications.
Introduction
Colorectal cancer is among the most common cancer diseases diagnosed in humans.1 More than 1 million individuals worldwide develop colorectal cancer each year.2 Most of the colon cancers start as small benign polyps based on an adenoma sequence. The first level of detection of colorectal carcinoma is usually performed through a visual inspection during colonoscopy. The diagnosis is performed manually by pathologists on a biopsy via histopathological examination using haematoxylin and eosin (H&E) stained thin tissue sections. In order to determine gene defects next generation gene sequencing is performed.3 For information about the presence of certain cancer associated markers or proteins, immunohistochemical staining (IHC) is the method of choice. If colorectal cancer is diagnosed within a patient, cancer regions and their surrounding areas of the colon are resected generously.In the last decade, several studies have shown that spectral histopathology (SHP) is capable of classifying different tissue types and especially diseased tissue such as cancer.4–11 The measured vibrational spectra are integral signals of the proteome, genome, and metabolome. Thus, when vibrational spectra are collected from distinct regions of, for example, tissue sections, variations in the spectral patterns are detected and can be correlated with the tissue types or carcinoma from which the spectra are collected. For instance, colorectal and lung carcinoma are identified in this regard by infrared (IR) imaging.12–16
Several groups showed the application of Raman and coherent anti-Stokes Raman scattering (CARS) imaging on colon tissue.17–22 In all cases normal and carcinoma tissue were successfully distinguished, but most of these studies lack elaborated automated bioinformatics. We have recently established a workflow that includes Raman microscopy, bioinformatics, histopathology, and IHC (Fig. S1 in the ESI†) to automatically classify different tissue types and cancer regions.23 The workflow is divided into training and validation stages. In the training stage, Raman spectral imaging of thin sections of colon tissue was performed. Hierarchical cluster analysis (HCA) of the Raman spectroscopic data was performed as an unsupervised segmentation. From this segmentation similar spectra were grouped into clusters producing a pseudo-colour image. The H&E and/or IHC staining were performed on adjacent thin tissue sections. Images of these staining were annotated by the pathologist and then used to identify the corresponding Raman spectral “fingerprints” of different tissue types including cancer based on the comparison with pseudo-colour images. These spectral “fingerprints” were used as a database to perform a supervised classification through a classifier such as random forest (RF).24 RF classifiers are accurate and robust against over-fitting. In the validation stage, Raman spectral maps of new thin tissue sections were measured and automatically annotated by the trained RF. By using this workflow, our preliminary results of Raman based RF with 532 nm excitation displayed carcinoma regions and cells such as lymphocytes and erythrocytes in addition to an autofluorescence specific to p53 active areas in the crypt region of the lamina propria mucosae.23
This means that Raman SHP can resolve small structures like erythrocytes and lymphocytes and visualize detailed chemical and morphological compositions due to the higher spatial resolution of Raman imaging in comparison with IR imaging. This advantage allows us to detect borders and transitions between diseased and healthy tissue in an accurate way, which is of importance in clinical diagnosis.25 Thereby, not only the carcinoma can be resected precisely, but also healthy tissue around the carcinoma is spared, which can be crucial in some organs, for example, brain.26
Herein, we present a new method for the graphical representation, virtual staining, that adds the morphological information given by the Raman intensity to the RF pseudo-colour images. These label-free images with high spatial resolution enable a direct comparison with H&E stained images, and thus can help the pathologists in their diagnosis, especially for questionable areas. Several tissue classes and carcinoma regions of colorectal carcinoma were identified and represented by highly resolved RF images. Furthermore, we extend our method to a fast tissue classification using CARS imaging of colorectal cancer tissues coupled with second harmonic generation (SHG), which is a perfect combination suitable for clinical applications.
Experimental section
Sample preparation
Collected spontaneous Raman datasets were gathered from formalin-fixed, paraffin-embedded and native tissue sections. They were obtained from the Institute of Pathology of the Bergmann's Heil Hospital in Bochum, Ruhr-University Bochum. The research was approved by an institutional review board (IRB) of the Faculty of Medicine, Ruhr-University Bochum, and complied with all applicable laws and institutional guidelines, and the institutional committee has approved the experiments. Informed consent was also obtained from the patients for use of their tissue samples.The tissue sections were mounted on reflective silver coated microscope slides (low-emissivity slides [Kevley Technologies, Chesterland, OH]) and deparaffinised before measurements. By using formalin-fixed, deparaffinised samples, which were stable over a long period of time, we were able to use the tissue slides for long term measurements and perform several Raman measurements on the same tissue slides. Subsequent H&E staining was performed on the measured tissue sections or adjacent thin tissue sections. For CARS measurements, tissue resections were first frozen in liquid nitrogen and cut with a cryotome. Afterwards, the tissue sections were mounted on glass slides (Menzel Glas, Braunschweig, Germany). These slides were first dried in dry air before and during CARS measurements, which were acquired for a very short term. The subsequent H&E staining was conducted on the same tissue slide.
Data acquisition
Raman hyperspectral datasets were acquired using a confocal Raman microscope (Alpha300AR, WITec Inc., Ulm, Germany) coupled to a frequency doubled solid state laser operating at 532 nm (WITec, Nd:YAG, max. 42 mW). A 25 μm diameter single-mode optical fiber was used to couple the laser radiation into the microscope. For all measurements 7 s exposure time per pixel was used, utilizing a 100×/NA 0.90 objective (Olympus, Japan). The Raman scattered light was collected with the same objective and directed through a multi-mode optical fiber (50 μm diameter) to a spectrometer equipped with a back-illuminated electron-multiplying charge coupled device (EMCCD) camera (1600 × 200 pixels). Raman datasets were obtained with a pixel size of 0.8–1.0 μm for regions between 80–150 μm × 80–150 μm. The laser intensity was fixed to 1.5 mW at the sample position.CARS imaging of tissue samples was performed on a commercial setup (TCS SP5 II CARS, Leica Microsystems, Heidelberg, Germany) as described previously.27 Briefly, two picosecond-pulsed laser beams were collinearly aligned and focused on the sample through a HCX IRAPO L (25×/0.95 W, Leica Microsystems) objective. Multispectral CARS and SHG datasets were acquired in a region between 2700 cm−1 and 3000 cm−1. The datasets consisted of 61 spectral images and the acquisition time for the whole dataset was ∼2 ms per pixel, which was much faster than spontaneous Raman imaging by more than 100 times. Areas of roughly 300 μm × 300 μm (1024 × 1024 pixels) were scanned in epi (backward) and forward directions.
Data analysis
The Raman raw data was processed in Matlab with the Image Processing and Statistics toolboxes (The Mathworks, Inc., Mass., USA) and algorithms developed in-house. Cosmic spikes were removed by using an impulse noise filter28 and the spectra were interpolated to a reference wavenumber scale. Hierarchical cluster analysis29 (HCA) was performed on vector normalized data in the region between 700–1800 cm−1 and 2600–3100 cm−1. Pseudo-colour images generated from the clustering of the spectra were compared to the annotation of a pathologist and IHC staining. The stage of colorectal cancer was not considered in the training step. The Raman spectra for training of a supervised learning algorithm, RF,24 were extracted from these datasets. The spectra with high autofluorescence (1.1% of the total measured spectra in the present study) were removed by setting a threshold on the signal intensity of the raw data. Since Raman spectra of the tissue section have different backgrounds (see Fig. S2 in the ESI†), a fifth order polynomial was fitted to each spectrum to remove the residual spectral baseline for the classification with a RF. Supporting points were selected by applying a sweep algorithm on the wavelet-denoised spectrum (Daubechies wavelet D4).30 After this step, spectra were normalized between 700–3100 cm−1 and offset corrected. The hyperspectral data was filtered in the image space with a Gaussian window (3 × 3, σ = 1). For the following classes/tissue components spectra were gathered for training from five different patients: carcinoma (471), connective tissue (793), muscle (1538), erythrocytes (140), crypts (963), lymphocytes (593), lymph follicle (202), and background (1320). The RF classification was set up as a multistep procedure as shown in Fig. 1. In the first step the background was separated from the residual classes. Therefore spectra were additionally Savitzky Golay filtered (3rd order, window size ∼50 cm−1). In the second step spectra were classified into the abovementioned classes. In the third step the spectra were normalized in the region between 700–1800 cm−1 and 2600–3100 cm−1 separately. The additional classification was run first on carcinoma and crypt classified classes only classifying the two classes. Afterwards the classification was performed on connective tissue and muscle classified components in the same way. Sensitivity and specificity of the classification were calculated by cross validation of the training data.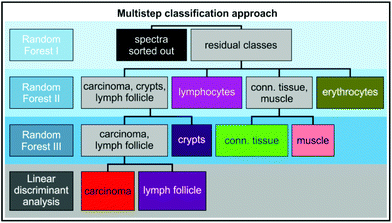 | ||
| Fig. 1 Multistep classification approach used for classification of different tissue components of colorectal carcinoma. | ||
The lymph follicle and carcinoma spectra are hardly discriminable for the RF, especially for a low signal to noise ratio (SNR). For this reason the carcinoma and lymph follicle classes were selected from the resulting RF. The corresponding spectra were parameterized by spectral curve deconvolution.31 Features at 1240, 1337, 1390 and 1580 cm−1 were used to distinguish between both components by linear discriminant analysis (LDA). Single cell nuclei have the same spectral fingerprint as carcinoma, though they are strongly limited in their extension. Regions up to 10 × 10 μm are recognized as cell nuclei.
The concentration of one component is directly proportional to its Raman intensity. Utilizing this information, we created images which reflect the integrated intensity information of the CH-stretching vibration and the pseudo-colour image of the RF. In this study these images will be referred as virtual staining.
Multispectral CARS and SHG datasets were acquired in the 2700–3000 cm−1 region. The datasets consisted of 61 spectral images. CARS spectral datasets were normalized between 2700 cm−1 and 3000 cm−1 and k-means clustering29 was applied.
Likewise to the virtual staining of the RF the calculated pseudo-colour images of k-means were weighted by a combination of the CARS and SHG intensities at 2850 cm−1 and 408 nm, respectively.
Immunohistochemical staining
All steps were done on a Bond maX/Bond II system (Leica Microsystems, Wetzlar, Germany). First the slides had to be deparaffinised and then the IHC staining was performed on the next adjacent slice. Afterwards, the slides were pretreated by heat for antigen-retrieval. The staining was performed by incubation of the tissue slides with primary antibodies of p53 and MiB-1 (Ki-67) for 20 minutes. The Ki-67 antigen is a large nuclear protein (345, 395 kDa) expressed during all active phases of the cell. For the Ki-67 staining a monoclonal mouse anti-human antigen (Clone MIB-1) was used (Dako, Hamburg, Germany). Monoclonal mouse anti-human p53 protein (Clone DO-7) was used for detection of wild-type and mutant-type p53 proteins for the identification of p53 accumulation in human neoplasia. After staining the tissue sections were washed according to the application details with different solutions of the Bond Refine Red Kit. In a last step the tissue slides were additionally stained with haematoxylin, in order to visualize the cell nucleus and endoplasmic reticulum (see also H&E staining) and fixed in ascending ethanol series and xylene. Images were obtained by using an Olympus microscope.H&E staining
After data acquisition the tissue slides were stained with H&E.32 Staining of the cell nucleus and endoplasmic reticulum was achieved by incubation of the tissue with haematoxylin for 15 minutes and 1 minute for deparaffinised and native tissues, respectively. After washing and stopping the haematoxylin reaction with H2O the cytosol was stained with eosin for 3 minutes or 50 seconds for deparaffinised and native tissues, respectively. The tissue slides were washed with H2O and dehydrated in an ethanol gradient. The H&E stained tissue slides were evaluated by a pathologist (Department of Pathology of the Bergmannsheil Hospital in Bochum) and compared to the HCA results of Raman data in order to select spectra for the training of the RF classifier.Results and discussion
Raman based SHP
Raman based SHP of human colorectal tissue sections was used to obtain a high quality automated annotation of different tissue types and carcinoma regions. Before an automated annotation can be performed it is important to build up a diverse set of spectra for the training of a classifier (see Fig. S1 in the ESI†). Each spectrum has to be representative for a certain tissue component, which can be distinguished by vibrational spectroscopy. In an earlier study, we showed the capability of Raman imaging with 532 nm excitation for label free detection of carcinoma regions, lymphocytes, erythrocytes and p53 active areas in the carcinoma area.23Herein, by using the molecular information contained within the spectra, even more tissue components or cell types were automatically identified such as carcinoma tissue, connective tissue, muscle tissue, erythrocytes, lymphocytes, lymph follicle and crypts. The classification of tissue components was enhanced in the present study by developing a new multi-step classification scheme. The scheme is divided into two parts. In the first part a multi-step RF classifier (Fig. 1) was applied and it classifies the classes, connective tissue, muscle, erythrocytes, lymphocytes, crypts, carcinoma and lymph-follicle. In the second part, parameters from a curve deconvolution were calculated for spectra which were identified as carcinoma or lymph-follicle. With these parameters, both classes were successfully reclassified by LDA. Classified carcinoma regions, which were less than 10 μm × 10 μm in size, were recognized to be cell nuclei. The datasets employed for the training step were excluded from validation. The datasets shown in this study for validation were acquired from an additional thin tissue section from patient with low grade and stage I colorectal cancer.
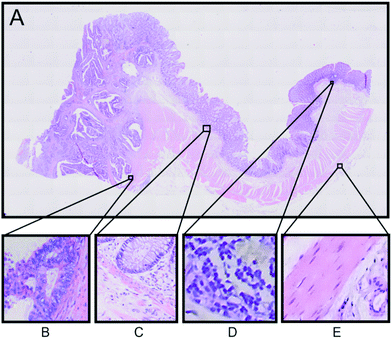
An example of the Raman based SHP results from one patient will be presented here in detail. Fig. 2A displays the H&E stained tissue of a colorectal adenocarcinoma. Haematoxylin stains the cell nuclei in blue/purple, while eosin stains the cytosol in different red coloured shades.32 The annotations of tissue components were performed by an expert pathologist.
These annotations were used to determine the regions of interest for Raman micro-spectroscopic measurements in the next step. The left side region of this tissue section shows the carcinoma area, whereas the right side region is a non-cancerous (normal) region. In order to confirm the presence of carcinoma we performed IHC staining of the tissue with p53 and Ki-67 antibodies, which shows accumulation of p53 and Ki-67 proteins, respectively, in the left side region of the tissue (see Fig. S3 in the ESI†).32,33 According to the H&E staining and the IHC, staining regions of interest are selected as displayed in Fig. 2. The selected regions show different tissue types characteristically for colon tissue. Panel B shows a carcinoma region, adjacent muscle and connective tissue. Panel C displays the border between the mucosa containing the colon crypts and the submucosa separated by a thin muscle layer called lamina muscularis mucosae, which plays an important role in the diagnosis of colon cancer. In panel D a part of a lymph follicle is presented, whereas panel E shows the transition between the tunica muscularis and the tela serosa.
For the diagnosis, it is important to differentiate between cancer, crypts and the membrane muscle layer. Fig. 3A and B show the transition from the mucosa containing the crypts to the submucosa. The two tissue types are separated by the lamina muscularis mucosae. We were not only able to automatically identify the nuclei part of the crypt (dark purple) but also the lamina muscularis mucosae (salmon). Furthermore, connective tissue (green) and even cellular shaped features like lymphocytes (pink), erythrocytes (olive) and undefined cell nuclei (blue) were automatically identified. Although a few pixels were misclassified, Raman SHP in Panel B reproduces all information from the H&E staining image (Panel A). In Fig. 3C, the p53 IHC staining for the selected carcinoma region in Fig. 2B is shown. Cancer regions (red) were identified by Raman based SHP (Fig. 3D) and these results are in an agreement with the IHC stained carcinoma area (Fig. 3C). The p53 active cancer regions (Fig. 3C) were obtained in the Raman SHP image (Fig. 3D) as the red region. Inside the cancer region remaining goblet cells (dark purple) and infiltrating immunocompetent cells were observed (pink). The cancer region can be clearly separated towards the neighbouring muscle region (salmon). Small morphological differences were observed between IHC and SHP images because adjacent tissue slices were used.
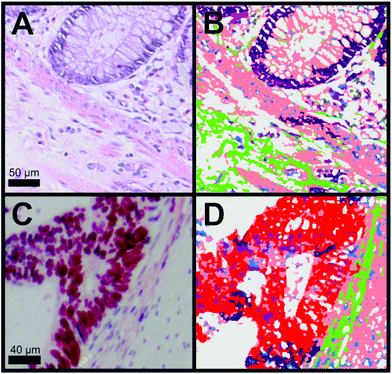 | ||
| Fig. 3 Comparison of H&E and IHC staining with Raman SHP of selected regions from colorectal carcinoma tissue presented in Fig. 2. (A) H&E staining of a region showing the transition from the tunica mucosa to the tela submucosa as shown also in Fig. 2C. (B) Raman SHP of the same region shown in (A). Salmon: muscle, dark purple: crypts, green: connective tissue, blue: cell nuclei, olive: erythrocytes, pink: lymphocytes. (C) IHC staining by the p53 antibody of a region showing the transition between carcinoma tissue and healthy tissue as also indicated in the H&E image (Fig. 2B). Accumulation of p53 is shown in red. (D) Raman SHP of the same region shown in (C). Red: carcinoma, green: connective tissue, salmon: muscle, dark purple: crypts, blue: cell nuclei. | ||
The mean training spectra of these components are shown in Fig. S4 (see the ESI†). The low standard-deviation of each class of the spectra, shown in grey, confirms the consistency of each class. In our continued approach towards Raman based automated SHP of colon carcinoma, we detected clear differences between carcinoma and connective tissue. Since the clinical use of the method is in focus, this clear differentiation was one of the main goals of our approach, and thus of great importance. The spectral differences between carcinoma and connective tissue are shown in detail in Fig. 4a. These spectra were improved regarding their standard deviation compared to our previous study.23 This is because new spectra were added for the training and spectra with a lower SNR were removed.
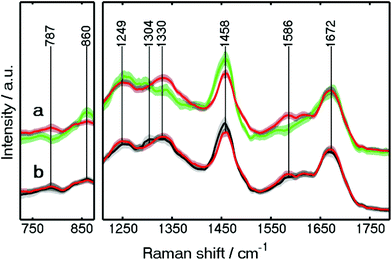 | ||
| Fig. 4 Wavelet-denoised Raman mean spectra of carcinoma (red), connective tissue (green), and crypt (black) used in Raman RF. The spectra are shown in the 725–875 and 1210–1790 cm−1 regions. | ||
Large spectral differences between carcinoma and connective tissue are found. For example, the spectral differences can be found at 1330 and 787 cm−1, indicating higher protein and DNA contents, respectively, in the carcinoma spectra. These results are similar to those reported previously.4 A peak also appears at 1586 cm−1, representing guanine and adenine (ring breathing modes of DNA bases).4 The higher amount of DNA caused by enhanced proliferation is confirmed by the IHC staining for Ki-67 (see Fig. S3†).
The increased content of protein and DNA in carcinoma was also found by a Raman imaging study on gastric cancer34 and in a fiber-optic approach for colon cancer.31 On the other hand, higher lipid contents were detected in the connective tissue spectra through the Raman bands at 860 and 1458 cm−1. Higher lipid contents were also observed in the crypt when comparing with carcinoma through a Raman band at 1458 cm−1 as shown in Fig. 4b. In addition, crypts and lamina muscularis mucosae can be separated more clearly (Fig. 3B) in the present study. The differentiation between the crypts in mucosa and lamina muscularis mucosae is crucial for cancer diagnosis. This is because adenomas are formed in the mucosa, while the penetration of the lamina muscularis mucosae layer by carcinoma is defined as invasive cancer (see details in CARS results).
As different cell types, erythrocytes and lymphocytes were identified. The class of the erythrocytes shows the most characteristic spectra, since their hemoglobin is in the resonance condition with a 532 nm excitation laser. Due to normalization the enhancement caused by the resonance is not seen in the spectrum (Fig. S4 in the ESI†). Nevertheless, the spectra show enhanced characteristic bands for heme.18,35,36
Differences in the spectra of lymph follicles and single lymphocyte cells in the tissue were also detected (see Fig. S5 in the ESI†). The lymphocyte spectra have a characteristic pattern due to the large lipid content, with a strong band around 1443 cm−1 assigned to the CH2 bending mode.37 Brown et al. showed that it was possible to differentiate lymphocytes in different stages.38 Furthermore, they reported small but significant differences in the Raman spectra of activated and non-activated T-lymphocytes. This could also be the reason for the spectral differences observed here between cells in the lymph follicle and the other lymphocytes within the tissue (see Fig. S5 in the ESI†). The characteristic lipid bands are less intense in the spectra of the lymph follicle, where a higher content of protein bands is found. Thus, these results demonstrate the capability of Raman based SHP as a label-free method for recognition of several tissue components simultaneously and in an automated way.
Virtual staining by Raman micro-spectroscopy
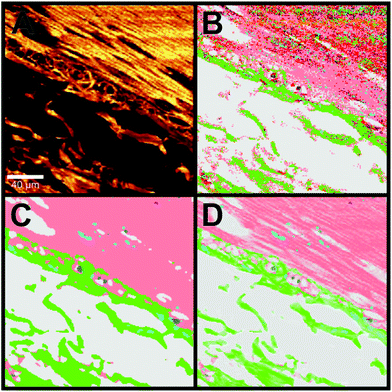
Information of the local concentration of the single molecules and therewith components is lost due to the use of data correction and pre-processing. In order to obtain a high quality Raman SHP image with this additional information, we describe a new method to regain this structural Raman based SHP image by using the information provided by the integral Raman intensity from 2800–3050 cm−1 as shown in Fig. 5. The integrated Raman intensity image in the 2800–3050 cm−1 region is displayed in Fig. 5A, whereas Fig. 5B shows the Raman based SHP of the same region with the analysis scheme (single step RF) of the previous publication.23The area shows the outer muscle layer of the colorectum (muscularis propria) at the top right corner, and the adjacent connective tissue (subserosa) at the bottom left. Especially in the muscle area the Raman based SHP (Fig. 5B) shows a problem with a lower SNR and the single step RF: a lot of misclassified pixels are recognized in the pseudo-colour image, which give the impression of a noisy image. By using a Gaussian filter (3 × 3 Gaussian matrix, σ = 1) and a multistep RF (see Data analysis section) the Raman based SHP was further improved as shown in Fig. 5C.
The image displays a large improvement in the Raman based SHP as shown in Fig. 5B. The muscle (salmon) and the connective tissue (green) can be separated precisely. Nevertheless, the representation of the tissue appears very flat and homogeneous within one component.
The concentration of molecules within a voxel is directly proportional to the integrated Raman intensities. Therefore, information of the detailed structures of a certain tissue can e.g. be obtained from the integrated signal of the CH stretching vibrations in the 2800–3050 cm−1 region.
A combination of the pseudo-colour map of the classification and the Raman intensities allows displaying of fine structures such as the filamentous structure within the muscle tissue and its orientation (Fig. 5D). This increases the information content of the presented data and gives an impression of colouring the tissue structure with our classification, which is comparable to stained tissue with dyes. Thus, instead of using a dye as in H&E staining, this method provides a label-free way to virtually stain a tissue and is therefore, a non-invasive approach. An advantage of label-free Raman imaging in comparison with H&E is that the same tissue section can also be used in a non-invasive manner for further analysis, like next generation sequencing, proteomic analysis, or immunohistochemistry. In principle, immunohistochemistry can be performed after H&E de-staining but it is an invasive method and the probability of losing the tissue sections during this process is relatively high.39 The virtual staining approach was applied to the previously selected regions shown in Fig. 2B–E. Fig. 6 shows the H&E staining of the four selected regions (A, D, G, J) in direct comparison with the Raman SHP (B, E, H, K) and the virtually stained Raman images (C, F, I, L).
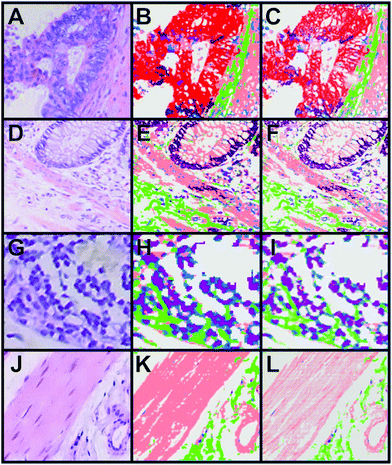 | ||
| Fig. 6 Comparison of H&E staining, Raman SHP and Raman virtual staining. (A, D, G, J) H&E staining of selected regions of interest shown in Fig. 2. (B, E, H, K) Raman SHP of the same regions shown in (A, D, G, J). Red: carcinoma, green: connective tissue, salmon: muscle, dark purple: crypts, pink: lymphocytes, olive: erythrocytes, purple: lymph follicle. (C, F, I, L) Raman virtual staining, constructed from Raman SHP shown in (B, E, H, K) and their corresponding integrated Raman intensities in the 2800–3050 cm−1 region. | ||
The picture clearly shows the enhanced visualization of the muscle fibres (salmon) and connective tissue (green). The resolution of Raman imaging intensities over the CH stretching vibrations is roughly equal to the conventional imaging of the H&E, and sometimes even seems to deliver a more detailed and sharper representation of the sample. The same images can be created with a black background if necessary (see Fig. S6–S8 in the ESI†).
The sensitivity and the specificity for carcinoma recognition are at 96% and 98%, respectively, as shown in Table 1. This shows how precisely the carcinoma can be allocated. Other approaches using Raman spectroscopy on carcinoma or basal cell carcinoma show similar results for the sensitivity and specificity.40,41
| Sensitivity % | Specificity % | |
|---|---|---|
| Carcinoma | 96 | 98 |
| Crypts | 96 | 99 |
| Lymph follicle | 86 | 99 |
| Connective tissue | 93 | 99 |
| Muscle | 98 | 99 |
| Lymphocytes | 99 | 99 |
| Erythrocytes | 100 | 100 |
The virtual stained images give comparable results to the stained and labelled tissue sections. This proves Raman based SHP as a label-free supplement to the standard methods of diagnosis, such as H&E and IHC staining. It does not only identify biomarkers in human tissue, as shown here for colorectal cancer, but it can also be used as a diagnostic assistant technique.
Fast imaging by CARS micro-spectroscopy
One disadvantage of conventional Raman micro-spectroscopy is that Raman measurements are slow. This is a problem for clinical applications that require generally fast measurements. For instance, the surgeon has a short time during the surgery until the pathologist determines the cancerous part of tissues that is necessary to be removed. To overcome the speed problem of the Raman measurements and make it fit with clinical applications, non-linear techniques, such as CARS or stimulated Raman scattering (SRS) that can be performed at a speed up to a video rate, have to be used.42,43 Ji et al.26 showed that SRS was able to detect brain carcinomas using a linear combination of SRS images at 2845 and 2930 cm−1 in a rapid and label-free way, but didn't include any bioinformatics approach to aid the pathologist. In addition, Bocklitz et al.44 have used a combination of CARS, two photon excited autofluorescence (TPEF), and SHG to produce pseudo-HE images of tissue by multivariate statistics. This method is proposed to be a fast and precise pathological screening tool.CARS imaging at a single wavenumber is very common in bio-spectroscopy. For instance, CARS imaging near 2850 cm−1 has been used to monitor the lipid distribution in tissues or lipid droplets in cancer cells.27,45–47 In addition to imaging at a single wavenumber, Potma et al.45 used CARS spectra in the C–H stretching region coupled to principal component analysis for imaging meibomian glands. We have also used a similar approach including CARS spectra in the C–H stretching region and cluster analysis to identify subcellular organelles of cancer cells.27 Generally, clustering of CARS spectra produces a pseudo-colour image, which represents the various spectral distributions over the examined tissue section. Different tissue components shown in the pseudo-colour images can be identified by comparison with the corresponding H&E stained image of the same tissue section or the next adjacent tissue slice as shown in the workflow of SHP (Fig. S1†). This would provide more information than those which can be obtained from CARS imaging at a single wavenumber. Here, we have used CARS spectra in the C–H stretching region in combination with SHG and cluster analysis to set the stage for automatic identification of different tissue components.
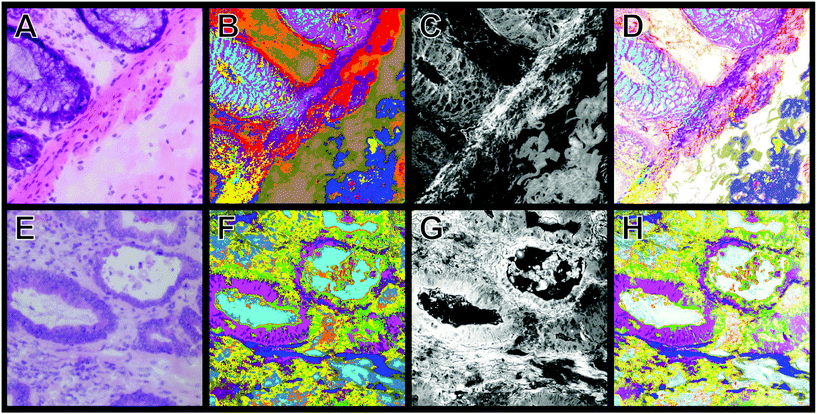
The H&E staining images shown in Fig. 7 display regions with benign (A) and carcinoma (E) morphological features. For instance, panel A shows the transition from the mucosa containing intact crypts to the submucosa and they are separated by the lamina muscularis mucosae. In panel E, cancer with low anaplasia can be seen. The original structure of the crypt regions still can be observed. Fig. 7B and F display the k-means clustering result of CARS spectra in the 2700–3000 cm−1 region of the tissue sections shown in panels A and E, respectively. These panels accurately reproduce the structures that are apparent in the H&E stained images: the intact crypts (cyan and pink), submucosa (dark blue), and lamina muscularis mucosae (purple) are clearly shown in panel B, while carcinoma (pink) is displayed in panel F. Examples of the CARS mean spectra that are obtained from k-means clustering are shown in Fig. S9 (see the ESI†).
Fig. 7C shows a combination of the SHG (408 nm) and CARS intensities at 2850 cm−1. SHG of tissues at 408 nm visualizes mainly the fibrous collagen network, whereas the CARS intensity at 2850 m−1 depicts the lipid rich regions in the tissue. To obtain more information about the structural details, the pseudo-colour images of k-means (B and F) are combined with the intensity images of both SHG and CARS (C and G) and the results are displayed in panels D and H.
Although the concentration of one component is non-linearly proportional to its CARS or SHG intensity, such a combination improves the quality of the images as shown in detail in Fig. S10 and S11 (ESI†). These results are comparable to the H&E staining (Fig. 7A and E, see also Fig. S10 and S11†). The images (Fig. 7D and H) display an improvement compared with the pseudo-colour image of k-means clustering (Fig. 7B and F). For instance, the crypt (cyan and pink), the connective tissue (blue and olive), and lamina muscularis (for example purple) can be separated precisely from one another (Fig. 7D). The invasive carcinoma is clearly visible in panel H. Furthermore, the detailed structures of these components are more visible in Fig. 7D and H. Similarly to the Raman virtual imaging shown above (Fig. 6), images of high structural details can be generated with a faster imaging technique such as CARS.
Conclusions
We have presented that Raman based SHP can differentiate between several tissue components, including cancer, connective tissue, muscle, crypts, lymphocytes, lymph follicle, and erythrocytes. The information content of the pseudo-colour images can be further improved by overlaying the Raman intensities of the C–H stretching vibrations with the Raman based RF images. By this new method, virtual staining, structural details of the tissue such as fibres can be revealed and thus improves the representation of the highly resolved images. Virtual staining by Raman based SHP provides a realistic display of the tissue structure similarly to conventional staining techniques like fluorescence imaging and allows better direct comparison to the H&E staining method. The high sensitivity and the specificity for cancer recognition confirm how precisely the cancer can be automatically detected. This method could therefore help the pathologist to diagnose cancer allocated regions and early stages of the disease with high precision in order to improve the patients’ life quality.Recent studies focus on fast measurements of tissue using non-linear techniques such as SRS, but lack the bioinformatics.26 Pseudo-HE images of tissues were also created using CARS/TPEF/SHG to be used as a pathological screening tool.44 On the other hand, pseudo-colour images of k-means of CARS spectra in the CH stretching region and SHG at 408 nm were used to produce highly resolved pseudo-colour images that can be used to differentiate between different tissue types. A combination of the presented data evaluation and CARS measurements paves the way for fast clinical label-free diagnostics. Our next step is to perform CARS measurements of native colorectal cancer tissues from several patients to obtain a large dataset that enables us to perform automatic recognition of various tissue components including carcinoma.
Acknowledgements
We thank Angela Kallenbach-Thieltges, Frederick Großerüschkamp, Claus Küpper and Melanie Horn for helpful discussions. Furthermore, we thank Lidia Janota for her expertise in tissue staining. This research was supported by the Protein Research Unit Ruhr within Europe (PURE), Ministry of Innovation, Science and Research (MIWF) of North-Rhine Westphalia, Germany.Notes and references
- World Health Organization, 2014.
- D. Cunningham, W. Atkin, H.-J. Lenz, H. T. Lynch, B. Minsky, B. Nordlinger and N. Starling, Lancet, 2010, 375, 1030–1047 CrossRef.
- B. T. Wilhelm, S. Marguerat, S. Watt, F. Schubert, V. Wood, I. Goodhead, C. J. Penkett, J. Rogers and J. Bähler, Nature, 2008, 453, 1239–1243 CrossRef CAS PubMed.
- M. Diem, J. M. Chalmers and P. R. Griffiths, Vibrational spectroscopy for medical diagnosis, John Wiley & Sons, Chichester, England, Hoboken, NJ, 2008 Search PubMed.
- R. Salzer and H. W. Siesler, Infrared and Raman spectroscopic imaging, Wiley-VCH, Weinheim, 2009 Search PubMed.
- M. Diem, M. Miljkovic, B. Bird, T. Chernenko, J. Schubert, E. Marcsisin, A. Mazur, E. Kingston, E. Zuser, K. Papamarkakis and N. Laver, Spectrosc. – Int. J., 2012, 27, 463–496 CrossRef CAS.
- M. Diem, A. Mazur, K. Lenau, J. Schubert, B. Bird, M. Miljković, C. Krafft and J. Popp, J. Biophotonics, 2013, 6, 855–886 CrossRef CAS PubMed.
- K. Kong, C. J. Rowlands, S. Varma, W. Perkins, I. H. Leach, A. A. Koloydenko, H. C. Williams and I. Notingher, Proc. Natl. Acad. Sci. U. S. A., 2013, 110, 15189–15194 CrossRef CAS PubMed.
- H. J. Byrne, M. Baranska, G. J. Puppels, N. Stone, B. Wood, K. M. Gough, P. Lasch, P. Heraud, J. Sulé-Suso and G. D. Sockalingum, Analyst, 2015, 140, 2066–2073 RSC.
- N. Rashid, H. Nawaz, K. W. C. Poon, F. Bonnier, S. Bakhiet, C. Martin, J. J. O'Leary, H. J. Byrne and F. M. Lyng, Exp. Mol. Pathol., 2014, 97, 554–564 CrossRef CAS PubMed.
- K. Kong, C. Kendall, N. Stone and I. Notingher, Adv. Drug Delivery Rev., 2015, 89, 121–134 CrossRef CAS PubMed.
- A. Kallenbach-Thieltges, F. Großerüschkamp, A. Mosig, M. Diem, A. Tannapfel and K. Gerwert, J. Biophotonics, 2013, 6, 88–100 CrossRef PubMed.
- C. Kuepper, F. Großerueschkamp, A. Kallenbach-Thieltges, A. Mosig, A. Tannapfel and K. Gerwert, Faraday Discuss., 2016, 187, 105–118 RSC.
- F. Großerueschkamp, A. Kallenbach-Thieltges, T. Behrens, T. Brüning, M. Altmayer, G. Stamatis, D. Theegarten and K. Gerwert, Analyst, 2015, 140, 2114–2120 RSC.
- P. Lasch, M. Diem, W. Hänsch and D. Naumann, J. Chemom., 2006, 20, 209–220 CrossRef CAS PubMed.
- B. Bird, M. Miljković, S. Remiszewski, A. Akalin, M. Kon and M. Diem, Lab. Invest., 2012, 92, 1358–1373 CrossRef PubMed.
- C. Krafft, D. Codrich, G. Pelizzo and V. Sergo, J. Biophotonics, 2008, 1, 154–169 CrossRef CAS PubMed.
- C. Krafft, B. Dietzek, M. Schmitt and J. Popp, J. Biomed. Opt., 2012, 17, 40801 CrossRef PubMed.
- A. Beljebbar, O. Bouché, M. D. Diébold, P. J. Guillou, J. P. Palot, D. Eudes and M. Manfait, Crit. Rev. Oncol. Hematol., 2009, 72, 255–264 CrossRef CAS PubMed.
- R. Gaifulina, A. T. Maher, C. Kendall, J. Nelson, M. Rodriguez-Justo, K. Lau and G. M. Thomas, Int. J. Exp. Pathol., 2016, 97, 337–350 CrossRef CAS PubMed.
- T. W. Bocklitz, S. Guo, O. Ryabchykov, N. Vogler and J. Popp, Anal. Chem., 2016, 88, 133–151 CrossRef PubMed.
- N. Vogler, T. Bocklitz, F. Subhi Salah, C. Schmidt, R. Bräuer, T. Cui, M. Mireskandari, F. R. Greten, M. Schmitt, A. Stallmach, I. Petersen and J. Popp, J. Biophotonics, 2016, 9, 533–541 CrossRef PubMed.
- L. Mavarani, D. Petersen, S. F. El-Mashtoly, A. Mosig, A. Tannapfel, C. Kötting and K. Gerwert, Analyst, 2013, 138, 4035–4039 RSC.
- L. Breiman, Mach. Learn., 2001, 45, 5–32 CrossRef.
- K. Kong, C. Kendall, N. Stone and I. Notingher, Adv. Drug Delivery Rev., 2015, 89, 121–134 CrossRef CAS PubMed.
- M. Ji, D. A. Orringer, C. W. Freudiger, S. Ramkissoon, X. Liu, D. Lau, A. J. Golby, I. Norton, M. Hayashi, N. Y. R. Agar, G. S. Young, C. Spino, S. Santagata, S. Camelo-Piragua, K. L. Ligon, O. Sagher and X. S. Xie, Sci. Transl. Med., 2013, 5, 201ra119 Search PubMed.
- S. F. El-Mashtoly, D. Niedieker, D. Petersen, S. D. Krauss, E. Freier, A. Maghnouj, A. Mosig, S. Hahn, C. Kötting and K. Gerwert, Biophys. J., 2014, 106, 1910–1920 CrossRef CAS PubMed.
- G. Judith and N. Kumarasabapathy, SIPIJ, 2011, 2, 82–92 CrossRef.
- M. Miljković, T. Chernenko, M. J. Romeo, B. Bird, C. Matthäus and M. Diem, Analyst, 2010, 135, 2002–2013 RSC.
- D. L. Donoho, IEEE Trans. Inf. Theory, 1995, 41, 613–627 CrossRef.
- M. V. P. Chowdary, K. K. Kumar, K. Thakur, A. Anand, J. Kurien, C. M. Krishna and S. Mathew, Photomed. Laser Surg., 2007, 25, 269–274 CrossRef CAS PubMed.
- G. Avwioro, J. Phys. Chem. Solids, 2011, 1, 24–34 Search PubMed.
- M. Ramael, G. Lemmens, C. Eerdekens, C. Buysse, I. Deblier, W. Jacobs and E. Van Marck, J. Pathol., 1992, 168, 371–375 CrossRef CAS PubMed.
- M. S. Bergholt, W. Zheng, K. Y. Ho, M. Teh, K. G. Yeoh, J. B. Y. So, A. Shabbir and Z. Huang, J. Biophotonics, 2013, 6, 49–59 CrossRef CAS PubMed.
- G. Rusciano, Phys. Med., 2010, 26, 233–239 CrossRef CAS PubMed.
- M. Asghari-Khiavi, A. Mechler, K. R. Bambery, D. McNaughton and B. R. Wood, J. Raman Spectrosc., 2009, 40, 1668–1674 CrossRef CAS.
- A. I. Mazur, J. L. Monahan, M. Miljković, N. Laver, M. Diem and B. Bird, J. Biophotonics, 2013, 6, 101–109 CrossRef CAS PubMed.
- K. L. Brown, O. Y. Palyvoda, J. S. Thakur, S. L. Nehlsen-Cannarella, O. R. Fagoaga, S. A. Gruber and G. W. Auner, J. Immunol. Methods, 2009, 340, 48–54 CrossRef CAS PubMed.
- M. Dardik and J. I. Epstein, Hum. Pathol., 2000, 31, 1155–1161 CrossRef CAS PubMed.
- N. Bergner, T. Bocklitz, B. F. M. Romeike, R. Reichart, R. Kalff, C. Krafft and J. Popp, Chemom. Intell. Lab. Syst., 2012, 117, 224–232 CrossRef CAS.
- A. Nijssen, T. C. Bakker Schut, F. Heule, P. J. Caspers, D. P. Hayes, M. H. A. Neumann and G. J. Puppels, J. Invest. Dermatol., 2002, 119, 64–69 CrossRef CAS PubMed.
- B. G. Saar, C. W. Freudiger, J. Reichman, C. M. Stanley, G. R. Holtom and X. S. Xie, Science, 2010, 330, 1368–1370 CrossRef CAS PubMed.
- C. Krafft, B. Dietzek and J. Popp, Analyst, 2009, 134, 1046–1057 RSC.
- T. W. Bocklitz, F. S. Salah, N. Vogler, S. Heuke, O. Chernavskaia, C. Schmidt, M. J. Waldner, F. R. Greten, R. Bräuer, M. Schmitt, A. Stallmach, I. Petersen and J. Popp, BMC Cancer, 2016, 16, 534 CrossRef PubMed.
- C.-Y. Lin, J. L. Suhalim, C. L. Nien, M. D. Miljković, M. Diem, J. V. Jester and E. O. Potma, J. Biomed. Opt., 2011, 16, 21104 CrossRef PubMed.
- M. A. Fernandez, C. Albor, M. Ingelmo-Torres, S. J. Nixon, C. Ferguson, T. Kurzchalia, F. Tebar, C. Enrich, R. G. Parton and A. Pol, Science, 2006, 313, 1628–1632 CrossRef CAS PubMed.
- P. Boström, L. Andersson, M. Rutberg, J. Perman, U. Lidberg, B. R. Johansson, J. Fernandez-Rodriguez, J. Ericson, T. Nilsson, J. Borén and S.-O. Olofsson, Nat. Cell Biol., 2007, 9, 1286–1293 CrossRef PubMed.
Footnotes |
| † Electronic supplementary information (ESI) available: Fig. S1–S11 display the workflow, images of IHC, H&E staining, Raman SHP, and Raman virtual staining as well as the Raman and CARS mean spectra of different tissue components. See DOI: 10.1039/c6an02072k |
| ‡ These authors have equally contributed to this work. |
| § Current address: Institute for High-Frequency and Communication Technology, University of Wuppertal, 42119 Wuppertal, Germany. |
| ¶ Current address: Leibniz Institute for Analytical Science (ISAS), 44227 Dortmund, Germany. |
| This journal is © The Royal Society of Chemistry 2017 |

