
An enhanced electrocatalytic oxygen evolution reaction by the photothermal effect and its induced micro-electric field†
Feng
Duan
a,
Qian
Zou
a,
Junzhe
Li
a,
Xiaozhi
Yuan
a,
Xun
Cui
 c,
Chuan
Jing
d,
Shengrong
Tao
d,
Xijun
Wei
*a,
Huichao
He
*b and
Yingze
Song
*a
c,
Chuan
Jing
d,
Shengrong
Tao
d,
Xijun
Wei
*a,
Huichao
He
*b and
Yingze
Song
*a
aState Key Laboratory of Environment-Friendly Energy Materials, School of Materials and Chemistry, Engineering Research Center of Biomass Materials, Ministry of Education, Southwest University of Science and Technology, Mianyang 621010, P. R. China. E-mail: xijunwei1992@swust.edu.cn; yzsong@swust.edu.cn
bInstitute of Environmental Energy Materials and Intelligent Devices, School of Metallurgy and Materials Engineering, Chongqing University of Science and Technology, Chongqing 401331, P. R. China. E-mail: hehuichao@cqust.edu.cn
cState Key Laboratory of New Textile Materials and Advanced Processing Technologies, Wuhan Textile University, Wuhan 430200, P. R. China
dCollege of Science, Chongqing University of Posts and Telecommunications, Chongqing 400065, P. R. China
First published on 20th February 2024
Abstract
Promoting better thermodynamics and kinetics of electrocatalysts is key to achieving an efficient electrocatalytic oxygen evolution reaction (OER). Utilizing the photothermal effect and micro-electric field of electrocatalysts is a promising approach to promote the sluggish OER. Herein, to reveal the relationship of the photothermal effect and its induced micro-electric field with OER performance, NiSx coupled NiFe(OH)y on nickel foam (NiSx@NiFe(OH)y/NF) is synthesized and subjected to the OER under near-infrared (NIR) light. Owing to the photothermal effect and its induced micro-electric field, the OER performance of NiSx@NiFe(OH)y/NF is significantly enhanced. Compared with no NIR light irradiation, the overpotential at 50 mA cm−2 and the Tafel slope of NiSx@NiFe(OH)y/NF under NIR light irradiation were 234.1 mV and 38.0 mV dec−1, which were lower by 12.4 mV and 7.1 mV dec−1, and it exhibited stable operation at 1.6 V vs. RHE for 8 h with 99% activity maintained. This work presents a novel inspiration to understand the photothermal effect-enhanced electrocatalytic OER.
1. Introduction
Hydrogen energy is one of the clean and non-polluting energies with huge potential to replace traditional fossil energy.1–5 Alkaline water electrolysis is an economical method for clean hydrogen generation.6–9 However, hydrogen production by alkaline water electrolysis is generally limited by the inherent thermodynamics and sluggish kinetics resulting from the slow four-electron water oxidation process at the anode (4OH− → 2H2O + O2 + 4e−).10–12 To achieve an efficient OER, many materials are being utilized as electrocatalysts, such as noble metal-based OER electrocatalysts13,14 (e.g., RuO2 and IrO2) and transition metal-based OER electrocatalysts15–20 (e.g., oxides, hydroxide, carbides, phosphides, sulfides, nitrides and polymers). Among them, Ni–Fe-based hydroxide catalysts have exhibited excellent OER activity in alkaline electrolytes due to the bimetallic synergistic effect of Ni and Fe as well as the optimized electronic structures resulting from the rearrangement of the metal atoms.21–23 However, the OER performance of Ni–Fe-based hydroxide is strongly limited by the active sites at the edges and weak conductivity.24,25 In addition, a proper ratio of Ni2+/Ni3+ is crucial for improving the OER properties of Ni–Fe based hydroxide electrocatalysts.26As a classical nonhomogeneous reaction, the electrocatalytic OER is known to contain both thermodynamic and kinetic processes.27,28 In recent years, amorphous electrocatalysts for the electrocatalytic OER have been widely reported to optimize the adsorption and activation of H2O and OH−, the formation of intermediates (O*, OH*, and OOH*) and generation and desorption of O2, which provided a new strategy to enhance the OER activity of Ni–Fe hydroxide.29–32 Furthermore, a previous report has shown that the flat band voltage of Ni–Fe hydroxide is around 0.06 V vs. RHE.33 Thus, according to the heterojunction theory, coupling of materials with different flat-band potentials with Ni–Fe hydroxide can optimize its intrinsic electronic structure and lead to rebalancing of the Fermi level.34 In our previous report, Ni–sulfide (NiSx) coupled with Co3O4 can format a more advantageous electronic structure, and the flat-band potential of nickel sulfides has been reported to be around −0.64 V vs. RHE.35,36 Therefore, it can be assumed that NiSx/NiFe hydroxide would facilitate the formation of more suitable Ni2+/Ni3+ ratios, thus driving an efficient OER.
In addition to modifying the electronic structure of electrocatalysts, achieving enhanced strategies for electrocatalysis using the temperature field generated by the photothermal effect has become an interesting topic in recent years.37–41 From the Arrhenius law  , the catalytic reaction temperature (T) could be known to have a vital influence on the reaction rate (k).42 Electrodes with photo-thermal conversion capability are able to directly utilize energy from renewable solar energy and be heated, which provides a novel strategy to achieve an efficient and economical electrocatalytic reaction. Furthermore, previous experiments as well as simulation studies proved that the construction of semiconductor heterostructures induces the equilibrium of Fermi energy levels, which accelerates electron transfer and creates a micro-electric field induced by photothermal effects.39,43 The micro-electric field can effectively change the adsorption and desorption of reactive substances on the electrocatalyst surface, thus effectively improving the reaction kinetics. Notably, the photothermal response of NiSx in the near-infrared region has been extensively proved.44,45 Thus, these advantages indicated that NiSx/NiFe hydroxide heterostructures can effectively drive a photothermal OER.
Herein, in order to unravel the influence of the photothermal effect and its induced micro-electric field on the thermodynamics and kinetics of the OER, amorphous NiSx@NiFe(OH)y/NF was prepared for a highly efficient OER under NIR light irradiation. Due to the photothermal effect and the induced micro-electric field, the OER performance of NiSx@NiFe(OH)y/NF was significantly enhanced. Notably, compared with no NIR light irradiation, the overpotential at 50 mA cm−2 and the Tafel slope of NiSx@NiFe(OH)y/NF under NIR light irradiation were 234.1 mV and 38.0 mV dec−1, which were lower by 12.4 mV and 7.1 mV dec−1, respectively. Furthermore, NiSx@NiFe(OH)y/NF under NIR irradiation was able to run stably at 1.6 V vs. RHE for 8 h with 99% activity maintained. This work provides novel understanding with beneficial reference towards the enhancement of the water oxidation reaction by the photothermal effect.
2. Experimental section
2.1 Materials preparation
2.2 Characterization studies
An X-ray diffractometer was used (XRD, PANalytical X'pert PRO) to examine the crystal structures of samples. The morphologies and elemental micrographs of samples were analyzed using a scanning electron microscope (SEM, Zeiss SUPRA 55VP) equipped with an energy-dispersive X-ray (EDS) analyzer. Transmission electron microscopy (TEM, FEI Talos F200X) recorded the microstructures of samples. X-ray photoelectron spectroscopy (XPS) of the samples was carried out using a Thermo Scientific K-Alpha spectrometer. The water contact angle of samples was tested and documented using a Kruss K100 surface tension meter.2.3 Electrochemical measurements
All the electrochemical properties were determined using a standard three-electrode quartz cell using a CHI 760E workstation. The fabricated electrodes were used as the working electrode. A graphite rod and a standard Hg/HgO electrode were applied as the counter electrode and reference electrode, respectively. The composition of the electrolyte was an aqueous solution containing 1.0 M KOH. Before electrochemical measurements, 5 cycles of CV activation of working electrodes at a scan rate of 2 mV s−1 within a potential window of 1.0 V to 1.8 V vs. RHE were performed. Linear sweep voltammetry (LSV) was performed at a scanning rate of 2 mV s−1. The tested potentials were transformed into the potentials vs. RHE using the Nernst equation for manual iR-compensation:| ERHE = EHg/HgO + EΘHg/HgO + 0.059 pH − IRs, | (1) |
| ECSA = Cdl/Cs, | (2) |
The oxygen generation rate of NiSx@NiFe(OH)y/NF was calculated from the Faraday law and the precondition that the electrode current efficiency is 100%:47,48
| Q = nZF, | (3) |
| NO2 = n × 1000/t, | (4) |
![[thin space (1/6-em)]](https://www.rsc.org/images/entities/char_2009.gif) 485 C mol−1), NO2 is the rate of oxygen formation (mmol h−1), and t is the time of the reaction (h).
485 C mol−1), NO2 is the rate of oxygen formation (mmol h−1), and t is the time of the reaction (h).
The turnover frequency (TOF) is calculated according to the following formula:
 | (5) |
485 C mol−1), and n is the number of catalytically active sites (mol cm−2).
2.4 Photothermal measurements
Near infrared transformation characteristics of the electrodes in the electrolyte were evaluated using NIR light (wavelength: 808 nm, optical watt density: 2 W cm−2). A water recirculation device was used to avoid the increase in electrolyte temperature under prolonged testing (Fig. S11†). Thermal imaging pictures were recorded using an IR camera (C5, FLIR Systems, Inc., USA), and the temperature of the electrode surfaces illuminated by NIR was examined.3. Results and discussion
3.1 Characterization of NiSx@NiFe(OH)y/NF
Fig. 1a illustrates the preparation of NiSx@NiFe(OH)y/NF by a two-step electrodeposition method, and the image of the resulting samples is shown in Fig. S1.†Fig. 1b exhibits the SEM image of NiSx@NiFe(OH)y/NF. The corresponding EDS mapping of NiSx@NiFe(OH)y/NF is shown in Fig. S2,† which demonstrates the existence of the Ni, Fe, S and O elements. Compared to the SEM image of single NiFe(OH)y/NF and NiSx/NF (Fig. 1c and Fig. S3†), NiSx@NiFe(OH)y/NF has a distinct flocculent presence on the surface of NiFe(OH)y/NF. Fig. 1d shows the XRD patterns of NiSx@NiFe(OH)y/NF, NiFe(OH)y/NF, NiSx/NF and bare NF. Notably, only the diffraction peaks (44.5°, 51.6° and 76.1°) of NF were observed in all samples. In order to exclude the effect of the substrate, the XRD of NiSx@NiFe(OH)y/NF deposited on the FTO substrate was tested. Similarly, no diffraction peaks other than those of the substrate were seen (Fig. S4†), suggesting that NiSx and NiFe(OH)y/NF have weak crystallinity. To further detect the microstructure and morphological details, NiSx@NiFe(OH)y/NF was selected for TEM and high-resolution TEM (HRTEM) characterization. Fig. 1e shows the TEM image of NiSx@NiFe(OH)y in the NiSx@NiFe(OH)y/NF sample. The HRTEM image of NiSx@NiFe(OH)y is shown in Fig. 1f, which clearly exhibits weak crystallinity with no typical lattices of NiSx and NiFe(OH)y. Correspondingly, the absence of distinct crystalline surfaces was observed from the selected area electron diffraction (SAED) pattern (Fig. 1g). | ||
| Fig. 1 (a) Schematic diagram of the synthesis route for NiSx@NiFe(OH)y/NF. SEM images of (b) NiSx@NiFe(OH)y/NF and (c) NiFe(OH)y/NF. (d) XRD patterns of NiSx@NiFe(OH)y/NF, NiFe(OH)y/NF, NiSx/NF and NF. (e) TEM image, (f) high-resolution TEM image, and (g) SAED pattern of NiSx@NiFe(OH)y in NiSx@NiFe(OH)y/NF. (h) HAADF-TEM image and the corresponding STEM-EDS elemental mapping images of NiSx@NiFe(OH)y in NiSx@NiFe(OH)y/NF. | ||
In addition, Fig. 1h shows the STEM-EDS elemental mapping of NiSx@NiFe(OH)y, which indicates an even distribution of Ni, Fe, O and S elements, suggesting that NiSx is uniformly deposited on the surface of NiFe(OH)y/NF. Furthermore, NF is hydrophobic with a contact angle of 109.8°, while the prepared NiSx@NiFe(OH)y/NF surface is superhydrophilic, which enhances the affinity and osmotic hydrophilicity of the electrolyte and thus facilitates the OER process of NiSx@NiFe(OH)y/NF (Fig. S5†). From the above investigation, it was seen that NiSx@NiFe(OH)y/NF is an amorphous heterostructure. As discussed later, this structure has a more suitable electronic structure, which is one of the reasons for its enhanced OER activity.
3.2 OER activity and kinetics of NiSx@NiFe(OH)y/NF
Fig. 2a shows the LSV curves of NF, NiSx/NF, NiFe(OH)y/NF, and NiSx@NiFe(OH)y/NF. Compared with bare NF, NiSx/NF and NiFe(OH)y/NF, NiSx@NiFe(OH)y/NF has a higher OER current density with an overpotential of 246.5 mV at 50 mA cm−2, which was superior to those of NiSx/NF (330.4 mV) and NiFe(OH)y/NF (264.1 mV) (Fig. 2b). In addition, NiSx@NiFe(OH)y/NF exhibited a Tafel slope of 45.1 mV dec−1, which was lower than those of NiSx/NF (86.1 mV dec−1) and NiFe(OH)y/NF (50.3 mV dec−1), suggesting the enhanced reaction kinetics of NiSx@NiFe(OH)y/NF (Fig. 2c). Notably, these Tafel slope results demonstrated that NiSx@NiFe(OH)y/NF has excellent catalytic kinetics for the OER, which is competitive compared to the reported Ni–Fe-based catalysts in recent years (Table S1†). To gain insight into the intrinsic catalytic activity of NiSx@NiFe(OH)y/NF, the EIS of samples was measured. Fig. 2d shows the EIS results of the samples at 1.6 V vs. RHE. Among all samples, the charge transfer resistance of the NiSx@NiFe(OH)y/NF catalyst is 0.5 Ω, which is smaller than that of NiSx/NF (1.15 Ω) and NiFe(OH)y/NF (0.61 Ω), suggesting that it possesses the best OER charge transfer capability and reaction kinetics, corresponding to the Tafel slope results. To avoid disturbances in electrochemical activity by NF substrates, NiSx@NiFe(OH)y and NiFe(OH)y were prepared on FTO to further evaluate their activity and kinetics (NiSx@NiFe(OH)y/FTO and NiFe(OH)y/FTO, Fig. S6†). As shown in Fig. S7,† the LSV and EIS results also show that NiSx@NiFe(OH)y/FTO exhibits higher OER activity and kinetics than NiFe(OH)y/FTO, respectively. In order to evaluate the OER long-term stability, the J–T curves of NiSx@NiFe(OH)y/NF, NiFe(OH)y/NF and NiSx/NF were tested at 1.6 V vs. RHE for 24 h. As shown in Fig. 2e, NiSx@NiFe(OH)y/NF maintains 93% OER activity after 24 h, which does not change significantly compared to those of NiFe(OH)y/NF (89%) and NiSx/NF (88%), indicating that NiSx@NiFe(OH)y/NF has excellent OER stability. Based on the aforementioned studies, it can be seen that NiSx@NiFe(OH)y/NF exhibits better OER activity and kinetics and maintains desirable long-term stability compared to NiFe(OH)y/NF and NiSx/NF. | ||
| Fig. 2 OER performance of NiSx/NF, NiFe(OH)y/NF and NiSx@NiFe(OH)y/NF: (a) LSV curves, (b) overpotential values at 50 mA cm−2, (c) Tafel slopes calculated using the LSV curves, (d) EIS spectra and (e) J–T curves at 1.6 V vs. RHE for 24 h. | ||
To further clarify the origin of the enhanced OER activity and kinetics of NiSx@NiFe(OH)y/NF, we employed XPS to determine the interaction at the heterogeneous interface. As shown in Fig. S8,† the survey XPS shows the existence of elemental Ni, Fe, O and S in NiSx@NiFe(OH)y/NF, elemental Ni, Fe and O in NiFe(OH)y/NF, and elemental Ni and S in NiSx/NF, which is in accordance with the EDS mapping and STEM-EDS mapping results. The chemical states of NiSx@NiFe(OH)y/NF, NiFe(OH)y/NF and NiSx/NF were compared by high-resolution XPS. As shown in Fig. 3a, the binding energies of Ni2+ (855.1/872.8 eV) and Ni3+ (856.9/875.0 eV) of NiSx@NiFe(OH)y/NF were shifted between those of Ni2+ and Ni3+ in NiFe(OH)y/NF and NiSx/NF, which suggests that the interfacial interaction between NiFe(OH)y/NF and NiSx/NF resulted in the redistribution of charge at the interface. In addition, NiSx@NiFe(OH)y/NF and NiFe(OH)y/NF have the same binding energies of Fe2+ (710.1/723.9 eV) and Fe3+ (713.3/727.4 eV), which suggests that there is no significant change in Fe binding energy before and after the introduction of NiSx (Fig. S9†). Moreover, the S peak (Fig. 3b) and O peak (Fig. 3c) of NiSx@NiFe(OH)y/NF are shifted to smaller binding energies by 0.1 eV and 0.4 eV, respectively, with respect to NiFe(OH)y/NF and NiSx/NF, which further proves that NiFe(OH)y/NF and NiSx/NF have electron transfer at the interface of NiSx@NiFe(OH)y/NF.49,50 Furthermore, it has been reported that small changes in the binding states of Ni can lead to the formation of increased active sites on OER electrocatalysts.51 The larger ECSA on NiSx@NiFe(OH)y/NF (4.41) than that on NiSx/NF (4.00) and NiFe(OH)y/NF (3.53) implies that the interfacial interaction of the heterogeneous structure of NiSx@NiFe(OH)y/NF can form more electrochemically active sites (Fig. 3d and Fig. S10†), and Ni is the main active site during the OER.
 | ||
| Fig. 3 High-resolution XPS comparison of (a) Ni 2p, (b) S 2p and (c) O 1s for NiSx@NiFe(OH)y/NF, NiFe(OH)y/NF and NiSx/NF. (d) ECSA values of NiSx@NiFe(OH)y/NF, NiFe(OH)y/NF and NiSx/NF. | ||
3.3 OER activity and kinetics of NiSx@NiFe(OH)y/NF under NIR light irradiation
After establishing NiSx@NiFe(OH)y/NF as the electrode that has the best OER activity in this work, we further evaluated the photothermal effect of NiSx@NiFe(OH)y/NF and attempted to further enhance its OER performance. To verify the impact of the photothermal effect on the electrocatalytic OER of NiSx@NiFe(OH)y/NF, we added 808 nm light (2 W cm−2) to irradiate the NiSx@NiFe(OH)y/NF sample during the OER test (NiSx@NiFe(OH)y/NF-NIR). As shown in Fig. 4a, as expected, the LSV curves show that the OER activity on NiSx@NiFe(OH)y/NF is increased under NIR light illumination, and the overpotential of NiSx@NiFe(OH)y/NF at 50 mA cm−2 is 234.1 mV, which is lower by 12.4 mV than that of the unirradiated NiSx@NiFe(OH)y/NF. As shown in Fig. S12,† NiSx@NiFe(OH)y/NF-NIR has a higher TOF than NiSx@NiFe(OH)y/NF, indicating that NiSx@NiFe(OH)y/NF has a higher catalytic efficiency under NIR light irradiation. Furthermore, NiSx@NiFe(OH)y/NF under NIR light exhibited a Tafel slope of only 38.0 mV dec−1, which was lower than that of NiSx@NiFe(OH)y/NF without NIR light as well as those mentioned in related reports (Table S1†), suggesting the enhanced reaction kinetics (Fig. 4b). In order to understand the difference in the intrinsic catalytic activity of NiSx@NiFe(OH)y/NF under and without NIR light, the samples were subjected to EIS and ECSA measurements. As shown in Fig. 4c and Table S2,† NiSx@NiFe(OH)y/NF has lower solution resistance (Rs) under NIR light irradiation (2.10 Ω), which is probably related to the accelerated ion transport at the electrode–electrolyte interface induced by the photothermal effect. In addition, NiSx@NiFe(OH)y/NF under NIR light shows an Rct value of 0.44 Ω, which is smaller than that of NiSx@NiFe(OH)y/NF without NIR light (0.50 Ω) (Table S3†). The larger ECSA on NiSx@NiFe(OH)y/NF under NIR light (5.01) than that of NiSx/NF NiSx@NiFe(OH)y/NF without NIR light (4.41) suggests that the photothermal effect promotes the active sites of the NiSx@NiFe(OH)y/NF electrode and thus enhances the OER activity (Fig. S13†). To further investigate the OER stability, the J–T curves of NiSx@NiFe(OH)y/NF under NIR light were tested at 1.6 V vs. RHE for 8 h. As shown in Fig. 4d and Fig. S14,† NiSx@NiFe(OH)y/NF under NIR light illumination has increased OER activity, and its stability changes negligibly with respect to NiSx@NiFe(OH)y/NF without NIR light. NiSx@NiFe(OH)y/NF produced oxygen at a faster rate (0.58 mmol h−1) with NIR light than NiSx@NiFe(OH)y/NF without NIR light (0.44 mmol h−1) (Table S3†). As shown in Fig. S15,† the XRD patterns of NiSx@NiFe(OH)y/NF before and after NIR light irradiation test were consistent with that of the original NiSx@NiFe(OH)y/NF sample, indicating that there is no other crystalline material generation. In addition, the O2 generation rates on NiSx@NiFe(OH)y/NF under and without NIR light irradiation are more clearly illustrated in ESI Video 1.†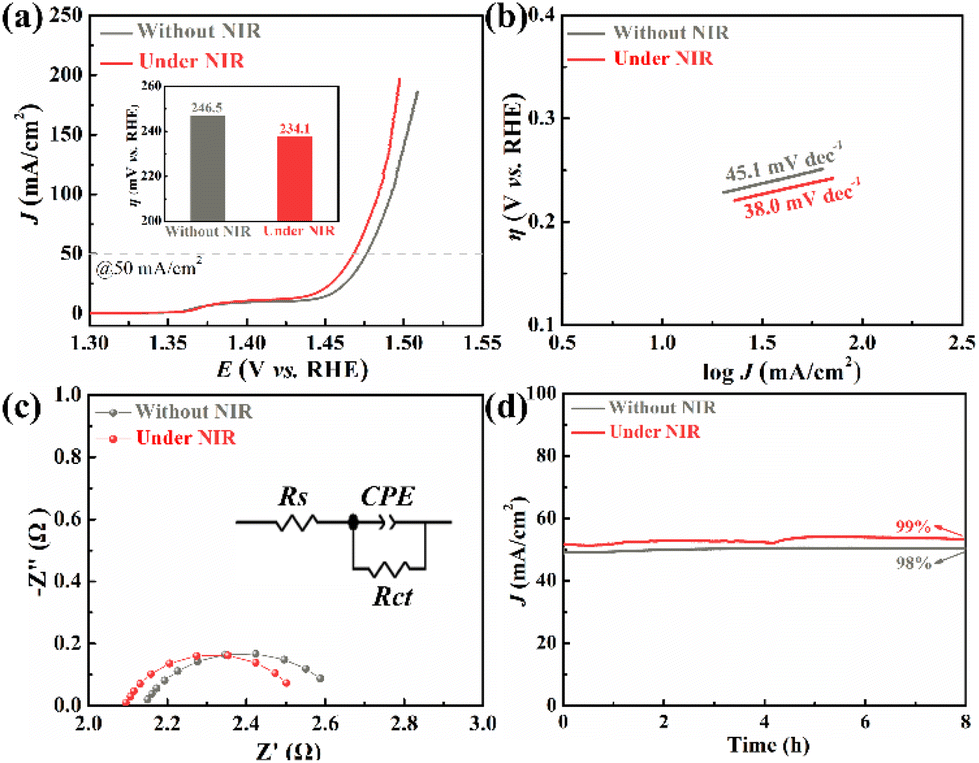 | ||
| Fig. 4 OER performance of NiSx@NiFe(OH)y/NF under and without NIR light: (a) LSV curves (inset: the overpotential at 50 mA cm−2 of NiSx@NiFe(OH)y/NF under and without NIR light), (b) Tafel slopes derived from the LSV curves, (c) EIS spectra, and (d) J–T curves at 1.6 V vs. RHE for 8 h. | ||
Subsequently, we systematically investigated the origin of the enhanced OER kinetics and activity of NiSx@NiFe(OH)y/NF under near-infrared light irradiation. As mentioned before, the OER is a classical nonhomogeneous reaction, in which reaction rate dependence on the temperature can be deduced from the Arrhenius equation. The temperature variations and thermal imaging pictures of NiSx@NiFe(OH)y/NF and NiFe(OH)y/NF in 1.0 M KOH solution under NIR light are shown in Fig. 5a. It is obvious that NiSx@NiFe(OH)y/NF after the same time of NIR light irradiation has a higher electrode temperature than NiFe(OH)y/NF. Moreover, the negligible temperature change of the electrolyte (1.0 M KOH) excludes the effect of near-infrared light on the electrolyte. As shown in Fig. 5b, the UV-Vis-NIR absorption spectra show that NiSx@NiFe(OH)y/NF has a higher light absorption capacity than NiFe(OH)y/NF and NF, which contributes significantly to its photo-thermal ability and is in agreement with the temperature test shown in Fig. 5a. Furthermore, as shown in Fig. 5c, under NIR light, the current response of NiSx/NF (2.86 mA cm−2) is larger than that of NiFe(OH)y/NF (2.09 mA cm−2) and is close to that of NiSx@NiFe(OH)y/NF (3.15 mA cm−2). As shown in Fig. S16 and S17,† NiSx/NF under NIR light irradiation has a greater ECSA change than NiFe(OH)y/NF under NIR light irradiation, which further indicates that NiSx/NF has a stronger photothermal response than NiFe(OH)y/NF. From the above discussion, it can be suggested that the photothermal effect of NiSx is the main reason for the increase of current response of NiSx@NiFe(OH)y/NF.
 | ||
| Fig. 5 (a) Thermal imaging pictures of I: NiSx@NiFe(OH)y/NF and II: NiFe(OH)y/NF in 1.0 M KOH solution and III: 1.0 M KOH solution under NIR light irradiation. (b) UV-Vis absorption spectra of NF, NiFe(OH)y/NF and NiSx@NiFe(OH)y/NF. (c) J–T curves at 1.6 V vs. RHE of NiSx/NF, NiFe(OH)y/NF and NiSx@NiFe(OH)y/NF. (d) CV curves of NiSx@NiFe(OH)y/NF before, under and after NIR light illumination. (e) Open circuit potential (OCP) of NiSx@NiFe(OH)y/NF with and without NIR light illumination. | ||
Furthermore, some reports have found that the photothermal effect can promote the formation of a micro-electric field at the electrode.52 To verify that possibility, the CV curves of NiSx@NiFe(OH)y/NF before, after and under NIR light illumination were first measured. As shown in Fig. 5d, upon irradiation with near-infrared light, NiSx@NiFe(OH)y/NF has an enhanced oxidation peak, which is consistent with the previous observation that the photothermal effect accelerates the OER kinetics with the promotion of more reactive active site generation (Ni2+ → Ni3+). Furthermore, after NIR irradiation, the enhanced oxidation peak still appeared in the CV curve, suggesting that the photothermal effect can promote the redistribution of the surface charge of NiSx@NiFe(OH)y/NF and generate more active Ni3+ sites. As shown in Fig. S18,† it is noteworthy that the peak area ratio of Ni3+ in Ni 2p in high-resolution XPS increased from 19.6% (before NIR light irradiation) to 35.3% (after NIR light irradiation), while the peak area ratio of Ni2+ in Ni 2p in high-resolution XPS decreased from 52.8% (before NIR light irradiation) to 43.9% (after NIR light irradiation), which further suggested the rearrangement of the surface charge in NiSx@NiFe(OH)y/NF. In addition, the open circuit potential (OCP) of NiSx@NiFe(OH)y/NF in the absence and presence of NIR light irradiation demonstrates variations in the surface electric field.43 As shown in Fig. 5e, the open-circuit potential variation of NiSx@NiFe(OH)y/NF before and after NIR light irradiation is 0.019 V, which further indicates that the photothermal effect can promote the formation of a micro-electric field in NiSx@NiFe(OH)y/NF.
4. Conclusions
In summary, we demonstrated that the photothermal effect and its induced micro-electric field can significantly improve the thermodynamic and kinetics properties of the electrocatalytic OER on NiSx@NiFe(OH)y/NF. NiSx@NiFe(OH)y/NF has an obvious heterojunction effect and can effectively absorb NIR light, which together improve the OER performance of NiSx@NiFe(OH)y/NF. It is noteworthy that due to the photothermal effect and the induced micro-electric field, the OER performance of NiSx@NiFe(OH)y/NF is significantly enhanced. Compared with no NIR light irradiation, the overpotential at 50 mA cm−2 and the Tafel slope of NiSx@NiFe(OH)y/NF under NIR light irradiation were 234.1 mV and 38.0 mV dec−1, which were lower by 12.4 mV and 7.1 mV dec−1, respectively. Furthermore, NiSx@NiFe(OH)y/NF under NIR irradiation was able to operate consistently at 1.6 V vs. RHE for 8 h with 99% activity maintained. This work provides inspiration for enhancing the thermodynamics and kinetics of electrocatalysts for the OER.Conflicts of interest
The authors declare no competing financial interest.Acknowledgements
This work was supported by the National Natural Science Foundation of China (22005254, 41702037, 52302220 and 52373087), the Natural Science Foundation of Sichuan Province (2023NSFSC1128), the Natural Science Foundation of Chongqing (2023NSCQ-MSX0210), the Project of Innovation Training Program for College Students in Sichuan Province (S202310619089), the Project of Southwest University of Science and Technology (20zx7142), and the Graduate Science and Technology Innovation Training Program Project of Chongqing University of Science and Technology (YKJCX2220202 and YKJCX2220520).Notes and references
- Z. W. Seh, J. Kibsgaard, C. F. Dickens, I. Chorkendorff, J. K. Norskov and T. F. Jaramillo, Science, 2017, 355, eaad4998 CrossRef PubMed.
- P. De Luna, C. Hahn, D. Higgins, S. A. Jaffer, T. F. Jaramillo and E. H. Sargent, Science, 2019, 364, eaav3506 CrossRef CAS PubMed.
- Y. Luo, Z. Zhang, M. Chhowalla and B. Liu, Adv. Mater., 2022, 34, 2201486 Search PubMed.
- J. T. Ren, L. Chen, H. Y. Wang, W. W. Tian and Z. Y. Yuan, Energy Environ. Sci., 2024, 17, 49–113 RSC.
- Q. Hu, J. Hou, Y. Liu, L. Li, Q. Ran, J. Mao, X. Liu, J. Zhao and H. Pang, Adv. Mater., 2023, 35, 2303336 CrossRef CAS PubMed.
- Z. Y. Yu, Y. Duan, X. Y. Feng, X. Yu, M. R. Gao and S. H. Yu, Adv. Mater., 2021, 33, e2007100 CrossRef PubMed.
- J. Zhao, J. J. Zhang, Z. Y. Li and X. H. Bu, Small, 2020, 16, 2003916 CrossRef CAS PubMed.
- T. Zhao, Y. Wang, S. Karuturi, K. Catchpole, Q. Zhang and C. Zhao, Carbon Energy, 2020, 2, 582–613 CrossRef CAS.
- Y. Wang, J. Mi and Z. S. Wu, Chem Catal., 2022, 2, 1624–1656 CrossRef CAS.
- M. Yu, E. Budiyanto and H. Tuysuz, Angew. Chem., Int. Ed., 2022, 61, e202103824 CrossRef CAS.
- X. Xie, L. Du, L. Yan, S. Park, Y. Qiu, J. Sokolowski, W. Wang and Y. Shao, Adv. Funct. Mater., 2022, 32, 2110036 CrossRef CAS.
- H. Ding, H. Liu, W. Chu, C. Wu and Y. Xie, Chem. Rev., 2021, 121, 13174–13212 CrossRef CAS PubMed.
- Q. Shi, C. Zhu, D. Du and Y. Lin, Chem. Soc. Rev., 2019, 48, 3181–3192 RSC.
- F. Gao, Y. Zhang, Z. Wu, H. You and Y. Du, Coord. Chem. Rev., 2021, 436, 213825 CrossRef CAS.
- Y. Zhao, J. You, L. Wang, W. Bao and R. Yao, Int. J. Hydrogen Energy, 2021, 46, 39146–39182 CrossRef CAS.
- X. Wang, H. Zhong, S. Xi, W. S. V. Lee and J. Xue, Adv. Mater., 2022, 34, 2107956 CrossRef CAS PubMed.
- V. Vij, S. Sultan, A. M. Harzandi, A. Meena, J. N. Tiwari, W. G. Lee, T. Yoon and K. S. Kim, ACS Catal., 2017, 7, 7196–7225 CrossRef CAS.
- X. Cui, M. Wu, X. Liu, B. He, Y. Zhu, Y. Jiang and Y. Yang, Chem. Soc. Rev., 2024, 53, 1447–1494 RSC.
- Z. P. Wu, X. F. Lu, S. Q. Zang and X. W. Lou, Adv. Funct. Mater., 2020, 30, 1910274 CrossRef CAS.
- A. Wang, Z. Zhao, D. Hu, J. Niu, M. Zhang, K. Yan and G. Lu, Nanoscale, 2019, 11, 426–430 RSC.
- K. Zhu, X. Zhu and W. Yang, Angew. Chem., Int. Ed., 2018, 58, 1252–1265 CrossRef PubMed.
- J. Mohammed-Ibrahim, J. Power Sources, 2020, 448, 227375 CrossRef CAS.
- R. Zhang, A. Xie, L. Cheng, Z. Bai, Y. Tang and P. Wan, Chem. Commun., 2023, 59, 8205–8221 RSC.
- M. Liu, K. A. Min, B. Han and L. Y. S. Lee, Adv. Energy Mater., 2021, 11, 2101281 CrossRef CAS.
- L. Gong, H. Yang, A. I. Douka, Y. Yan and B. Y. Xia, Adv. Sustainable Syst., 2020, 5, 2000136 CrossRef.
- D. Drevon, M. Görlin, P. Chernev, L. Xi, H. Dau and K. M. Lange, Sci. Rep., 2019, 9, 1532 CrossRef PubMed.
- A. J. Bard and L. R. Faulkner, Electrochemical methods: fundamentals and applications, John Wiley & Sons Inc., New York, 2000 Search PubMed.
- M. Menzinger and R. Wolfgang, Angew. Chem., Int. Ed. Engl., 1969, 8, 438–444 CrossRef CAS.
- T. Guo, L. Li and Z. Wang, Adv. Energy Mater., 2022, 12, 2200827 CrossRef CAS.
- X. Li, X. Hao, A. Abudula and G. Guan, J. Mater. Chem. A, 2016, 4, 11973–12000 RSC.
- S. Anantharaj and S. Noda, Small, 2020, 16, e1905779 CrossRef PubMed.
- J. S. Kim, B. Kim, H. Kim and K. Kang, Adv. Energy Mater., 2018, 8, 1702774 CrossRef.
- D. Zhou, S. Wang, Y. Jia, X. Xiong, H. Yang, S. Liu, J. Tang, J. Zhang, D. Liu, L. Zheng, Y. Kuang, X. Sun and B. Liu, Angew. Chem., Int. Ed., 2018, 58, 736–740 CrossRef PubMed.
- J. Zhang, J. Qian, J. Ran, P. Xi, L. Yang and D. Gao, ACS Catal., 2020, 10, 12376–12384 CrossRef CAS.
- F. Duan, Y. Huang, T. Han, B. Jia, X. Zhou, Y. Zhou, Y. Yang, X. Wei, G. Ke and H. He, Inorg. Chem., 2023, 62, 12119–12129 CrossRef CAS PubMed.
- Y. Li, X. Li, X. T. Wang, L. J. Jian, N. I. M. Abdallah, X. F. Dong and C. W. Wang, Colloids Surf., A, 2021, 608, 125565 CrossRef CAS.
- B. Jin, Y. Li, J. Wang, F. Meng, S. Cao, B. He, S. Jia, Y. Wang, Z. Li and X. Liu, Small, 2019, 15, e1903847 CrossRef PubMed.
- J. Yao, W. Huang, W. Fang, M. Kuang, N. Jia, H. Ren, D. Liu, C. Lv, C. Liu, J. Xu and Q. Yan, Small Methods, 2020, 4, 2000494 CrossRef CAS.
- L. Gao, X. Cui, Z. Wang, C. D. Sewell, Z. Li, S. Liang, M. Zhang, J. Li, Y. Hu and Z. Lin, Proc. Natl. Acad. Sci. U. S. A., 2021, 118, e2023421118 CrossRef CAS PubMed.
- H. J. Niu, Y. Yan, S. Jiang, T. Liu, T. Sun, W. Zhou, L. Guo and J. Li, ACS Nano, 2022, 16, 11049–11058 CrossRef CAS PubMed.
- Y. Chang, Z. Ma, X. Lu, S. Wang, J. Bao, Y. Liu and C. Ma, Angew. Chem., Int. Ed., 2023, 62, e202310163 CrossRef CAS.
- S. R. Logan, J. Chem. Educ., 1982, 59, 279–281 CrossRef CAS.
- Z. Wang, Y. Wang, Y. Zhang, X. Sun, Y. Lou, Y. Zhang, Y. Dong, C. Pan and Y. Zhu, Appl. Catal., B, 2022, 313, 121452 CrossRef CAS.
- Y. Zhang, Y. Wang, H. Jiang and M. Huang, Small, 2020, 16, e2002550 CrossRef.
- B. Zhang, H. Luo, B. Ai, Q. Gou, J. Deng, J. Wang, Y. Zheng, J. Xiao and M. Li, Small, 2022, 19, 2205431 CrossRef PubMed.
- L. Yang, H. Li, Y. Yu, Y. Wu and L. Zhang, Appl. Catal., B, 2020, 271, 118939 CrossRef CAS.
- A. K. Díaz-Duran, G. Iadarola-Pérez, E. B. Halac and F. Roncaroli, Top. Catal., 2022, 65, 887–901 CrossRef.
- Z. Zhao, X. Wang, S. Tang, M. Cheng and Z. Shao, Int. J. Hydrogen Energy, 2021, 46, 25332–25340 CrossRef CAS.
- A. Wang, H. Li, J. Xiao, Y. Lu, M. Zhang, K. Hu and K. Yan, ACS Sustainable Chem. Eng., 2018, 6, 15995–16000 CrossRef CAS.
- M. Chen, N. Kitiphatpiboon, C. Feng, Q. Zhao, A. Abudula, Y. Ma, K. Yan and G. Guan, Appl. Catal., B, 2023, 330, 122577 CrossRef CAS.
- F. Du, L. Shi, Y. Zhang, T. Li, J. Wang, G. Wen, A. Alsaedi, T. Hayat, Y. Zhou and Z. Zou, Appl. Catal., B, 2019, 253, 246–252 CrossRef CAS.
- Y. Gutiérrez, M. Losurdo, F. González, H. O. Everitt and F. Moreno, J. Phys. Chem. C, 2020, 124, 7386–7395 CrossRef.
Footnote |
| † Electronic supplementary information (ESI) available. See DOI: https://doi.org/10.1039/d4nr00170b |
| This journal is © The Royal Society of Chemistry 2024 |