 Open Access Article
Creative Commons Attribution 3.0 Unported Licence
Lanthanide doped nanoparticles for reliable and precise luminescence nanothermometry in the third biological window
Ana C. C.
Soares
 a,
Tasso O.
Sales
 a,
Erving C.
Ximendes
 bc,
Daniel
Jaque
 *bc and
Carlos
Jacinto
 *a
*a
aGroup of Nano-Photonics and Imaging, Instituto de Física, Universidade Federal de Alagoas, 57072-900, Maceió-AL, Brazil. E-mail: cjacinto@fis.ufal.br
bNanomaterials for Bioimaging Group (nanoBIG), Departamento de Física de Materiales, Facultad de Ciencias, Universidad Autónoma de Madrid, Madrid 28049, Spain. E-mail: daniel.jaque@uam.es
cNanomaterials for Bioimaging Group (nanoBIG), Instituto Ramón y Cajal de Investigación Sanitaria, Hospital Ramón y Cajal, Madrid 28034, Spain
First published on 23rd May 2023
Abstract
In recent years, infrared emitting luminescent nanothermometers have attracted significant attention because their potential for the development of new diagnosis and therapy procedures. Despite their promising applications, concerns have been raised about their reliability due to the spectral distortions induced by tissues that are present even in the commonly used second biological window (1000–1370 nm). In this work, we present an innovative solution to this issue by demonstrating the effectiveness of shifting the operation range of these nanothermometers to the third biological window (1550–1850 nm). Through experimental evidence using ytterbium, erbium, and thulium tri-doped CaF2 nanoparticles, we demonstrate that luminescence spectra acquired in the third biological window are minimally distorted by the presence of tissue, opening the way to reliable luminescence thermometry. In addition, advanced analysis (singular value decomposition) of emission spectra allows sub-degree thermal uncertainties to be achieved.
Introduction
Temperature governs and controls physiological processes.1,2 In recent years, different nanomaterials have been proposed as thermal reporters,3–5 and, despite their applicability in a diversity of fields, they have found some limitations when being applied in biomedicine. For instance, thermal measurements in living systems should be achieved in a remote way in order to interfere minimally with the normal behaviour of the system. In order to achieve such remote thermal monitoring luminescent nanothermometers (LNThs) have emerged as a potential solution.5,6 LNThs are luminescent nanoparticles whose emission is temperature dependent so that thermal readout can be achieved from an adequate analysis of their emission. Thermal readout can be achieved from the analysis of one or more spectroscopic parameters such as the peak position, linewidth, intensity ratio or polarisation state.7–9LNThs have been able to provide thermal readouts inside cells and living animals.7,8 Indeed, LNThs have already been used for sub-degree thermal reading in tissues, for early detection of incipient diseases such as ischemia and tumours, for tissue diagnosis and for providing thermal control in photothermal therapies at the in vivo level.7,9,10 In spite of this recent success, the in vivo application of luminescence thermometry needs to overcome some inherent limitations that are related to the optical extinction of tissues.
On one hand, the strong attenuation of visible light in tissues makes it difficult to access internal organs optically.11 This limits the potential of visible-emitting LNThs. Indeed, in vivo luminescence thermometry requires working in the near-infrared (NIR) spectral range due to the lower absorption and scattering of light in this spectral range. Traditionally, NIR is divided into three biological windows (BWs), where optical extinction is minimum: the first (BW-I) extending from 650 up to 950 nm, the second (BW-II) ranging from 1000 up to 1370 nm and the third (BW-III) from 1550 up to 1870 nm.12,13 BW-I has the drawback of interference with autofluorescence;14,15 however, the absence of water absorption in this spectral range makes it ideal for laser excitation.16,17 Operating within BW-II results in an improved signal-to-noise ratio, a reduced (but not negligible) autofluorescence background and availability of cost-effective fluorescence cameras.18,19 All these together have made BW-III very popular for pre-clinical fluorescence imaging. Finally, BW-III offers advantages such as the complete absence of autofluorescence and minimum tissue extinction but it is not extensively explored due to the absence of accessible fluorescence cameras working in this spectral range.13,20,21 As a consequence of all these pros and cons most of the work on in vivo fluorescence imaging and thermometry has been traditionally developed by using probes working in BW-I,22–24 although during the last few years the use of optical probes working in BW-II has become more and more popular. A reduced number of studies have demonstrated the suitability of optical probes working in BW-III for high penetration in vivo imaging.21,25–30
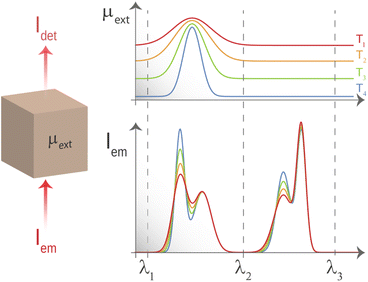
Tissue-induced light extinction not only affects the depth achievable by LNThs but also impacts their reliability.31–39 When a given tissue has a flat extinction spectrum, meaning it lacks any significant peaks or valleys within a certain wavelength range, the light that passes through it will retain its spectral shape (it will retain the relative intensities between emission lines). Hence, while there will be an overall reduction in intensity, the shape of the spectrum will remain the same. This property becomes particularly useful in luminescence thermometry. To grasp this concept, let's consider a scenario where a LNTh is located within a medium that has an extinction coefficient with thermal and wavelength dependencies described using μ(λ,T). According to the Beer–Lambert law, the luminescence intensity detected at wavelength λ after passing through the medium at a temperature T is given by:
| Idet(λ,T) = Io(λ,T)e−μ(λ,T)L | (1) |
Thus, the ratio between the detected intensities at λi and λf is given by:
 | (2) |
However, if λi and λf are within the spectral range in which the extinction coefficient of the surrounding medium is flat (range [λ2, λ3] schematically represented in Fig. 1), the detected ratio becomes:
 | (3) |
Luckily, when analysing the extinction coefficient, μ, of representative human tissues (Fig. 2(a), as obtained from ref. 40) in the 600–2250 nm spectral range, it is found that in the 1590–1860 nm region, μ is approximately constant. And this range is found within what is generally described as BW-III.12 To further demonstrate this, Fig. 2(b) shows the derivative of the extinction coefficient as calculated from Fig. 2(a) showing how this remains close to zero in a great portion of BW-III. As explained above, this means that thermometry based on the luminescence intensity ratio can be made reliable. Despite that there are already some studies reporting on LNThs operating in BW-III,25,29,41–44 none of them have explored the possible presence/absence of tissue-induced spectral distortions.
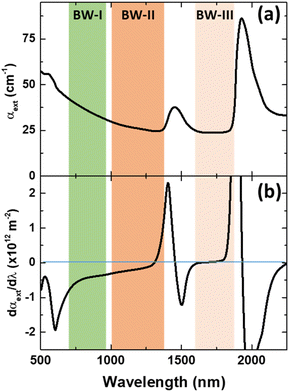 | ||
| Fig. 2 (a) Extinction coefficient of human (prostate) tissue. The spectral extension of the three biological windows is indicated. Data obtained from ref. 40. (b) Derivative of the absorption coefficient of human tissue with respect to the wavelength as calculated form (a). | ||
In this work we have investigated the use of lanthanide doped nanoparticles for thermal sensing in BW-III. In particular we have evaluated the performance of Yb3+, Er3+ and Tm3+ doped CaF2 nanoparticles (NPs) as LNThs in BW-III. CaF2 NPs have been selected as host materials due to their low effective phonon energy (280 cm−1 that ensures low nonradiative decay probabilities), broad transparency window (from UV to IR), simple synthesis route, and low toxicity in biological systems.45–48 Experiments have been conducted to demonstrate the suitability of Tm3+ emissions in BW-III for reliable (distortion-free) luminescence thermometry. In addition, we have also explored the potential use of advanced analysis to improve the thermal uncertainties of the thermal readouts provided by CaF2 NPs.
Experiments
Synthesis of nanoparticles
For the synthesis of the nanoparticle (CaF2:10Yb3+/6Er3+/1Tm3+), an amount of 0.83 mmol of CaCl2, 0.1 mmol of YbCl3, 0.06 mmol of ErCl3 and 0.01 mmol of TmCl3 were added in a 100 ml round bottom single neck flask containing 20 ml of Milli-Q water and the solution was heated at 90 °C, approximately, under constant stirring. Subsequently, 2 mmol of a NH4F solution was injected into the mixture dropwise and kept at 90 °C for 1 h under vigorous stirring. After this time and after being cooled down to room temperature naturally, white precipitates were collected by centrifugation and washed with Milli-Q water three times. The resulting product was dried at 60 °C in an ambient atmosphere for 48 h and finally heat treated at 500 °C for 3 h. We did not simply choose these rare-earth ion concentrations, but a detailed study was carried out in which we concluded that this sample is the best in terms of luminescence relative to the investigated bands.Experimental apparatus
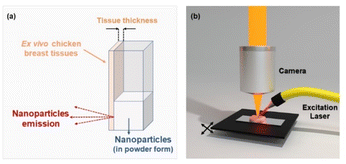
The luminescence measurements were performed by using a fluorometer (NanoLog, Horiba) coupled to an R928P or R5509-73 photomultiplier tube or a liquid nitrogen refrigerated solid state extended InGaAs detector. The 10Yb3+/6Er3+/1Tm3+ co-doped CaF2 NPs were optically excited using a Lumics Laser operating at 940 nm, which was focused on the sample. For thermal analysis, Peltier plates connected to a voltage source were used as heating systems, and the electrical voltage was manually adjusted at the source to work within the physiological temperature range. The measurements for biological applications were made using ex vivo chicken breast tissue. Tissue-induced spectral distortions were investigated by placing the chicken breast in front of the cuvette containing the NPs; the fluorescence signal was collected using an optical fiber and dispersed to a monochromator, as shown in Fig. 3(a). The luminescence spectra/images were collected using a confocal fluorescence microscope (LabRam Evolution UV-VIS-NIR) coupled with a Symphony II detector and focused with a 20 × long working distance microscope. In this case, we placed the biological tissue under the mobile platform and scanned it, as illustrated in Fig. 3(b).Results and discussion
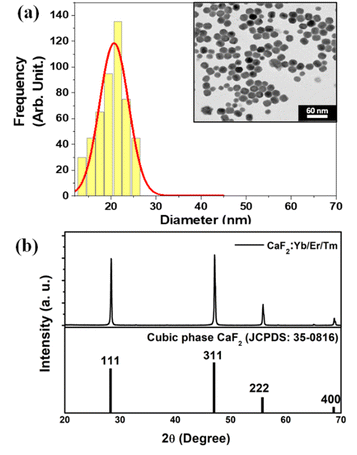
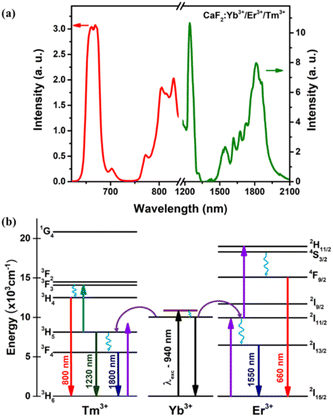
The inset of Fig. 4(a) shows a characteristic transmission electron microscopy (TEM) image of the CaF2:Yb/Tm/Er NPs utilized in this work. The size histogram that has been calculated from the statistical analysis of the TEM image is also included in Fig. 4(a), from which fitting to lognormal distributions resulted in an average diameter of 20.8 ± 0.3 nm with a width of 7.5 nm (R-square = 0.93 was obtained). A typical XRD pattern of CaF2:Yb/Tm/Er NPs is shown in Fig. 4(b)-top. The sharp diffraction peaks in the pattern in Fig. 4(b)-bottom can be indexed as pure cubic-phase CaF2, which is in good agreement with the standard XRD pattern JCPDS 35-0816 (Fig. 4(b)-bottom). No other impurity peaks were identified, which indicates formation of pure cubic-phase CaF2 structures with a highly crystalline nature. Compared with the standard peaks, all the diffraction peaks of pure cubic-phase CaF2 are barely shifted, because the ionic radius of Ca2+ is close to the dopant ionic radius of the ions Yb3+ and Er3+.At room temperature and under 940 nm excitation, the Yb–Er–Tm triply doped CaF2 NPs present four characteristic emission bands at around 660, 1230, 1550 and 1800 nm, as shown in Fig. 5(a). These luminescence bands lie within the three BWs as defined previously. In addition, the laser excitation at 940 nm (in BW-I) is sufficiently far from the water absorption peak (∼980 nm) so that heating is avoided. The Yb3+ ions act as sensitizers absorbing the 940 nm radiation through the 2F7/2 → 2F5/2 transition and by means of energy transfer (ET) both Er3+ (4I11/2) and Tm3+ (3H5) ions are excited. Multiphonon nonradiative decays populate the 4I13/2 energy level of Er3+ ions from which the emission at around 1550 nm is produced (4I13/2 → 4I15/2 transition). A second photon excites the Er3+ ions to the 4S3/2 level through a second ET from the Yb3+ to Er3+ ions, from which multiphonon decay occurs to the 4F9/2 level, promoting the emission at around 660 nm (4F9/2 → 4I15/2 transition). The 3H5 → 3H6 radiative decay of Tm3+ ions gives rise to the emission around 1230 nm. Multiphonon decay from the 3H5 level populates the 3F4 state, from which the emission at around 1800 nm is generated (3F4 → 3H6 transition). Excitation of Tm3+ ions from the 3H5 level to the 3F2 state occurs thanks to energy transfer from Er3+ ions. Nonradiative transitions from the 3F2 state populate the 3H4 energy level from which the emission at around 800 nm is generated (see Fig. 5(b)).
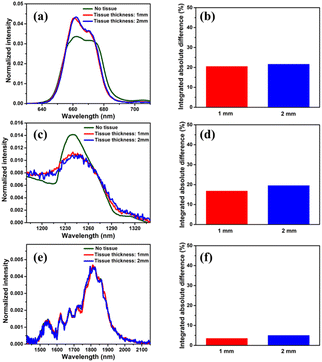
For the sake of evaluating the performance of CaF2:Yb3+/Er3+/Tm3+ NPs for subtissue applications, we have investigated the spectral distortions induced in the different emission bands of CaF2:Yb3+/Er3+/Tm3+ NPs by chicken breast tissues with thicknesses of 1.0 and 2.0 mm (red and blue curves in Fig. 6(a), (c) and (e)). It is possible to notice that the emission bands lying within BW-I and BW-II present larger distortions when compared to those induced in the III-BW. Indeed, the Tm3+ emission at around 1700 nm practically maintains its spectral shape even in the presence of a 2 mm thick tissue. To quantify the tissue-induced spectral distortions, the percentage difference (σ) in the spectral shape was evaluated according to a parameter previously defined by Ximendes et al.49 as:
 | (4) |
 ). The results included in Fig. 6(b), (d) and (f) reveal that the tissue-induced percentual change in the shape of the spectra in BW-I and BW-II are 20.5% and 21.6%, respectively (for a tissue thickness of 2 mm). On the other hand, the tissue-induced spectral distortion obtained in BW-III was significantly reduced down to 4%. When it comes to subcutaneous sensing based on ratiometric luminescence thermometry, the reduction of σ is of utmost importance, as it has been explained previously. Hence, we will hereafter focus on the emission of our CaF2:Yb3+/Er3+/Tm3+ NPs lying within BW-III for ratiometric thermal sensing.
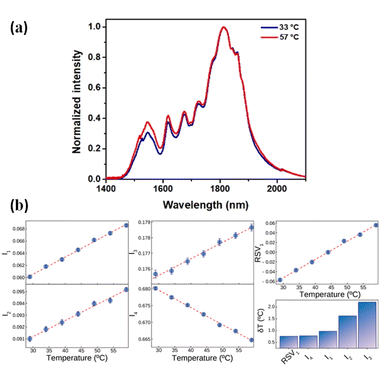
Fig. 7(a) shows the normalized (to the intensity at 1812 nm) emission spectra of CaF2:Yb3+/Er3+/Tm3+ NPs as obtained at 33 and 57 °C in BW-III. A relative reduction in the emission of Tm3+ ions at around 1800 nm and an increment in the emission of Er3+ at around 1550 nm are observed. Due to the different thermal quenching of Er3+ and Tm3+ ions and to the population distribution between the Tm3+ levels, the shape of the emission spectra changes with temperature. This opens the possibility of using the BW-III band of CaF2:Yb3+/Er3+/Tm3+ NPs for thermal sensing. As it has been discussed previously, reliable ratiometric thermal sensing would be possible only by considering the emission lines that are within the spectral range in which the extinction coefficient is flat. Then, according to the data included in Fig. 2, reliable thermal sensing can be achieved by using the temperature dependence of the intensities of the emission lines lying within the 1590–1860 nm range. This means that for thermal sensing purposes we can use the temperature dependence of the emission lines at 1618, 1675, 1725 and 1812 nm normalized to integrated emitted intensity (I1, I2, I3 and I4, respectively). The temperature variations of these intensities (normalized to the integrated emission in the whole band) are shown in Fig. 7(b). The traditional approach for ratiometric thermal sensing consists of recording the temperature variation of these normalized intensities so that a proper analysis of emission shape can give the thermal readout. Alternatively, as recently demonstrated, multiple linear regression can also be applied to obtain a larger thermal sensitivity.50 Nevertheless, computing the thermal dependence of each of these parameters and building a regression model based on them can be a burdensome task. As a matter of fact, it can be a statistically complex process due to the possibility of the dependent variables being collinear. Thus, to avoid these issues and make the analysis simpler, we applied single value decomposition (SVD) to the dataset containing the temperature dependence of relative emitted intensities at these wavelengths. SVD is a computational method that falls into the category known as dimensionality reduction (DR), which, simply put,51,52 is a way of representing a dataset in a space of lower dimensionality. It is a matrix factorization technique widely used in scientific research and a powerful tool that can extract important information from large datasets, such as patterns and relationships between variables. SVD decomposes a matrix dataset into three other matrices: a left singular matrix, a diagonal matrix, and a right singular matrix. The diagonal matrix contains the singular values of the original matrix, which represent the relative importance of each column and row in the original matrix. These singular values can be used to reduce the dimensionality of the original matrix, allowing for easier computation and visualization of data. It has a wide range of applications in various fields, such as computer vision, natural language processing, and recommendation systems. It has several applications in spectroscopy, particularly in processing and analysing spectroscopic data. One of the main applications is noise reduction. Spectroscopic data often contain a significant amount of noise, which can affect the accuracy and reliability of the analysis. SVD can be used to remove noise from the data by identifying the principal components of the data and eliminating the components that are due to noise. This results in a cleaner and more accurate spectrum, which can be used for further analysis. For our purposes, SVD is a very handy technique since visualizing the simultaneous dependence of four different parameters is not so straightforward. Additionally, DR techniques have recently been shown to best summarize the calibration of a luminescent thermometer and to provide better precision in thermal readouts.33
When applying SVD to the dataset defined using all the relative intensities, more than 95% of the variance (computed from the relative contribution of the eigenvalues Fig. 7(b)) can be explained using a single vector (hereafter RSV1). Both the values of the level of variance explained and the coordinates of RSV1 are found through the factorization of the data matrix. The thermal dependence of RSV1 is included in Fig. 7(b) and represents a very linear trend. When estimating the thermal resolution achieved by the readouts given by the four relative intensities and the readout provided by RSV1, it has been shown that the uncertainty is minimized with the latter although the performance improvement with respect to that achieved by analysing only I4 is reduced (bar graph included in Fig. 7(b)).
Conclusions
In conclusion, we investigated the potential of a luminescent nanothermometer based on Yb3+/Er3+/Tm3+ tri-doped calcium fluoride (CaF2) nanoparticles operating in three biological windows. It was shown that their emission in the third biological window was minimally affected by the presence of a biological tissue. Hence, it could be optimal for subcutaneous luminescence sensing. The thermal dependence of the luminescence of the nanoparticles was then studied and several thermometric parameters were identified. The application of singular value decomposition to the set of parameters provided a single parameter that could account for more than 95% of the variance in the calibration. Such a parameter, in turn, was shown to be linearly dependent on temperature and provided a minimum thermal uncertainty below 1 °C. In short, the use of BW-III is a great solution to the problem recently presented by the scientific community, recovering the reliability of luminescent thermometers for bio-applications and the tri-doped CaF2 matrix with Yb3+, Tm3+ and Er3+ is a luminescent nanothermometer with high relative thermal sensitivity.Author contributions
A. C. C. Soares and T. O. Sales contributed to conceptualization, data curation, formal analysis, investigation, visualization, and writing the original draft. E. C. Ximendes was responsible for data curation, formal analysis, methodology, validation, and writing – review & editing. Daniel Jaque contributed to funding acquisition, methodology and writing – review & editing. C. Jacinto was responsible for project administration, resources, supervision, funding acquisition and writing – review & editing.Conflicts of interest
There are no conflicts to declare.Acknowledgements
We acknowledge the financial support from Brazilian Agencies: FINEP (Financiadora de Estudos e Projetos) through the grants INFRAPESQ-11 and INFRAPESQ-12 in using the Fluorometer NanoLog (Horiba) and Microscope LabRAM HR Evolution (Horiba); CNPq (Conselho Nacional de Desenvolvimento Científico e Tecnologico) through the scholarship in Research Productivity 1C under No. 304967/2018-1 (C. J.) and Doctoral scholarship (A. C. C. S.); CAPES (Coordenação de Aperfeiçoamento de Pessoal de Nível Superior) by means of the PNPD/CAPES postdoctoral scholarship (T. O. S.). This work was also financed by the Spanish Ministerio de Innovación y Ciencias under project NANONERV PID2019-106211RB-100. E. C. X. is grateful for a Juan de la Cierva Incorporación scholarship (IJC2020-045229-I).References
- W. J. Youden, Index for rating diagnostic tests, Cancer, 1950, 3, 32–35 CrossRef CAS PubMed.
- P. R. N. Childs, J. R. Greenwood and C. A. Long, Review of temperature measurement, Rev. Sci. Instrum., 2000, 71, 2959–2978 CrossRef CAS.
- L. C. Kennedy, et al., A New Era for Cancer Treatment: gold-Nanoparticle-Mediated Thermal Therapies, Small, 2011, 7, 169–183 CrossRef CAS PubMed.
- D. Jaque, et al., Nanoparticles for photothermal therapies, Nanoscale, 2014, 6, 9494–9530 RSC.
- B. del Rosal, et al., Neodymium-Based Stoichiometric Ultrasmall Nanoparticles for Multifunctional Deep-Tissue Photothermal Therapy, Adv. Opt. Mater., 2016, 4, 782–789 CrossRef CAS.
- D. Jaque and F. Vetrone, Luminescence nanothermometry, Nanoscale, 2012, 4, 4301 RSC.
- E. Carrasco, et al., Intratumoral Thermal Reading During Photo-Thermal Therapy by Multifunctional Fluorescent Nanoparticles, Adv. Funct. Mater., 2015, 25, 615–626 CrossRef CAS.
- E. C. Ximendes, et al., Unveiling in vivo Subcutaneous Thermal Dynamics by Infrared Luminescent Nanothermometers, Nano Lett., 2016, 16, 1695–1703 CrossRef CAS PubMed.
- E. C. Ximendes, et al., In vivo Ischemia Detection by Luminescent Nanothermometers, Adv. Healthcare Mater., 2017, 6, 1601195 CrossRef PubMed.
- H. D. A. Santos, et al., In vivo Early Tumor Detection and Diagnosis by Infrared Luminescence Transient Nanothermometry, Adv. Funct. Mater., 2018, 28, 1803924 CrossRef.
- D. Jaque, et al., Inorganic nanoparticles for optical bioimaging, Adv. Opt. Photonics, 2016, 8, 1–103 CrossRef.
- A. M. Smith, M. C. Mancini and S. Nie, Second window for in vivo imaging, Nat. Nanotechnol., 2009, 4, 710–711 CrossRef CAS PubMed.
- E. Hemmer, A. Benayas, F. Légaré and F. Vetrone, Exploiting the biological windows: current perspectives on fluorescent bioprobes emitting above 1000 nm, Nanoscale Horiz., 2016, 1, 168–184 RSC.
- B. del Rosal, I. Villa, D. Jaque and F. Sanz-Rodríguez, In vivo autofluorescence in the biological windows: the role of pigmentation, J. Biophotonics, 2016, 9, 1059–1067 CrossRef CAS PubMed.
- B. del Rosal, et al., Overcoming Autofluorescence: long-Lifetime Infrared Nanoparticles for Time-Gated in vivo Imaging, Adv. Mater., 2016, 28, 10188–10193 CrossRef CAS PubMed.
- I. Villa, et al., 1.3 μm emitting SrF2:Nd3+ nanoparticles for high contrast in vivo imaging in the second biological window, Nano Res., 2015, 8, 649–665 CrossRef CAS.
- D. Kobat, et al., Deep tissue multiphoton microscopy using longer wavelength excitation, Opt. Express, 2009, 17, 13354 CrossRef PubMed.
- B. del Rosal, I. Villa, D. Jaque and F. Sanz-Rodríguez, In vivo autofluorescence in the biological windows: the role of pigmentation, J. Biophotonics, 2016, 9, 1059–1067 CrossRef CAS PubMed.
- A. F. Pereira, J. F. Silva, A. S. Gouveia-Neto and C. Jacinto, 1.319 μm excited thulium doped nanoparticles for subtissue thermal sensing with deep penetration and high contrast imaging, Sens. Actuators, B, 2017, 238, 525–531 CrossRef CAS.
- J. Xu, D. Murata, J. Ueda, B. Viana and S. Tanabe, Toward Rechargeable Persistent Luminescence for the First and Third Biological Windows via Persistent Energy Transfer and Electron Trap Redistribution, Inorg. Chem., 2018, 57, 5194–5203 CrossRef CAS PubMed.
- E. C. Ximendes, et al., In vivo Subcutaneous Thermal Video Recording by Supersensitive Infrared Nanothermometers, Adv. Funct. Mater., 2017, 27, 1702249 CrossRef.
- M. Lin, et al., Facile synthesis of mono-disperse sub-20 nm NaY(WO4)2:Er3+,Yb3+ upconversion nanoparticles: a new choice for nanothermometry, J. Mater. Chem. C, 2019, 7, 2971–2977 RSC.
- F. Vetrone, et al., Temperature Sensing Using Fluorescent Nanothermometers, ACS Nano, 2010, 4, 3254–3258 CrossRef CAS PubMed.
- S. Zhou, et al., Strategy for thermometry via Tm3+-doped NaYF4 core–shell nanoparticles, Opt. Lett., 2014, 39, 6687 CrossRef CAS PubMed.
- A. Skripka, et al., Double rare-earth nanothermometer in aqueous media: opening the third optical transparency window to temperature sensing, Nanoscale, 2017, 9, 3079–3085 RSC.
- A. Zhang, et al., Simultaneous luminescence in I, II and III biological windows realized by using the energy transfer of Yb3+ → Er3+/Ho3+ → Cr3+, Chem. Eng. J., 2019, 365, 400–404 CrossRef CAS.
- K. Maciejewska, A. Bednarkiewicz and L. Marciniak, The influence of the Er3+ dopant concentration in LaPO4:Nd3+, Er3+ on thermometric properties of ratiometric and kinetic-based luminescent thermometers operating in NIR II and NIR III optical windows, Phys. B, 2021, 620, 413247 CrossRef CAS.
- M. Kamimura, Recent Progress of Near-Infrared Fluorescence in vivo Bioimaging in the Second and Third Biological Window, Anal. Sci., 2021, 37, 691–697 CrossRef CAS PubMed.
- J. Hu, et al., Quantum Dots Emitting in the Third Biological Window as Bimodal Contrast Agents for Cardiovascular Imaging, Adv. Funct. Mater., 2017, 27, 1703276 CrossRef.
- C. Hazra, A. Skripka, S. J. L. Ribeiro and F. Vetrone, Erbium Single-Band Nanothermometry in the Third Biological Imaging Window: Potential and Limitations, Adv. Opt. Mater., 2020, 8, 2001178 CrossRef CAS.
- M. Quintanilla, M. Henriksen-Lacey, C. Renero-Lecuna and L. M. Liz-Marzán, Challenges for optical nanothermometry in biological environments, Chem. Soc. Rev., 2022, 51, 4223–4242 RSC.
- V. B. Koman, et al., A wavelength-induced frequency filtering method for fluorescent nanosensors in vivo, Nat. Nanotechnol., 2022, 17, 643–652 CrossRef CAS PubMed.
- E. Ximendes, R. Marin, L. D. Carlos and D. Jaque, Less is more: dimensionality reduction as a general strategy for more precise luminescence thermometry, Light: Sci. Appl., 2022, 11, 237 CrossRef CAS PubMed.
- F. E. Maturi, et al., Going Above and Beyond: A Tenfold Gain in the Performance of Luminescence Thermometers Joining Multiparametric Sensing and Multiple Regression, Laser Photonics Rev., 2021, 15, 2100301 CrossRef CAS.
- Y. Shen, J. Lifante, N. Fernández, D. Jaque and E. Ximendes, In vivo Spectral Distortions of Infrared Luminescent Nanothermometers Compromise Their Reliability, ACS Nano, 2020, 14, 4122–4133 CrossRef CAS PubMed.
- A. Bednarkiewicz, L. Marciniak, L. D. Carlos and D. Jaque, Standardizing luminescence nanothermometry for biomedical applications, Nanoscale, 2020, 12, 14405–14421 RSC.
- Y. Shen, et al., Ag2S Nanoheaters with Multi parameter Sensing for Reliable Thermal Feedback during in vivo Tumor Therapy, Adv. Funct. Mater., 2020, 30, 2002730 CrossRef CAS.
- M. Tan, et al., Accurate in vivo Nanothermometry through NIR-II Lanthanide Luminescence Lifetime, Small, 2020, 16, 2004118 CrossRef CAS PubMed.
- J. Zhou, B. del Rosal, D. Jaque, S. Uchiyama and D. Jin, Advances and challenges for fluorescence nanothermometry, Nat. Methods, 2020, 17, 967–980 CrossRef CAS PubMed.
- L. A. Sordillo, Y. Pu, S. Pratavieira, Y. Budansky and R. R. Alfano, Deep optical imaging of tissue using the second and third near-infrared spectral windows, J. Biomed. Opt., 2014, 19, 056004 CrossRef PubMed.
- M. Runowski, et al., Sr2LuF7:Yb3+–Ho3+–Er3+ Upconverting Nanoparticles as Luminescent Thermometers in the First, Second and Third Biological Windows, ACS Appl. Nano Mater., 2020, 3, 6406–6415 CrossRef CAS.
- E. D. Onal and K. Guven, Plasmonic Photothermal Therapy in Third and Fourth Biological Windows, J. Phys. Chem. C, 2017, 121, 684–690 CrossRef CAS.
- S. Sekiyama, et al., Temperature Sensing of Deep Abdominal Region in Mice by Using Over-1000 nm Near-Infrared Luminescence of Rare-Earth-Doped NaYF4 Nanothermometer, Sci. Rep., 2018, 8, 16979 CrossRef PubMed.
- C. Hazra, A. Skripka, S. J. L. Ribeiro and F. Vetrone, Erbium Single-Band Nanothermometry in the Third Biological Imaging Window: Potential and Limitations, Adv. Opt. Mater., 2020, 8, 2001178 CrossRef CAS.
- S. Hao, et al., Heterogeneous core/shell fluoride nanocrystals with enhanced upconversion photoluminescence for in vivo bioimaging, Nanoscale, 2015, 7, 10775–10780 RSC.
- B. Ritter, T. Krahl, K. Rurack and E. Kemnitz, Nanoscale CaF2 doped with Eu3+ and Tb3+ through fluorolytic sol–gel synthesis, J. Mater. Chem. C, 2014, 2, 8607–8613 RSC.
- J. Ding, et al., Optical Spectra Properties and Continuous-Wave Laser Performance of Tm,Y:CaF2 Single Crystals, Int. J. Opt., 2018, 2018, 1–7 CrossRef.
- G. Lakshminarayana, R. Yang, M. Mao, J. Qiu and I. V. Kityk, Photoluminescence of Sm3+, Dy3+, and Tm3+-doped transparent glass ceramics containing CaF2 nanocrystals, J. Non-Cryst. Solids, 2009, 355, 2668–2673 CrossRef CAS.
- Y. Shen, J. Lifante, N. Fernández, D. Jaque and E. Ximendes, In vivo Spectral Distortions of Infrared Luminescent Nanothermometers Compromise Their Reliability, ACS Nano, 2020, 14, 4122–4133 CrossRef CAS PubMed.
- F. E. Maturi, et al., Going Above and Beyond: A Tenfold Gain in the Performance of Luminescence Thermometers Joining Multiparametric Sensing and Multiple Regression, Laser Photonics Rev., 2021, 15, 2100301 CrossRef CAS.
- S. L. Brunton and J. N. Kutz, Data-Driven Science and Engineering, Cambridge University Press, 2019, DOI:10.1017/9781108380690.
- S. L. Brunton and J. N. Kutz, Singular Value Decomposition (SVD), in Data-Driven Science and Engineering, Cambridge University Press, 2019, pp. 3–46, DOI:10.1017/9781108380690.002.
| This journal is © The Royal Society of Chemistry 2023 |

