Light interactions with supracrystals either deposited on a substrate or dispersed in water
Marie Paule
Pileni

Sorbonne Université, Chemistry Department, 4 Place Jussieu, 75005 Paris, France. E-mail: mppileni@orange.fr
First published on 29th May 2020
Abstract
Nanocrystals with low size distribution are able to self-assemble into a 3D crystalline structure called colloidal crystals or super/supracrystals. A rather large number of supracrystal specific properties have been achieved showing promising potential applications. Here, we compared intrinsic properties induced by light interacting with fcc supracrystals of hydrophobic metal nanocrystals either deposited on a substrate or dispersed in aqueous solution. We first describe the formation of a dried supracrystal film grown via a heterogeneous process with cracks formed due to the shrinking of the film caused by restriction of its adhesion on the surface. We also describe the method to fabricate hydrophobic supracrystals dispersed in aqueous solution. The optical properties of the thick dried supracrystal film are determined from the wetting layers formed at the bottom of the cracks whereas, for water dispersed suprastructures, both the collective optical photonic mode and absorption of dispersed nanocrystals used as build blocks are observed. Ag nanocrystals used as building blocks in a dried supracrystal film vibrate coherently as atoms in a nanocrystal. However, it is impossible to determine the oscillation period of the whole assembly. Conversely from a dynamic study, the breathing period of the assemblies dispersed in aqueous solution is found to be around 300 ps. Whatever experimental conditions, nanocrystals exposed to light breath coherently in a supracrystal. In aqueous solution, supracrystals behave as nanoheaters.
Introduction
Spontaneous self-assemblies are universally studied with building blocks from either atoms or nanomaterials. Similar to the crystalline growth at the atomic level, assemblies of colloidal crystals are as old as the Universe. Examples include assemblies of silicate particles resulting in the formation of opals which are characterized by their well-known specific reflectivity related to the size of segregated ordered particles.1 The changes in their optical properties are caused by the particles being ordered at the mesoscopic scale, leading to the emergence of specific properties.Artificial colloidal crystals, also called supracrystals, formed from spherical single component inorganic nanocrystals, coated with hydrophobic alkyl chains generate various crystalline structures (face centered cubic, fcc, hexagonal close packed, hcp and body centered cubic, bcc). Such crystalline structures are determined by minimizing the free energy F = U − TS of the system. Note that because the thermal energy is a constant, entropy, S, is the key parameter.2–19 Upon mixing nanocrystals with two different well-defined sizes, they self-assemble to form crystalline structures of different types such as NaCl, AlB2-NaZn13, etc.20–22
Supracrystals are a new generation of advanced materials exhibiting unique collective and intrinsic chemical (stability and nano-kinkerdall effect) and physical (optical, magnetic, mechanical, vibrational, crystal growth processes, etc.) properties, which differ from those of disordered aggregates or of isolated nanocrystals or of the bulk phase.6,8,9,11,14,21–29 These supracrystal properties make possible the exploration of a large variety of potential applications.
Here we compared the intrinsic properties induced by light interacting with fcc supracrystals of hydrophobic nanocrystals that are either deposited on a substrate or dispersed in aqueous solution.
Supracrystals of hydrophobic nanocrystals either deposited on a substrate or dispersed in aqueous solution
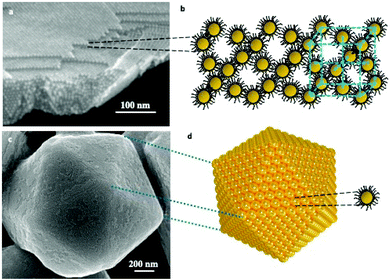
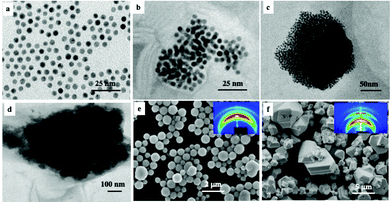
In order to self-assemble coated nanocrystals in crystalline structures, we need to produce nanocrystals with a size distribution of less than 10%. This compulsory condition is not unique. Several other parameters must be taken into account such as the coating agent used to keep the integrity of the nanocrystal, temperature, solvent vapor pressure, traces of water molecules, etc… All the parameters are related to the interactions between alkyl chains, solvent/alkyl chains and nanocrystals.Over the past two decades, a rather large number of methods have been developed to produce nanocrystals self-assembled in a crystalline structure such as atoms do in fcc, hcp, and bcc atomic crystals. Such assemblies are called supracrystals. Actually, two growth processes exist: the first one is heterogeneous growth in which the nanocrystals assemble layer by layer (Fig. 1a and b). The second one is a homogeneous growth process in which shaped supracrystals are formed in solution. In some cases, the supracrystal shapes are similar to those of single atomic crystals. Fig. 1c and d show a supracrystal with a five-fold symmetry icosahedrally terminated by the (111) planes corresponding to multiply twinned crystals.
Under zero solvent vapor pressure, the colloidal solution of nanocrystals is poured into a beaker with a silicon wafer at the bottom and deposited in a glovebox with a volume larger than that of the beaker. With a good solvent for the alkyl chains, at the end of the solvent evaporation, a liquid–gas transition30 takes place with the appearance of a lower phase highly concentrated in nanocrystals and a very dilute upper phase. At this stage, the nanocrystals are self-assembled in solution. At the end of the solvent evaporation, films of nanocrystals (Fig. 2) cover most of the substrate surface previously placed at the bottom of the container. The film thicknesses are controlled by the initial nanocrystal concentration used before evaporation. The average thickness evolves from a few dozen nanometers to a few micrometers. The film surface reveals some terraces with steps having various heights, with thickness ranging from one nanocrystal to several nanocrystals. The SAXS patterns show fcc crystalline ordering of nanocrystals.31
At the end of the solvent evaporation, the drying process induces shrinking of the film with the restriction of adhesion of the film to the surface consequently leading to crack formation. Fig. 3 shows crack patterns observed at various film thicknesses.
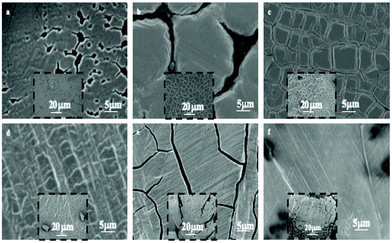 | ||
| Fig. 3 SEM images of supracrystal films of 8.2 nm Ag nanocrystals with various thicknesses. (a) 0.2–0.6 μm, (b) 0.4–1.0 μm, (c) 0.6–1.4 μm, (d) 0.9–1.6 μm, (e) 1–1.4 μm and (f) 1.3–1.9 μm. | ||
The geometries of different crack patterns are observed in a very large variety of materials, over a wide range of scales with specific scaling laws.32–38 In a previous study, we demonstrated that cracks of ferrite nanocrystal films follow a scaling law over three orders of magnitude indicating a universality of crack patterns independent of their dimensions.39,40
These cracks are observed by optical microscopy in transmission modes (Fig. 4). They form a network of channels separating islands (of a few tens of μm) of thick films. Light coming out of the channels is represented in blue while light from islands in red (no transmission is observed). In a previous work with ferrite nanocrystals the bottom of the cracks did not show any wetting layers of nanocrystals.39 In contrast, here by transmission microscopy (Fig. 4), we observe various color contrasts in the channels. This indicates the presence of nanocrystal layers at the bottom of the cracks. This could be due to the change in the nanocrystal size, materials and coating agents. Consequently, the blue and white colors in the crack channels demonstrate the presence of wetting layers at the bottom of each crack. Similar patterns are observed in the bright field reflection mode; cracks appear dark due to the diffraction of light at the film edges (not shown here). The loss of uniformity in the transmission mode clearly indicates the presence of several wetting layers at the bottom of the cracks.
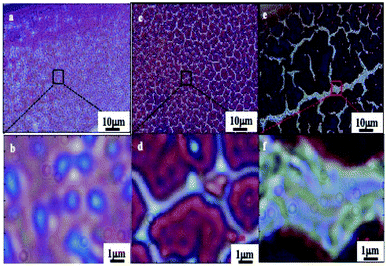 | ||
| Fig. 4 Optical micrographs of the 0.2–0.6 μm supracrystal film, in the transmission mode. (a and b), 0.4–1.0 μm (c and d) and 1.0–1.4 μm (e and f). | ||
To produce water dispersive “clustered” structures28,29 from hydrophobic Au nanocrystals, we need to build up an “organic molecular parachute”. For this purpose, we use two concepts:
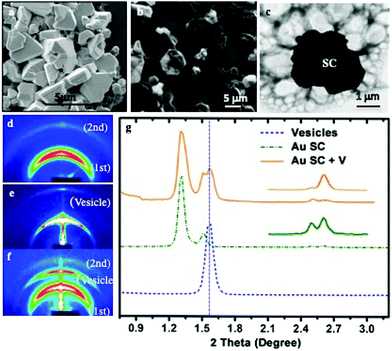
(i) Bad solvents for the coating agents: shaped supracrystals of 5 nm Au nanocrystals coated with octadecanethiol are produced by controlling the colloidal crystal growth process: addition of traces of a non-solvent such as ethanol to an Au colloidal solution which is subjected to solvent saturation induces a marked increase in the attractive interactions between nanocrystals and consequently results in a homogeneous growth process.17 The SEM images of the collected Au precipitates (Fig. 5a) show the formation of well-defined aggregates of various shapes and a rather large size distribution. Most of these shaped aggregates are characterized by a flat surface with well-defined facets in hexagonal symmetry, while others present some defects but no cracks are observed. The SAXS experiments show the formation of fcc Au supracrystals.
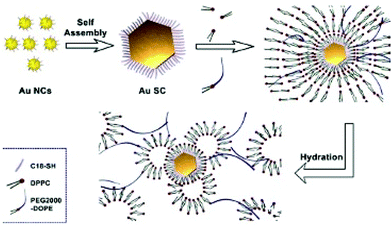
(ii) Interdigitation processes and formation of multi-walled structures: For this purpose, we use the concept developed several years ago, to produce thermodynamically stable assemblies of surfactant molecules to build up supra-aggregates:1 The best interdigitation process is obtained with long tail surfactant molecules and a head group with a large surface area.41,42 Because voids are energetically unfavorable, dipalmitoylphosphatidylcholine (DPPC) alkyl chains and the C18 chains of PEG-2000-DOPE fill them up. This induces strong interactions between DPPC, PEG-2000-DOPE and nanocrystals coated with C18 H37SH. The hydrophibic part of PEG2000-DOPE makes bridges from one vesicle to another and consequently plays the role of “parachutes” avoiding the effect of gravity.
The SEM (Fig. 5b) and the corresponding TEM (Fig. 5c) images reveal the structure of individual composites, showing the presence of large vesicles attached to the supracrystal surface and drape-like structures linked to the supracrystal.
Hence, shaped Au supracrystals of 5 nm nanocrystals are associated via interdigitations between the alkyl chain (C18H37-SH) used to coat nanocrystals, the biological surfactant such as DPPC and PEG-2000-DOPE characterized by both long alkyl chains and polar chain favouring hydrogen bonding. This is represented by the cartoon shown in Fig. 6.
Structural studies were performed by SAXS measurements before (Fig. 5d) and after (Fig. 5f) DPPC/DOPE treatment. The supracrystal pattern (Fig. 5d) is attributed to the diffraction of related planes of supracrystals with an edge-to-edge interparticle distance of 2.8 nm. The pattern corresponding to the supracrystal-vesicle composite shows well-defined rings (Fig. 5f). The new ring appearing in the diffraction pattern is attributed to the presence of vesicles. To support such a statement, a blank experiment is performed, in the absence of supracrystals, with DPPC/PEG-DOPE molecules. After hydration, the solution is dried and the SAXS pattern (Fig. 5e) shows a strong signal due to the diffraction of periodic vesicle bilayers. The calculated bilayer distance is 5.7 nm, which agrees with the thickness of the liposome shell.43 The profile (Fig. 5g) clearly shows that the diffraction peaks of the composite are a combination of the peaks of isolated Au supracrystals and of vesicles indicating that the DPPC/PEG2000-PE vesicles strongly interact with Au supracrystals. Similar data are obtained with Co instead of Au nanocrystals.
Optical properties of Ag supracrystals31,44
Let us consider dried thin fcc supracrystalline films (less than 7 layers) of Ag nanocrystals coated with oleic acid, differing in their sizes, deposited on a substrate. Their optical properties are compared to those of the nanocrystal dispersed in toluene.On increasing nanocrystal size, the Localized Surface Plasmon Resonance (LSPR) peaks are shifted toward high energy when the nanocrystals are dispersed in solution whereas to lower energy when they are self-assembled in 3D superlattices (Fig. 7). This is attributed to dipolar interactions between nanocrystals.11,23,45
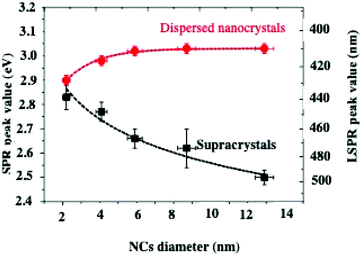 | ||
| Fig. 7 LSPR peak position values of dispersed nanocrystals (red dots) and corresponding supracrystalline films (black squares) as a function of the nanocrystal diameter. | ||
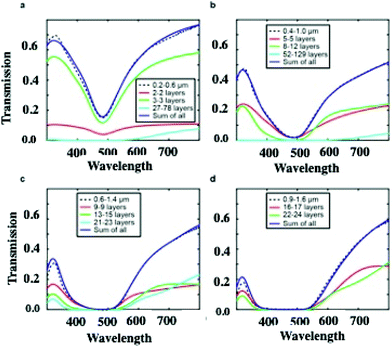
On increasing the number of nanocrystal layers, the LSPR spectra should reach saturation, which explains why most of the optical properties of supracrystals were investigated for less than ten layers.23,26,45–50 One attempt, in the limit of the Beer–Lambert law, was performed on supracrystals having 30 to 35 layers.50 The homogeneous films iLSPR spectra are calculated, by using Effective Medium Theory (EMT), without features on their surfaces. Such calculations, performed from thicknesses from 28 to 180 nanocrystal layers, take into account the crystalline structure of the film (fcc) with 8.2 nm, 2.8 nm and 0.3 as the average nanocrystal diameter, nanocrystal interparticle distance and filling factor respectively. The calculated LSPR spectra of the homogeneous supracrystal films (flat surface) reach saturation in the wavelength range from 300 nm to 550 nm. At larger wavelength, the transmission intensity through the supracrystal films decreases with increasing film thickness and a wider linewidth is observed. Fig. 8 shows transmission spectra of films with different thicknesses. For fcc supracrystal films formed by 27 to 78 layers, a direct measurement of absorption, reflection, and transmission is still possible (Fig. 8a). By increasing the number of layers from 27 to 180, the transmission spectra of the Ag supracrystal film (Fig. 8a–d, dashed line) reveal a decrease in the transmission with an increase in the notch full-width at half maximum (FWHM) as the film thickness increases. Hence the calculated spectra totally disagree with the experimental data.
According to the optical micrographs in the transmission mode shown in Fig. 4, we assumed the presence of a wetting layer of nanocrystals with a constant thickness at the bottom of each crack. Unfortunately, the experimental and the calculated spectra do not agree. This could be attributed to the uniform thickness assumed in the calculation. This is supported by the fact that Fig. 4 shows some inhomogeneity in the transmission inside the channels. In the calculations, we have to assume presence of steps with various thickness at the bottom of each crack. In the total transmission calculation, the thickness and the weighted sum of the transmissions of each zone are the two free parameters taken into account. Fig. 8 reveals the excellent agreement between calculations accounting for the cracks and experiments for films of various thicknesses (0.2–0.6 μm, 0.4–1 μm, 0.6–1.4 μm, and 0.9–1.6 μm). The solid red, green, and cyan lines represent the transmission spectra of different wetting layers that are introduced into the cracks for each film. The blue trace is the sum of all coloured lines.
From these data, we conclude that cracks dominate the optical response of the films of different thicknesses. Wetting layers with different thicknesses, at the bottom of the cracks, explain the optical properties observed with thick fcc films of Ag nanocrystals with a large number of layers. From these data it seems impossible, with dried fcc supracrystals, to observe any collective optical modes.
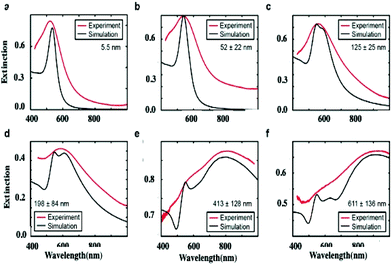
Instead of studying the optical properties of dried fcc supracrystals of 5 nm Ag nanocrystals deposited on a substrate, let us consider fcc supracrystals dispersed in aqueous solution. Here we study supracrystals of 5.5 nm Au nanocrystals.29 On controlling the nucleation and growth times, it is possible to produce either aggregates or supracrystals differing in their sizes from 52 nm to 600 nm. These aggregates and/or supracrystals, dispersed in aqueous solution, are characterized by a rather large size distribution when that in the building blocks is low (<6%). Note that for small aggregates (Fig. 9b–d), the Au nanocrystal assemblies are not well ordered. In contrast, the largest aggregates (Fig. 9e and f) are fcc supracrystals (413 nm and 611 nm). The assembly size distribution is obtained from TEM or SEM images of almost 100 aggregates.
The absorption spectra of the assemblies of 5 nm Au nanocrystals differing in their sizes, shown in Fig. 9, are red shifted on increasing their diameters with a shoulder around 530 nm (Fig. 10).
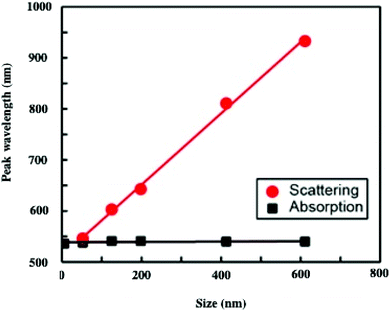
To explain such a large difference in the absorption spectra with aggregate size, we need simulations. To do this, we first calculate the effective dielectric function of Au assemblies by using Maxwell–Garnett effective medium theory (EMT).51 Then Mie theory is used to calculate the spectral response of Au assemblies dispersed in water. The distribution over the size of assemblies is deduced from SEM images and accounted for in our calculations. Fig. 10 shows that the experimental spectra, recorded at various aggregate sizes, agree reasonably with the calculated ones. Hence, the calculated absorption spectra are decomposed into two well-defined spectra: at high energy, the absorption spectrum is well resolved with a rather small bandwidth whereas the spectrum at low energy is very broad. This is observed irrespective of the aggregate size. However, on increasing the aggregate size, the high energy peak remains constant with the maximum spectrum centred at 530 nm. Conversely, the spectrum at low energy is red-shifted on increasing the aggregate size. Although the size distribution is rather large, the maximum of the calculated broad peak linearly depends on the aggregate size (Fig. 11). From the unchanged position of the high energy peak in the assemblies compared to dispersed Au nanocrystals in aqueous solution (Fig. 10a and 11a), we conclude that the peak centred at 530 nm is due to Localized Surface Plasmon Resonance (LSPR) of 5 nm Au nanocrystals. This clearly indicates that the LSPR of isolated nanocrystals is retained when they are self-assembled either in small aggregates or in fcc supracrystals. Hence the fingerprint of nanocrystals in supracrystals is retained. The linear dependence of the broad second peak on the aggregate size indicates that the shift toward low energy is due to the aggregate size. Consequently, it can be attributed to collective modes due to the assemblies. However, we note that with a small assembly size, Au nanocrystals are closed together and not assembled in crystalline structures whereas the larger ones (413 nm and 611 nm) are fcc supracrystals. From Fig. 11 no disruption is observed between data obtained with slightly disordered aggregates and the supracrystals. This permits the assumption that such a change in the peak position at low energy is due to dipolar interactions between nanocrystals. Hence, here we claim that nanocrystals close together induce collective modes when they are dispersed in aqueous solution.
To conclude, Au nanocrystals assembled in aggregates or in supracrystals dispersed in water show a fingerprint of isolated nanocrystals and collective modes whereas with Ag nanocrystals self-assembled in fcc supracrystals deposited on a substrate (dried system) such behaviours cannot be observed.44
Breathing mode process
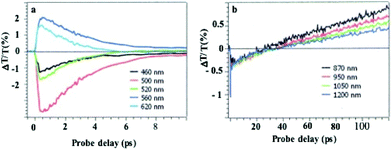
In dried systems, as already mentioned, the substrate temperature controls the ordering of nanocrystals. Hence, by increasing the substrate temperature from 10 °C to 25 °C, the Ag nanocrystal ordering evolves from disordered films considered as amorphous to small fcc supracrystals and finally to long-range Ag fcc supracrystals. The Stokes–anti Stokes Raman spectra, characterized by the quadrupolar modes, of the amorphous film behave as the Raman spectrum of a collection of nanocrystals,52 indicating a good agreement between the amorphous film of Ag nanocrystals deposited on a substrate and a collection of the same nanocrystals dispersed in solution. With both “large and small” fcc supracrystals, a shift to low frequencies compared to the amorphous film is observed and is attributed to the Lorentz field effect. The major difference between the two types of supracrystals (small and large ones) concerns the width of the quadrupolar lines. With “large” supracrystals, they are perfectly superimposed on those of the amorphous film whereas with “small” supracrystals (size λ ≤ λ/10 where λ is the wavelength of the incident line) the quadrupolar lines are narrower than those of amorphous films. Such changes in the Raman scattering spectra were attributed to nanocrystals vibrating coherently in a supracrystal.24 In conclusion, nanocrystals do not move and vibrate at fixed positions. This claim was supported by mathematical calculation from which the “small” supracrystal Raman intensity is proportional to the square of intensity of its corresponding amorphous film. These data clearly indicated inter-nanocrystal coherence inside fcc supracrystals.Let us consider the water dispersed Au “clustered” structure with an average size of 196 ± 86 nm (around 14 layers) characterized by a large peak centred at around 700 nm (Fig. 10b). The energy flow upon light irradiation is investigated by pump–probe experiments. At long-time scales, the differential transmission (ΔT/T) spectra were investigated by pump–probe experiments and recorded as a function of time and of the probe wavelength (λ), and a mechanical oscillation period is observed (Fig. 12). This period, attributed to the breathing mode of the whole assembly, is around 300 ps.53 The calculated period is given by T = 2D/vs where D is the average diameter (198 nm ± 84 nm) of the assembly and vs is the speed of sound inside the supracrystal. By using the same technique, we observed coherent longitudinal acoustic phonons in small Co supracrystals of 7.1 nm Co nanocrystals used as building blocks.54 These experiments allowed the estimation of, at room temperature, the speed of sound in the supracrystal to be 1235 ± 12 m s−1. If we assume that the speed of sound remains the same in Au supracrystals as compared to Co supracrystals, the resulting oscillation period of the Au “clustered” structure is 236 ± 77 ps, which is consistent with experimental data. These results provide a clear indication from which the coherent vibration of nanocrystals in a supracrystal can be directly observed by using water soluble hybrids whereas an indirect process is needed for dried supracrystals.
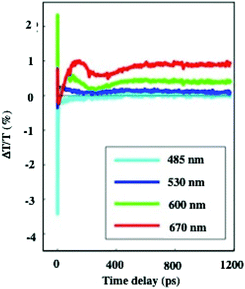 | ||
| Fig. 12 Dynamics of the ΔT/T at selected probe wavelengths, on nanometer time scales of energy flow in the Au clustered structures. | ||
Nanoheater
Let us consider dried Au supracrystals deposited on a substrate. Time-resolved differential transmission (ΔT/T) obtained by the femtosecond pump–probe technique shows the breathing mode (l = 0) of nanocrystals. The decay reaches zero at around 10 ps (Fig. 13). No other transient is observed.53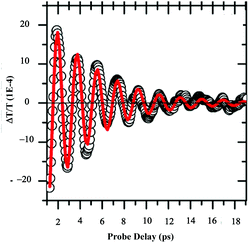 | ||
| Fig. 13 ΔT/T time traces extracted from 2D maps at selected wavelength λπrobe = 560 nm for 10.6 nm Au nanocrystals. | ||
By using the same Au “clustered” structures as described above (196 nm, Fig. 10d), at the initial time scale of ten picoseconds, the typical ΔT/T map is attributed to the transient spectra of isolated NCs at various probe wavelengths. They are dominated by the shift and broadening of the plasmonic resonances as observed previously.54 These spectra exhibit a decay constant of few picoseconds (Fig. 14a), corresponding to the timescale of electron–phonon scattering in noble metals55,56 indicating that the fingerprint of dispersed nanocrystals used as building blocks is maintained. Similar decay was observed for supracrystals deposited on a substrate (dried system), Fig. 13
At longer time scales, the ΔT/T map of Au “clustered” structures (Fig. 14b) exhibits very distinct features which, to the best of our knowledge, have not been reported for any nanostructures: instead of a monotonic decrease over time, we observed the build-up of a positive signal which is red shifted by about 100 nm compared to early spectra. At the nanosecond time scale, after the build-up attributed to the fingerprint of mechanical oscillation, the signal remains constant as shown in Fig. 12. To explain the origin of such an unexpected transient optical response at the 100 ps timescale, the remaining constant at the nanosecond time scale, a model based on the large penetration depth of visible light in the supracrystal structure is proposed to simulate the optical experiments.57 The power absorbed per unit volume, for an excitation wavelength of 400 nm, is more uniform than that in the Au nanocrystal structure of the same diameter. The light absorption initiates a chain of energy transfer processes. The coating agent used to coat the nanocrystals, even though not directly absorbing, acts as an internal reservoir for efficient accumulation of energy within few hundred picoseconds. The very good agreement between experiments and the model confirms a collective regime of photo-temperature generation enabled by the assembly process.
Conclusions
Here, we pointed out that the specific intrinsic properties induced by light markedly depend on the supracrystal environment. We compare the interactions of light with supracrystals of hydrophobic metal nanomaterials when they are either deposited on a substrate or dispersed in aqueous solution.Collective photonic modes are observed when supracrystals are dispersed in aqueous solution (Au “clustered” structures) whereas, in dried supracrystals, the optical properties are governed by cracks through the wetting layers present in the substrate. This clearly shows the influence of the environment on the intrinsic properties. Note that no cracks are observed when shaped supracrystals are dispersed in aqueous solution.
Coherent breathing modes of nanocrystals in supracrystals are observed under both conditions. However, the period can only be evaluated by a good agreement between the measured and calculated periods whereas with dried supracrystals it cannot be measured directly and is supported by calculation. Note that such breathing modes could explain the data obtained previously, at low temperature, by scanning tunneling microscopy/scanning tunneling spectroscopy (STM/STS) obtained for Au supracrystals deposited on a substrate. It has been possible to image and measure the electronic properties of the supracrystals with thicknesses of several micrometers. Usually no tunneling effect can be obtained with such a thick material. However, if we assume that the supracrystals are subjected to current, the nanocrystals could breathe coherently favoring the pathway for electrons from the tip to the substrate.
In aqueous solution, we show that the hybrid structures behave as nanoheaters, whereas it is not observed in dried supracrystals.
Conflicts of interest
There are no conflicts of interest.Acknowledgements
MPP thanks Prs G. Cerullo, G. DelLa Valle, J. L. Pelouard, J. Wei, N. Yang, and Z. Yang.References
- J. V. Sanders, Color of Precious Opal, Nature, 1964, 204, 1151–1153 CrossRef.
- L. Motte, F. Billoudet and M. P. Pileni, Self-Assembled Monolayer of Nanosized Particles Differing by Their Sizes, J. Phys. Chem., 1995, 99, 16425–16429 CrossRef CAS.
- C. B. Murray, C. R. Kagan and M. G. Bawendi, Self-Organization of CdSe Nanocrystallites into Three-Dimensional Quantum Dot Superlattices, Science, 1995, 270, 1335–1338 CrossRef CAS.
- R. L. Whetten, M. N. Shafigullin, J. T. Khoury, T. G. Schaaff, J. Vezmar, M. M. Alvarez and A. Wilkinson, Crystal Structures of Molecular Gold Nanocrystal Arrays, Acc. Chem. Res., 1999, 32, 397–406 CrossRef CAS.
- B. A. Korgel, S. Fullam, S. Connolly and D. J. Fitzmaurice, Assembly and, Self-Organization of Silver Nanocrystal Superlattices: Ordered “Soft Spheres”, J. Phys. Chem. B, 1998, 102, 8379–8388 CrossRef CAS.
- M. P. Pileni, Nanocrystals self-assemblies: fabrication and collective properties, J. Phys. Chem., 2001, 105, 3358–3372 CrossRef CAS.
- O. C. Compton and F. E. Osterloh, Evolution of Size and Shape in the Colloidal Crystallization of Gold Nanoparticles, J. Am. Chem. Soc., 2007, 129, 7793–7798 CrossRef CAS PubMed.
- M. P. Pileni, Acc. Chem. Res., 2007, 40, 685–693 CrossRef CAS PubMed.
- A. I. Henry, A. Courty, M. P. Pileni, P. A. Albouy and J. Israelachvili, Nano Lett., 2008, 8, 2000–2005 CrossRef CAS PubMed.
- M. I. Bodnarchuk, M. V. Kovalenko, H. Groiss, R. Resel, M. Reissner, G. Hesser, R. T. Lechner, W. Steiner, F. Schaeffler and W. Heiss, Small, 2009, 5, 2247–2252 CrossRef CAS PubMed.
- P. Podsiadlo, B. Lee, V. B. Prakapenka, G. V. Krylova, R. D. Schaller, A. Demortière and E. V. Shevchenko, Nano Lett., 2011, 11, 579–588 CrossRef CAS PubMed.
- S. M. Rupich, E. V. Shevchenko, M. I. Bodnarchuk, B. Lee and D. V. Talapin, Size-Dependent Multiple Twinning in Nanocrystal Superlattices, J. Am. Chem. Soc., 2010, 132, 289–296 CrossRef CAS PubMed.
- J. Biais, L. Odberg and P. Stenius, Thermodynamic properties of microemulsions: Pseudophase equilibrium—Vapor pressure measurements, J. Colloid Interface Sci., 1982, 86, 350–358 CrossRef CAS.
- M. P. Pileni, Self-assembly of inorganic nanocrystals: Fabrication and collective intrinsic properties, Acc. Chem. Res., 2012, 45, 1965–1972 CrossRef CAS PubMed.
- M. Bergström, E. V. Sturm, G. Salazar-Alvarez and H. Cölfen, Mesocrystals in Biominerals and Colloidal Arrays, Acc. Chem. Res., 2015, 48, 1391–1402 CrossRef PubMed.
- C. Wang, C. Siu, C. J. Zhang and J. Fang, Understanding the Forces Acting in Self-Assembly and the Implications for Constructing Three-Dimensional (3D) Supercrystals, Nano Res., 2015, 8, 2445–2466 CrossRef CAS.
- M. A. Boles, M. Engel and D. V. Talapin, Self-Assembly of Colloidal Nanocrystals: From Intricate Structures to Functional Materials, Chem. Rev., 2016, 116, 11220–11289 CrossRef CAS PubMed.
- D. Haubold, A. Weiz, L. Borchardt, C. Ziegler, L. Bahrid, S. Kaskel, M. Ruck and A. Eychmuller, The Formation and, Morphology of Nanoparticle Supracrystals, Adv. Funct. Mater., 2016, 26, 4890 CrossRef CAS.
- E. V. Shevchenko, D. V. Talapin, S. O'brien and C. B. Murray, Polymorphism In AB13 Nanoparticle Superlattices: An Example Of Semiconductor–Metal Metamaterials, J. Am. Chem. Soc., 2005, 127, 8741–8747 CrossRef CAS PubMed.
- E. V. Shevchenko, D. V. Talapin and N. A. Kotov, Structural diversity in binary nanoparticle superlattices, Nature, 2006, 439, 55–58 CrossRef CAS PubMed.
- Z. Yang, J. Wei, P. Bonville and M. P. Pileni, Beyond Entropy: Magnetic Forces Induce Formation of Quasicrystalline Structure in Binary Nanocrystal Superlattices, J. Am. Chem. Soc., 2015, 137, 4487–4493 CrossRef CAS PubMed.
- Z. Yang, N. Yang, J. Bergstromand and M. P. Pileni, Control of the oxygen and cobalt atoms diffusion through Co nanoparticles differing by their crystalline structure and size, Adv. Funct. Mater., 2015, 25, 891–897 CrossRef CAS.
- A. Taleb, C. Petit and M. P. Pileni, Synthesis of highly monodisperse silver nanonarticles from AOT reverse micelles: a way to 2D and 3D self-organization, Chem. Mater., 1997, 9, 950 CrossRef CAS.
- A. Courty, A. Mermet, P. A. Albouy, E. Duval and M. P. Pileni, Self-organized Ag-nanocrystals in fcc “supra” crystals: Vibrational Coherence, Nat. Mater., 2005, 4, 395–398 CrossRef CAS PubMed.
- N. Zaitseva, D. Z. Rong, F. R. Leon and D. Krol, Optical Properties of CdSe Superlattices, J. Am. Chem. Soc., 2005, 127, 10221–10226 CrossRef CAS PubMed.
- A. R. Tao, D. P. Ceperley, P. Sinsermsuksakul, A. R. Neureuther and P. Yang, Self-Organized Silver Nanoparticles for Three-Dimensional Plasmonic Crystals, Nano Lett., 2008, 8, 4033–4038 CrossRef CAS PubMed.
- X. Ling, N. Schaeffer, S. Roland and M. P. Pileni, Superior Oxygen Stability of N-Heterocyclic Carbene-coated Au Nanocrystals – Comparison with Dodecanethiol, Langmuir, 2015, 31, 12873–12882 CrossRef CAS PubMed.
- N. Yang, Z. Yang, M. Held, P. Bonville, P. A. Albouy, R. Lévy and M. P. Pileni, Dispersion of Hydrophobic Co Supracrystal in Aqueous Solution, ACS Nano, 2016, 10, 2277–2286 CrossRef CAS PubMed.
- N. Yang, C. Deeb, J. L. Pelouard, N. Felidj and M. P. Pileni, Water-Dispersed Hydrophobic Au Nanocrystal Assemblies with a Plasmon Fingerprint, ACS Nano, 2017, 11, 7797–7806 CrossRef CAS PubMed.
- V. Germain and M. P. Pileni, Size distribution of cobalt nanocrystals: A key parameter in formation of columns and labyrinths in mesoscopic structure, Adv. Mater., 2005, 17, 1424–1429 CrossRef CAS.
- J. Wei, N. Schaeffer, P. A. Albouy and M. P. Pileni, Surface Plasmon Resonance Properties of Silver Nanocrystals Differing in Size and Coating Agent Ordered in 3D Supracrystals, Chem. Mater., 2015, 27, 5614–5621 CrossRef CAS.
- C. Allain and L. Limat, Regular Patterns of Cracks Formed by Directional Drying of A Colloidal Suspension, Phys. Rev. Lett., 1995, 74, 2981–2984 CrossRef CAS PubMed.
- K. A. Shorlin, J. R. de Bruyn, M. Graham and S. W. Morris, Development and Geometry of Isotropic and Directional Shrinkage-Crack Patterns, Phys. Rev. E: Stat. Phys., Plasmas, Fluids, Relat. Interdiscip. Top., 2000, 61, 6950–6957 CrossRef CAS PubMed.
- E. R. Dufresne, E. I. Corwin and N. A. Greenblatt, Flow and Fracture in Drying Nanoparticle Suspensions, Phys. Rev. Lett., 2003, 91, 224501 CrossRef CAS PubMed.
- M. Heinrich, P. Gruber, S. Orso, U. A. Handge and R. Spolenak, Dimensional Control of Brittle Nanoplatelets. A Statistical Analysis of a Thin Film Cracking, Nano Lett., 2006, 6, 2026–2030 CrossRef CAS PubMed.
- A. Groisman and E. Kaplan, An Experimental Study of Cracking Induced by Desiccation, Europhys. Lett., 1994, 25, 415–420 CrossRef CAS.
- T. S. Komatsu and S. Sasa, Pattern Selection of Cracks in Directionally Drying Fracture, J. Appl. Phys., 1997, 36, 391–395 CrossRef CAS.
- K. T. Leung and Z. Néda, Pattern Formation and Selection in Quasistatic Fracture, Phys. Rev. Lett., 2000, 85, 662–665 CrossRef CAS PubMed.
- A. T. Ngo, J. Richardi and M. P. Pileni, Cracks in Magnetic Nanocrystal Films: Do Directional and Isotropic Crack Patterns Follow the Same Scaling Law?, Nano Lett., 2008, 8, 2485–2489 CrossRef CAS PubMed.
- A. T. Ngo, J. Richardi and M. P. Pileni, Crack Patterns in Superlattices Made of Maghemite Nanocrystals, Phys. Chem. Chem. Phys., 2013, 15, 10666–10672 RSC.
- I. Lisiecki, P. André, A. Filankembo, C. Petit, J. Tanori, T. Gulik-Krzywicki, B. W. Ninhamand and M. P. Pileni, Mesostructured Fluids, J. Phys. Chem., 1999, 103, 9176–8189 CrossRef CAS . and 9168–9175.
- M. Kranenburg, M. Veturoli and B. Smit, Phase Behavior and Induced Interdigitation in Bilayers Studied with Dissipative Particle Dynamics, Russ. J. Phys. Chem. B, 2003, 107, 11491–11501 CrossRef CAS.
- J. F. Nagle and S. Tristram-Nagle, Structure of Lipid Bilayers, Biochim. Biophys. Acta, Rev. Biomembr., 2000, 1469, 159–195 CrossRef CAS.
- J. Wei, C. Deeb, J. L. Pelouard and M. P. Pileni, Influence of Cracks on the Optical Properties of Silver Nanocrystals Supracrystal Films, ACS Nano, 2019, 13, 573–581 CrossRef CAS PubMed.
- K. L. Young, M. B. Ross, M. G. Blaber, M. Rycenga, M. R. Jones, C. Zhang, A. J. Senesi, B. Lee, G. C. Schatz and C. A. Mirkin, Using DNA to Design Plasmonic Metamaterials with Tunable Optical Properties, Adv. Mater., 2014, 26, 653–659 CrossRef CAS.
- M. B. Ross, J. C. Ku, V. M. Vaccarezza, G. C. Schatz and C. A. Mirkin, Nat. Nanotechnol., 2015, 10, 453–458 CrossRef CAS PubMed.
- M. N. O'Brien, H. X. Lin, M. Girard, M. O. de la Cruz and C. A. Mirkin, Programming Colloidal Crystal Habit with Anisotropic Nanoparticle Building Blocks and DNA Bonds, J. Am. Chem. Soc., 2016, 138, 14562–14565 CrossRef PubMed.
- J. A. Mason, C. R. Laramy, C. T. Lai, M. N. O'Brien, Q. Y. Lin, V. P. Dravid, G. C. Schatz and C. A. Mirkin, Contraction and Expansion of Stimuli-Responsive DNA Bonds in Flexible Colloidal Crystals, J. Am. Chem. Soc., 2016, 138, 8722–8725 CrossRef CAS PubMed.
- D. J. Park, C. Zhang, J. C. Ku, Y. Zhou, G. C. Schatz and C. A. Mirkin, Plasmonic photonic crystals realized through DNA-programmable assembly, Proc. Natl. Acad. Sci. U. S. A., 2015, 112, 977–981 CrossRef CAS PubMed.
- P. Aubertin, M. A. Ben Aissa, N. Raouafi, S. Joiret, A. Courty and E. Maisonhaute, Optical Response and Sers Properties of Individual Large Scale Supracrystals Made of Small Silver Nanocrystals, Nano Res., 2015, 8, 1615–1626 CrossRef CAS.
- D. E. Aspnes, Local-Field Effects and, Effective-Medium Theory: A Microscopic Perspective, Am. J. Phys., 1982, 50, 704–709 CrossRef.
- E. Duval, H. Portales, L. Saviot, M. Fujii, K. Sumitomo and S. Hayashi, Spatial Coherence Effect on the Low-Frequency Raman Scattering from Metallic Nanoclusters, Phys. Rev. B: Condens. Matter Mater. Phys., 2001, 63, 075405 CrossRef.
- A. Mazzanti, Z. Yang, M. G. Silva, N. Yang, G. Rizza, P. E. Coulon, C. Manzoni, A. M. de Paula, G. Cerullo, G. Della Valle and M. P. Pileni, Light–heat conversion dynamics in highly diversified water-dispersed hydrophobic nanocrystal assemblies, Proc. Natl. Acad. Sci. U. S. A., 2019, 116, 8161–8166 CrossRef CAS PubMed.
- I. Lisiecki, D. Polli, C. Yan, G. Soavi, E. Duval, G. Cerullo and M. P. Pileni, Coherent Longitudinal Acoustic Phonons in Three-Dimensional Supracrystals of Cobalt Nanocrystals, Nano Lett., 2013, 13, 4914–4919 CrossRef CAS PubMed.
- N. Goubet, C. Yan, D. Polli, H. Portalès, I. Arfaoui, G. Cerullo and M. P. Pileni, Size and, nanocrystallinity controlled gold nanocrystals: synthesis, electronic and mechanical properties, Nano Lett., 2013, 13, 504–508 CrossRef CAS PubMed.
- M. G. Silva, et al., Universal saturation behavior in the transient optical response of plasmonic structures, Phys. Rev. B, 2018, 98, 115407 CrossRef CAS.
- C. K. Sun, F. Vallée, L. Acioli, E. Ippen and J. Fujimoto, Femtosecond-tunable measurement of electron thermalization in gold, Phys. Rev. B: Condens. Matter Mater. Phys., 1994, 50, 15337–13342 CrossRef CAS.
| This journal is © the Partner Organisations 2020 |


![[thin space (1/6-em)]](https://www.rsc.org/images/entities/char_2009.gif) 028 h factor and citations, respectively.
028 h factor and citations, respectively.