Urine-based liquid biopsy: non-invasive and sensitive AR-V7 detection in urinary EVs from patients with prostate cancer†
Hyun-Kyung
Woo‡
 ab,
Juhee
Park‡
b,
Ja Yoon
Ku
c,
Chan Ho
Lee
d,
Vijaya
Sunkara
b,
Hong Koo
Ha
*c and
Yoon-Kyoung
Cho
 *ab
*ab
aDepartment of Biomedical Engineering, School of Life Sciences, Ulsan National Institute of Science and Technology (UNIST), Ulsan 44919, Republic of Korea. E-mail: ykcho@unist.ac.kr
bCenter for Soft and Living Matter, Institute for Basic Science (IBS), Ulsan 44919, Republic of Korea
cDepartment of Urology, Pusan National University Hospital, Pusan National University School of Medicine, Busan 49241, Republic of Korea. E-mail: hongkooha@pusan.ac.kr
dDepartment of Urology, Inje University Busan Paik Hospital, Busan 47392, Republic of Korea
First published on 27th November 2018
Abstract
Androgen-receptor splice variant 7 (AR-V7) is associated with castration-resistant prostate cancer (CRPC) and resistance to anti-androgen therapy. Despite its clinical importance, the lack of efficient methods for AR-V7 analysis remains a challenge for broader use of this biomarker in routine clinical practice. Herein, we suggest a practical and non-invasive liquid biopsy method for analysis of AR-V7 in the RNA of urine-derived extracellular vesicles (EVs) without the need for blood withdrawal. Urine-derived EVs were isolated by a lab-on-a-disc integrated with six independent nanofiltration units (Exo-Hexa) allowing simultaneous processing of six individual samples. Rapid enrichment of EVs (<30 min) from each 4 mL urine sample was followed by mRNA extraction, and AR-V7 and androgen receptor full-length (AR-FL) mRNA levels in the urinary EVs were quantified by droplet digital polymerase chain reaction (ddPCR) as absolute concentrations (copies per mL). Higher AR-V7 and lower AR-FL expressions were detected in urine-derived EVs from 14 patients with CRPC than in those from 22 patients with hormone-sensitive prostate cancer. Additionally, we found that AR-V7 transcript levels and the AR-V7/AR-FL ratio in urinary EVs were higher in patients with advanced prostate cancer. This study is the first to report that RNA of urine-derived EVs is a reliable source for AR-V7 expression analysis. The proposed method for quantifying AR-V7 in urinary EVs prepared by a lab-on-a-disc is therefore a simple and promising approach to liquid biopsy with great potential for therapeutic impact on prostate cancer.
Introduction
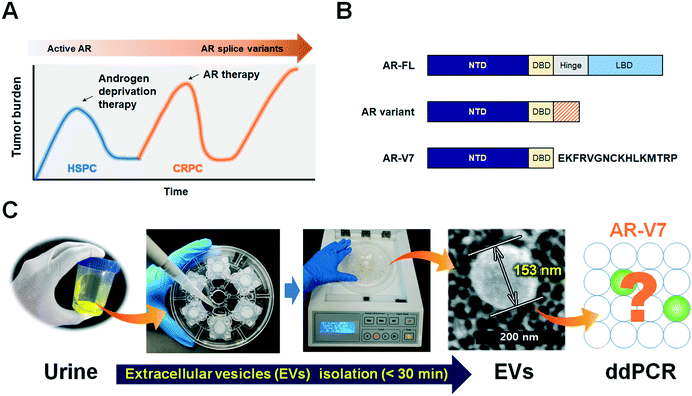
Prostate cancer is the most common cancer affecting men and a leading cause of cancer-related deaths. Almost all patients initially respond to androgen deprivation therapy but inevitably progress to a lethal stage of the disease, castration-resistant prostate cancer (CRPC).1 Therapeutic failure and progression to CRPC are often accompanied by genetic changes in the androgen receptor (AR) gene, such as point mutations in the AR ligand-binding domain and AR splice variants.2Based on the finding that the AR is still active in CRPC and is responsible for disease progression, anti-AR therapies (abiraterone acetate, enzalutamide) have been developed and shown to improve overall survival (OS).3,4 However, approximately one-third of patients have no response to these treatments (i.e., primary resistance), and virtually all patients that show an initial response eventually acquire secondary resistance (Fig. 1A).5 Splicing of AR mRNA is implicated in the progression of CRPC, as well as in resistance to abiraterone and enzalutamide and poor prognosis.6,7 Androgen receptor full-length (AR-FL) consists of 4 functional domains including amino-terminal domain (NTD), DNA-binding domain (DBD), hinge region and ligand binding domain (LBD), while AR-splice variants lack the LBD which is responsible for androgen-dependent receptor activity and general target of anti-AR therapies (Fig. 1B).2,9 Of all AR splice variants, androgen-receptor splice variant 7 (AR-V7) is the most studied due to its constitutive nuclear localization and its transcriptional activity without a full nuclear localization signal.8,9
Despite the established clinical importance of AR-V7, current tissue biopsy-based analytical methodologies have limitations, such as the invasiveness and potential sampling bias due to tumor heterogeneity. Infection complications are the most common reason for hospitalization after a solid biopsy, with 25% of patients experiencing lower urinary tract symptoms.10 For practical and routine analysis of AR-V7, liquid biopsy methods using circulating tumor cells (CTCs) and mRNA from whole blood have been attempted.7,11–13 However, the cost, complexity, and large blood volume requirement for efficient isolation of CTCs as well as the low sensitivity of mRNA analysis from whole blood are still major limitations.
Recently, extracellular vesicles (EVs) have emerged as novel biomarkers for liquid biopsies.14–16 With the growing body of evidence that EVs play an important role in intercellular communication within tumor microenvironments, researchers have explored the potential use of EVs as biomarkers for disease detection, therapy monitoring, and drug resistance surveillance.17–20 Notably, it has been shown that AR-V7 and AR-FL secreted from EVs derived from prostate cancer cell lines could be transported to the nuclei of other cells, modulating responsive gene expression and thus demonstrating the role of EVs as paracrine transcriptional regulators.21 Moreover, plasma-derived EVs were investigated as carriers of AR-V7 for use as predictive biomarkers of resistance to anti-AR therapy.22 Taken together, this evidence suggests a potentially important role for EVs as liquid biopsy markers of prostate cancer progression and resistance to therapy.
Since EVs are prevalently found in most body fluids and carry genetic information originating in cells,23 we hypothesized that urinary EVs are a reliable source for AR-V7 mRNA detection. There has been significant progress in EV isolation by various approaches, including ultracentrifugation (UC), ultrafiltration, density gradient, flow cytometry, immunocapture, and microfluidic isolation.24 The gold-standard UC method not only requires specialized equipment for ultrahigh-speed centrifugation (>100![[thin space (1/6-em)]](https://www.rsc.org/images/entities/char_2009.gif) 000 × g), but its operation procedures are also time-consuming, and the isolated EVs are aggregated into pellets with low yields. The immunoaffinity-based capture of EVs using microfluidic devices can be fast and miniaturized as well.25–27 General EVs markers such as CD9, CD63, and CD81 or tumor specific antibodies such as EpCAM are commonly used to capture as many as or tumor-specific EVs, respectively. However, the capture efficiency is strongly dependent on the choice of antibodies, which remains as an intrinsic limitation to cover highly heterogeneous tumor-derived EVs. On the other hand, size-based isolation methods are label-free, relatively quick and return more intact EVs with better functionality, because such processes do not require high speed centrifugation.28 We previously reported a lab-on-a-disc for size-based EV isolation, Exodisc, which operates at relatively low g-forces (<500 × g) and provides >100-fold higher concentration of mRNA than UC methods.29 While this previously used Exodisc is a fully automated, “sample-in” and “answer-out” device, one disc can process only two samples at a time. In the newly developed Exo-Hexa (Fig. 1C), six filters with 20 nm pore diameters are integrated on each disc. Therefore, six samples can be processed at one time, with the caveat that liquid injection and withdrawal are done manually.
000 × g), but its operation procedures are also time-consuming, and the isolated EVs are aggregated into pellets with low yields. The immunoaffinity-based capture of EVs using microfluidic devices can be fast and miniaturized as well.25–27 General EVs markers such as CD9, CD63, and CD81 or tumor specific antibodies such as EpCAM are commonly used to capture as many as or tumor-specific EVs, respectively. However, the capture efficiency is strongly dependent on the choice of antibodies, which remains as an intrinsic limitation to cover highly heterogeneous tumor-derived EVs. On the other hand, size-based isolation methods are label-free, relatively quick and return more intact EVs with better functionality, because such processes do not require high speed centrifugation.28 We previously reported a lab-on-a-disc for size-based EV isolation, Exodisc, which operates at relatively low g-forces (<500 × g) and provides >100-fold higher concentration of mRNA than UC methods.29 While this previously used Exodisc is a fully automated, “sample-in” and “answer-out” device, one disc can process only two samples at a time. In the newly developed Exo-Hexa (Fig. 1C), six filters with 20 nm pore diameters are integrated on each disc. Therefore, six samples can be processed at one time, with the caveat that liquid injection and withdrawal are done manually.
In this study, we attempted to establish a practical and non-invasive liquid biopsy method for absolute quantification of AR-V7 and AR-FL by enriching urine-derived EVs with size filtration using the lab-on-a-disc, Exo-Hexa, and a tabletop operation machine (<30 min). Our hope was that the urine-derived EVs could be reproducibly used to detect AR-V7 and AR-FL mRNA expression in patients with CRPC and hormone-sensitive prostate cancer. Urinary EVs have not yet been established as a reliable source for AR-V7 detection, and doing so would provide great benefits to clinical urine-based liquid biopsy applications.
Experimental
Cell culture
LNCaP cells were cultured in RPMI (Thermo Fisher Scientific, Waltham, MA, USA) supplemented with 10% exo-free fetal bovine serum (System Biosciences, Inc., Palo Alto, CA, USA) and 1% antibiotics/antimycotics and grown in incubators under 5% CO2 at 37 °C. Cell culture supernatant (CCS) solutions were centrifuged at 300 × g for 10 min at 4 °C, and the supernatants at 2000 × g for 10 min at 4 °C. The clear supernatants were used for EV isolation by Exo-Hexa.PC3 cells (ARCC CRL-1435) and PC3 cells transfected with AR-V7 and AR-FL were used to set up the ddPCR. PC3 cells were cultured in RPMI (Thermo Fisher Scientific) supplemented with 10% exo-free fetal bovine serum (System Biosciences, Inc) and 1% antibiotics/antimycotics and grown in incubators under 5% CO2 at 37 °C. CCS solutions were centrifuged at 300 × g for 10 min at 4 °C and the supernatants at 2000 × g for 10 min at 4 °C. The clear supernatants were used for EV isolation by Exo-Hexa.
Clinical sample storage and handling
Urine samples were collected from patients at Pusan National University Hospital, Pusan, South Korea. The study protocol was reviewed and approved by the Institutional Review Board of Pusan National University Hospital (IRB 1802-004-063) and UNIST (IRB-16-20-A). Urine samples from healthy male volunteers (age <50) were included to determine background levels. Written informed consent was obtained from all subjects. Twenty milliliters of urine were collected from patients with HSPC and CRPC, centrifuged at 500 × g for 10 min at 4 °C to remove cellular debris within 2 h of sample collection, and stored at −80 °C until analysis. Urine samples were then thawed and centrifuged at 2500 × g for 15 min at 4 °C, and the precipitated pellet was discarded. Four milliliters of urine were used for EV isolation by ultracentrifugation (UC) and Exo-Hexa.EV isolation methods
![[thin space (1/6-em)]](https://www.rsc.org/images/entities/char_2009.gif) 000 × g at 4 °C for 2 h in a Ti90 rotor (Beckman Coulter, Brea, CA, USA). The supernatant was discarded, and the pellet was resuspended in 1 mL of 10 nm prefiltered PBS and transferred to 1.2 mL polycarbonate ultracentrifuge tubes. The resuspended solution was centrifuged at 150
000 × g at 4 °C for 2 h in a Ti90 rotor (Beckman Coulter, Brea, CA, USA). The supernatant was discarded, and the pellet was resuspended in 1 mL of 10 nm prefiltered PBS and transferred to 1.2 mL polycarbonate ultracentrifuge tubes. The resuspended solution was centrifuged at 150![[thin space (1/6-em)]](https://www.rsc.org/images/entities/char_2009.gif) 000 × g at 4 °C for 2 h in an MLA-130 fixed-angle rotor (Beckman Coulter). The eluted solution was then resuspended in 200 μL of 10 nm prefiltered PBS and used for subsequent analysis.
000 × g at 4 °C for 2 h in an MLA-130 fixed-angle rotor (Beckman Coulter). The eluted solution was then resuspended in 200 μL of 10 nm prefiltered PBS and used for subsequent analysis.
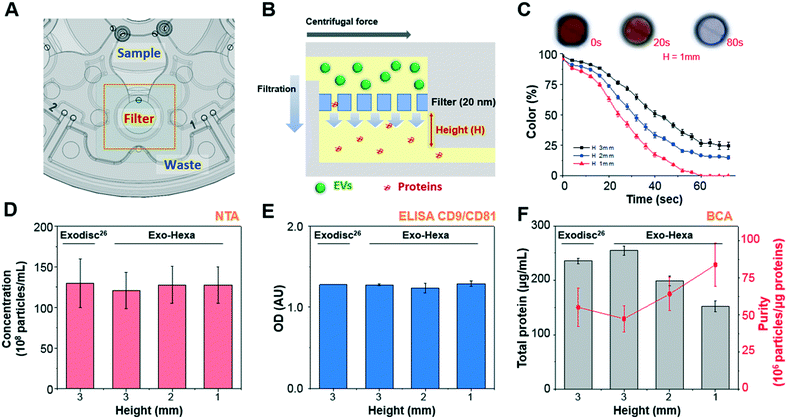 | ||
| Fig. 2 Schematic of Exo-Hexa showing the working principle of EV isolation and the performance comparison with the previously reported Exodisc29 (A) each unit of Exo-Hexa has three chambers for sample loading, filtration, and waste storage positioned in a radially outward direction. (B) Cross-sectional view of the filter chamber showing that EV filtration through the membrane is in tangential direction to the flow by centrifugal pumping force. (C) Color intensity on the filter chamber measured during the washing process of color-dye solution is plotted as a function of time (Movie S2†). Photographs of the filter chamber show that highly efficient washing is achieved within 1.5 min. (D–F) Characterization of EVs isolated from PC3 AR-V7 transfected cell-culture supernatant (CCS) by Exodisc29 and Exo-Hexa with various chamber height underneath the membrane. The number of EVs measured by (D) nanoparticle tracking analysis (NTA) and (E) enzyme-linked immunosorbent assay (ELISA) of CD9/CD81 show similar yields for Exodisc and all conditions of Exo-Hexa. (E) Total protein amount measured by bicinchoninic acid (BCA) decreases as the filter chamber height decreases, resulting higher purity. | ||
Nanoparticle tracking analysis (NTA)
To measure the concentration of EVs, we used an NTA system (Nanosight NS500; Malvern Instruments, Malvern, UK). The isolated EVs were diluted in 10 nm prefiltered PBS to obtain a concentration within the recommended range for measurement (1–10 × 108 particles per mL), corresponding to dilutions from 1![[thin space (1/6-em)]](https://www.rsc.org/images/entities/char_2009.gif) :
:![[thin space (1/6-em)]](https://www.rsc.org/images/entities/char_2009.gif) 2 to 1
2 to 1![[thin space (1/6-em)]](https://www.rsc.org/images/entities/char_2009.gif) :
:![[thin space (1/6-em)]](https://www.rsc.org/images/entities/char_2009.gif) 10 depending on the initial sample concentration. Experiment videos were analyzed using the NTA 3.1 software (Malvern). All NTA measurements were conducted using identical settings to ensure consistent results.
10 depending on the initial sample concentration. Experiment videos were analyzed using the NTA 3.1 software (Malvern). All NTA measurements were conducted using identical settings to ensure consistent results.
Bicinchoninic acid (BCA) assay
The total protein contents of EVs isolated by Exo-Hexa were quantified using the Pierce BCA assay kit (Thermo Fisher Scientific) according to the manufacturer's protocol. Briefly, 10 μL of isolated EVs and serially diluted bovine serum albumin standards (BSA) were added to 96-well plates (Corning, Inc., Corning, NY, USA). Working reagents were prepared and immediately transferred to the plates by adding 200 μL solution per well. After mixing thoroughly on a shaker for 30 s, the plates were sealed and incubated for 30 min at 37 °C. The plates were cooled at room temperature and absorbance was measured at 562 nm using a plate reader (Envision 2104 Multilabel Reader; Perkin Elmer, Waltham, MA, USA). The protein amounts were calculated using standard curves.Enzyme-linked immunosorbent assay (ELISA)
EVs were lysed using 1× RIPA Buffer and Protease Inhibitor (Cell Biolabs, San Diego, CA, USA) and used for ELISA. After incubation at room temperature (RT) for 2 h, the 96-well plates (Corning) were washed twice with 0.1% bovine serum albumin (BSA)–PBS buffer (washing buffer), and then blocked with 1% BSA–PBS buffer at RT for 1 h. After washing twice with washing buffer, the plates were incubated with mouse anti-CD9 (BD Biosciences, Franklin Lakes, NJ, USA) or rabbit anti-Alix (Abcam, Cambridge, UK) in PBS buffer (50 μL, 500 ng mL−1) at 4 °C overnight. The plates were then washed twice and incubated with the secondary antibody at RT for 2 h (anti-rabbit-HRP, 50 μL, 1![[thin space (1/6-em)]](https://www.rsc.org/images/entities/char_2009.gif) :
:![[thin space (1/6-em)]](https://www.rsc.org/images/entities/char_2009.gif) 10
10![[thin space (1/6-em)]](https://www.rsc.org/images/entities/char_2009.gif) 000; and anti-mouse-HRP, 50 μL, 1
000; and anti-mouse-HRP, 50 μL, 1![[thin space (1/6-em)]](https://www.rsc.org/images/entities/char_2009.gif) :
:![[thin space (1/6-em)]](https://www.rsc.org/images/entities/char_2009.gif) 5000; Abcam, Cambridge, UK). After washing twice with washing buffer, 50 μL of 3,3′,5,5′-tetramethylbenzidine (TMB) solution was added, and the plates were incubated at RT for 15 min. After 50 μL of the stop solution was added, the absorbance was read at 450 nm using a plate reader (Tecan Group, Ltd., Mannedorf, Switzerland).
5000; Abcam, Cambridge, UK). After washing twice with washing buffer, 50 μL of 3,3′,5,5′-tetramethylbenzidine (TMB) solution was added, and the plates were incubated at RT for 15 min. After 50 μL of the stop solution was added, the absorbance was read at 450 nm using a plate reader (Tecan Group, Ltd., Mannedorf, Switzerland).
On-disc ELISA
After filtration of the samples and washing the enriched EVs using Exo-Hexa, the EVs on the filter were incubated with a solution of biotin-conjugated detection antibodies (CD9; Abcam) in PBS (100 μL; 500 ng mL−1) at room temperature for 15 min. After being removed from the solution and washed twice with the washing buffer, the EVs were incubated with HRP-conjugated streptavidin (100 μL; 1![[thin space (1/6-em)]](https://www.rsc.org/images/entities/char_2009.gif) :
:![[thin space (1/6-em)]](https://www.rsc.org/images/entities/char_2009.gif) 1000) at room temperature for 5 min, and then washed twice with the washing buffer. The buffers from the filtration chamber were removed. TMB (80 μL) solution was transferred to the filters in individual units simultaneously and incubated at room temperature for 1 min. After incubation, the stop solution (50 μL) was transferred to the filters in individual units simultaneously and mixed thoroughly by shaking for 10 s. The solution was transferred to the 96-well plates (Corning) and absorbance at 450 nm was measured using a plate reader (Tecan).
1000) at room temperature for 5 min, and then washed twice with the washing buffer. The buffers from the filtration chamber were removed. TMB (80 μL) solution was transferred to the filters in individual units simultaneously and incubated at room temperature for 1 min. After incubation, the stop solution (50 μL) was transferred to the filters in individual units simultaneously and mixed thoroughly by shaking for 10 s. The solution was transferred to the 96-well plates (Corning) and absorbance at 450 nm was measured using a plate reader (Tecan).
RNA extraction and qRT-PCR using urinary EVs
The miRNeasy kit (Qiagen, Hilden, Germany) was used to extract total RNA from EVs isolated from 4 mL urine by UC and Exo-Hexa. The concentration of RNA was measured using a NanoQuant system (Tecan). cDNA was prepared using the SuperScript VILO cDNA synthesis kit (Thermo Fisher Scientific).Quantitative RT-time PCR was performed using 2 μL cDNA for each of the following TaqMan gene expression assays; GAPDH (Hs99999905_m1), ACTB (Hs99999903_m1), CD9 (Hs00233521_m1), FLOT1 (Hs00195134_m1), PSA (Hs03063374_m1), PSMA (Hs00379515_m1) and conducted using TaqMan Gene Expression Master Mix using a QuantStudio6 system (Thermofisher Scientific). The PCR program was 40 cycles of 95 °C for 15 s and 60 °C for 20 s with an initial cycle of 50 °C for 2 min and 95 °C for 10 min.
ddPCR
AR-V7 and AR-FL mRNA levels were simultaneously quantified using the QX200 ddPCR system (Bio-Rad, Hercules, CA, USA). Primers and probes for both AR-FL and AR-V7 were designed as follows: ARV7 forward, 5′-TTGTCCATCTTGTCGTCTTCG-3′; ARV7 probe, 5′-6-FAM-TCTCCCAGA/ZEN™/GTCATCCCTGCTTCATA Iowa Black® FQ-3′; ARV7 reverse, 5′-CAATTGCCAACCCGGAATTT-3′; AR forward, 5′-AATCCCACATCCTGCTCAAG-3′; AR probe, 5′-6-HEX-ACTCCGTGC/ZEN™/AGCCTATTGCGA Iowa Black® FQ-3′; and AR reverse, 5′-AGTGAACTGATGCAGCTCTC-3′. ddPCR samples were prepared in a 20 μL reaction volume containing 10 μL ddPCR Super Master Mix (Bio-Rad), 8 μL cDNA template, and 1 μL each of the forward primer, reverse primer, and probe (FAM and HEX). Droplets were generated using 70 μL oil and the QX200 droplet generator (Bio-Rad). PCR amplification was performed using the Master cycler pro S (Eppendorf, Hamburg, Germany) as per the following protocol: 95 °C for 10 min; followed by 40 cycles of 94 °C for 30 s, 56 °C for 1 min, and 98 °C for 10 min; then held at 4 °C. After amplification, the fluorescence signal was read on a QX200 droplet reader (Bio-Rad) and analyzed using the QuantaSoft software (Bio-Rad). Absolute quantification was determined by calculating the number of target DNA copies per mL urine or CCS using sample concentrations.Patient selection
A total of 36 patients (22 diagnosed with HSPC and 14 with CRPC) were recruited at the Pusan National University Hospital from April 2017 to December 2017. All patients were confirmed as having adenocarcinoma of the prostate by a single uropathologist at the same institution. HSPC was defined as prostate cancer without any prior androgen deprivation therapy. CRPC was defined as having castrate serum testosterone <50 ng dL−1 or 1.7 nmol L−1, plus either biological progression, (three consecutive rises in prostate-specific antigen [PSA] one week apart, resulting in two 50% increases over the nadir and a PSA >2 ng mL−1) or radiological progression (the appearance of new lesions, two or more new bone lesions on a bone scan, or a soft tissue lesion), according to the Response Evaluation Criteria in Solid Tumors (RECIST).30 All recruited patients that progressed to CRPC underwent docetaxel-based chemotherapy, and did not at any point receive second line therapy, including abiraterone acetate or enzalutamide, as it is not covered under the Korean national insurance system.Statistical analysis
Statistical analyses were performed using the R 3.5.0 software. The Shapiro–Wilk normality test was used to estimate the normality of data distribution in AR-V7, AR-FL, and the AR-V7/AR-FL ratio. Wilcoxon signed-rank and Mann–Whitney tests were used to compare differences between expression levels in the CRPC and HSPC populations. The receiver operating characteristic curve (ROC) was prepared by plotting the true-positive rate against the false-positive rate. Statistical tests were considered significant when p < 0.05.Results and discussion
Urine-derived EV isolation by Exo-Hexa
In this study, we isolated urinary EVs using the newly developed disc, Exo-Hexa, and detected AR-V7 expression using ddPCR, as schematically shown in Fig. 1C and 2A. The device is composed of six independent filtration units with pore diameters of 20 nm, enabling the simultaneous processing of six different samples. The detailed spinning process for EV enrichment and washing is shown in Movie S1.† The feed direction by centrifugation is perpendicular to the direction of the filtration through the pore, resulting in tangential flow filtration (Fig. 2B). EVs larger than the pore diameter, 20 nm, were retained in the chamber above the membrane. The scanning electron microscope (SEM) images shown in Fig. 1C and S1† represent the EVs isolated from urine samples. Furthermore, the size distribution of urinary EVs measured by SEM and NTA are given in Fig. S1.†Compared to the previously reported Exodisc,29 we further improved the purity by the modification of the chamber design (Fig. 2C–F) while having similarly excellent EVs isolation yields and enhanced throughput; one disc can process 2 (Exodisc) and 6 (Exo-Hexa) samples simultaneously (Fig. S2 and Table S1†). To be specific, as we decreased the height of the chamber underneath the membrane, we could achieve highly enhanced washing efficiency measured by the intensity of the color dye solution (Fig. 2C and Movie S2†) as well as the CCS samples (Fig. 2F). While the yield of EV amounts captured on both Exodisc and Exo-Hexa remain similar (Fig. 2D and E), the total protein amount was decreased significantly when the chamber height underneath the filter decreased from 3 mm to 1 mm, resulting highly enhanced purity from 55.1 ± 12.8 to 83.9 ± 14.6 × 10⁶ particles per μg of total protein (Fig. 2F).
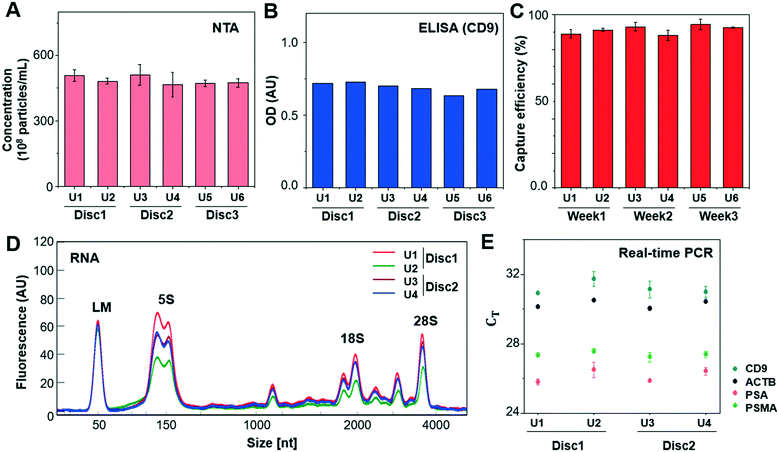
In addition, the reproducibility of the method was tested by applying 1 mL of LNCaP CCS to every two units of three Exo-Hexa (Fig. 3). After isolating EVs from CCS, NTA analysis (Fig. 3A) showed 4.85 ± 0.19 × 10¹⁰ particles per mL, with the low coefficient of variation (CV) of 3.9% for the eluted EVs from all 6 units of the three different discs. Also, on-disc ELISA (Fig. 3B) was implemented on two units of each Exo-Hexa and showed similar optical density (OD) values in all 6 units across the three different discs. In addition, we examined the stability of the 1% pluronic (PEO–PPO–PEO block copolymer) pre-coated device during the storage in ambient condition for over 3 weeks and the capture efficiency quantified by CD9/CD81 ELISA remained similar (Fig. 3C). Moreover, we investigated the yield and size distribution of RNAs from EVs isolated from 4 units on two different discs. All four units yielded RNAs exhibiting an identical size range based on their overlapped peak distribution (Fig. 3D). Furthermore, we performed RT-PCR analysis (Fig. 3E) to confirm the CT values for CD9, beta-actin (ACTB), prostate-specific antigen (PSA), and prostate-specific membrane antigen (PSMA) using RNA isolated from EVs prepared by four units of two different discs. Our results showed that the EV enrichment yields obtained using Exo-Hexa were reproducible.
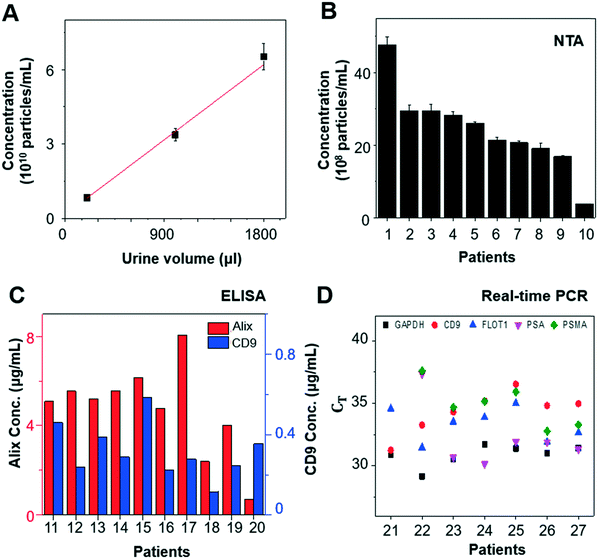
When we varied the input volume of urine samples, we achieved a linear correlation between input volume and particle concentration from the enriched EV samples (Fig. 4A). In addition, EVs isolated from urine samples of 10 patients with prostate cancer (n = 10) were characterized by NTA, ELISA, and RT-qPCR to investigate their concentration, protein expression, and mRNA expression, respectively. The EV concentration was found to be in the range of 1–50 × 108 particles per mL by NTA (Fig. 4B), and the EV protein markers, CD9 and Alix, were detected by ELISA (Fig. 4C). RT-qPCR confirmed the presence of glyceraldehyde 3-phosphate dehydrogenase (GAPDH), EV markers (CD9 and flotillin-1 [FLOT1]), and prostate markers (PSA and prostate-specific membrane antigen [PSMA]) in the urine-derived EVs isolated using our platform (Fig. 4D). Measurements were conducted using identical settings to ensure consistent results.
Absolute quantification of AR-V7 and AR-FL by ddPCR
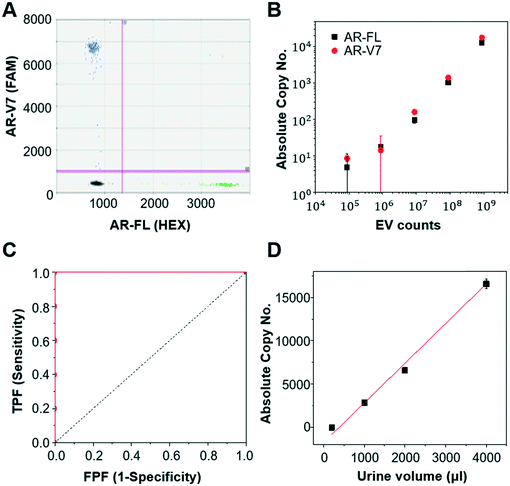
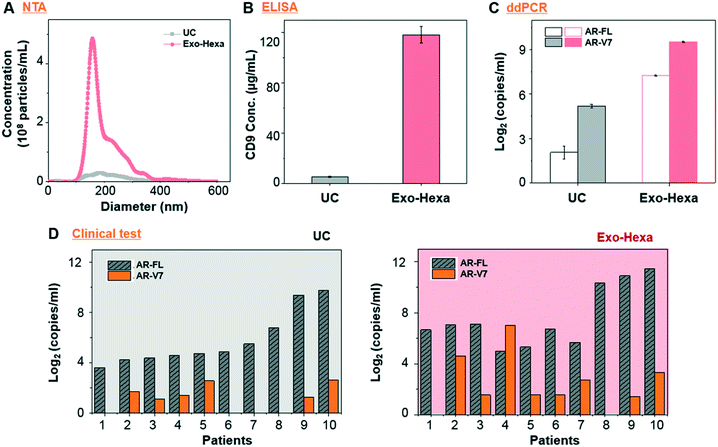
First, we validated the detection of AR-V7 and AR-FL from EVs isolated from AR-V7 and AR-FL transfected PC3 CCS using ddPCR (Fig. 5A). By varying the input number of EVs, we confirmed that ddPCR can provide absolute quantification of AR-V7 and AR-FL starting from samples with >1 × 10⁶ EVs (Fig. 5B). No AR-V7 signal was detected in the negative samples without template, confirming the specificity of the detection method. The ROC curve for AR-V7 detection is presented in Fig. 5C, and it is observed that the curve is very close to the upper left corner with very high overall accuracy. In addition, we tested the linear correlation of AR-FL absolute copy number as a function of urine loading volume, which confirmed the reproducibility of the quantification capability of our EV isolation method (Fig. 5D).Next, we compared the performance of Exo-Hexa with the conventional UC method by characterizing the EVs isolated from PC3 AR-V7 transfected CCS. As shown in Fig. 6A–C, EVs enriched by Exo-Hexa give higher particle concentration, CD9 concentration and AR-V7 and AR-FL expression quantified by ddPCR. Furthermore, we isolated EVs from the urine samples from patients with prostate cancer using UC and Exo-Hexa. As shown in Fig. 6D, Exo-Hexa platform gives higher AR-V7 and AR-FL mRNA expression than UC method. Taken together, it demonstrates that EVs isolated using the Exo-Hexa are a reliable source for quantification of AR-V7 and AR-FL mRNA.
AR-V7 expression and AR-V7/AR-FL ratio are significantly higher in patients with CRPC than in those with HSPC
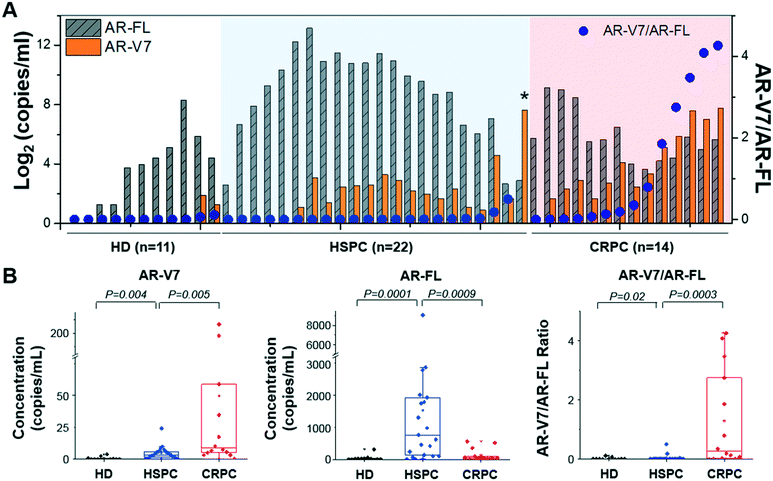
To analyze AR-V7 and AR-FL expression, we enrolled 36 patients, 22 of which had HSPC and 14 of which had CRPC (Fig. 7). Patient characteristics are described in Table S2.† AR-FL expression was higher in patients with HSPC (6.2–9053.6 copies per mL, median: 760.7 copies per mL) than in those with CRPC (12.9–562.5 copies per mL, median: 50.9 copies per mL; p < 0.001, Mann–Whitney test). In contrast, AR-V7 expression was higher in patients with CRPC (0–217.0 copies per mL, median: 8.8 copies per mL) than in those with HSPC (0–24.1 copies per mL, median: 3.2 copies per mL; p < 0.01).To provide background levels, urine samples from 11 HD were tested as well. Both AR-FL (2.4–316.1 copies per mL, median: 15.8 copies per mL) and AR-V7 (0-3.8 copies per mL, median: 0 copies per mL) expression in urinary EVs from HD were significantly lower than that those from patients with prostate cancer.
Next, we questioned whether the ratios of AR-V7 to AR-FL in patients with HSPC and CRPC were different. The AR-V7/AR-FL ratio was significantly higher in patients with CRPC (0–4.3, median: 0.3) than in those with HSPC (0–0.5, median: 0.003; p < 0.001, Mann–Whitney test), while HD samples showed the lowest (0–0.1, median: 0). Furthermore, receiver operating characteristic (ROC) curves are shown in Fig. S3,† indicating that AR-V7 is a great classifier for differentiating prostate cancer (including HSPC and CRPC) from HD (area under the curve, AUC, 0.81–0.94; Fig. S3A and B†). Also, AR-V7/AR-FL ratio gives a great distinction for classifying CRPC from HSPC (AUC, 0.87; Fig. S3C†). There were no significant differences between the baseline characteristics of race and age in the patients with HSPC (54–81, median: 70) and CRPC (60–82, median: 71.5; p > 0.05). Notably, one patient with HSPC showed unusually high AR-V7 expression levels (represented with an asterisk in Fig. 7A), and their diagnosis was changed to CRPC after four months; thus, this case was ignored during the comparative analyses described here.
Among 11 HD samples, 2 (18.2%) showed positive AR-V7 but their expression in HD was significantly lower than those from patients with prostate cancer. When we used the maximum value of AR-V7 from HD samples (3.8 copies per mL) as the cut-off value, 78.6% (11/14) of CRPC and 50% (11/22) of HSPC samples showed higher than the control. On the other hand, 64.3% (9/14) of CRPC and 13.6% (3/22) of HSPC samples showed higher value than the highest ratio of AR-V7/AR-FL obtained from HD samples (0.1).
When AR and AR-V7 expression were measured from blood sample,11 18 of 28 healthy control subjects had detectable (non-zero) AR-V7 levels. Among 85 CRPC patients, 15 (18%) patients showed the AR-V7 fraction over total AR higher than the maximum value detected in healthy donors.11 When CTC samples were used,12 AR-V7 was detected in 50% (8/16) of CRPC samples while none was detected from HSPC samples (n = 10). The AR-V7 and AR-FL expression were negligible when peripheral blood mononuclear cells (PBMCs) from healthy donor (n = 5) were tested.12 Despite the differences in sample sources, isolation and detection methods with the limited number of clinical samples tested, the AR-V7 detection from urinary EVs enriched by Exo-Hexa was more sensitive than those measured from whole blood11 or CTC samples.12
The primary objective of this study was to develop a method for efficient and non-invasive detection of AR-V7 using urine-derived EVs. There was a tendency for higher AR-V7 expression in urine-derived EVs from patients with CRPC than in those with HSPC. Previously reported methods for AR-V7 detection in liquid biopsies used blood samples, such as CTCs,7 mRNA from whole blood,13 or plasma-derived EVs.22 Although blood collection is less invasive than obtaining tumor tissue,6 robust and efficient isolation of tumor-specific materials remains a major challenge because blood contains a large number of contaminants, such as cells, vesicles, and proteins from healthy tissues. The present study provides evidence that RNA extracted from urinary EVs can be used for the sensitive detection of AR-V7 in prostate cancer patients. It is worth noting that none of the patients with CRPC in our cohort received abiraterone acetate or enzalutamide, but all the patients were undergoing docetaxel-based chemotherapy because we collected the urine samples at the time of CRPC diagnosis. Interestingly, we found that one patient with HSPC had remarkably high AR-V7 expression, and had their diagnosis changed to CRPC after four months, indicating the potential for early CRPC diagnosis using urine-derived EVs. Several studies have shown that the AR-V7/AR-FL ratio tends to be elevated in CRPC tissues compared to HSPC tissues.31,32 Furthermore, docetaxel treatment has been shown to reduce levels of nuclear-translocated AR-FL in CRPC tissues without any major changes in AR variants.33,34 However, there are no published reports comparing AR-V7 and AR-FL mRNA expression in urine-based liquid biopsies from docetaxel-treated patients with CRPC. We thus believe that the interplay between AR-FL, AR-V7, and other AR variants warrants further study.
Although promising, the clinical role of urinary EV RNA on OS or on the choice of therapy requires further investigation using larger patient numbers. For example, a longitudinal study by Welti et al. clearly demonstrated that AR-V7 protein expression in tissue samples increased with development of CRPC and was prognostic for OS.6 In addition, AR-V7 mRNA expression in CTCs7 or plasma-derived EVs22 from patients with CRPC could be used to predict resistance to abiraterone acetate or enzalutamide. Taken together, we postulate that urinary EVs can be a sample source for non-invasive, simple, and frequent monitoring of AR-V7 expression in prostate cancer patients.
Conclusions
This is the first report demonstrating that AR-V7 mRNA expression in urinary EVs can be reliably quantified in prostate cancer patients. Absolute quantification using ddPCR provided sensitive detection of urinary EV RNA from intact EVs, prepared by label-free, size-based enrichment using a centrifugal microfluidic device. Furthermore, AR-V7 expression and, more significantly, the ratio of AR-V7/AR-FL were higher in patients with CRPC than in those with HSPC.Conflicts of interest
The authors have declared that no competing interest exists.Acknowledgements
We express our gratitude to all patients and healthy volunteers that provided urine samples for this study. The bio specimens and data used for this study were provided by the Biobank of Pusan National University Hospital, a member of the Korea Biobank Network, which is supported by the Ministry of Health and Welfare (PNUH IRB 1802-004-063). We would like to thank Sunmi Choi for her help in patient sample storage and information organization throughout this project. This project was mainly supported by a grant from the Ministry of Health & Welfare (HI12C1845) and IBS-R020-D1, funded by the Korean Government.References
- J. T. Isaacs and W. B. Isaacs, Nat. Med., 2004, 10, 26–27 CrossRef CAS PubMed.
- P. A. Watson, V. K. Arora and C. L. Sawyers, Nat. Rev. Cancer, 2015, 15, 701–711 CrossRef CAS PubMed.
- J. S. De Bono, C. J. Logothetis, A. Molina, K. Fizazi, S. North, L. Chu, K. N. Chi, R. J. Jones, O. B. Goodman Jr and F. Saad, N. Engl. J. Med., 2011, 364, 1995–2005 CrossRef CAS PubMed.
- H. I. Scher, K. Fizazi, F. Saad, M.-E. Taplin, C. N. Sternberg, K. Miller, R. de Wit, P. Mulders, K. N. Chi and N. D. Shore, N. Engl. J. Med., 2012, 367, 1187–1197 CrossRef CAS PubMed.
- R. J. van Soest, M. E. van Royen, E. S. de Morrée, J. M. Moll, W. Teubel, E. Wiemer, R. Mathijssen, R. de Wit and W. M. van Weerden, Eur. J. Cancer, 2013, 49, 3821–3830 CrossRef CAS PubMed.
- J. Welti, D. N. Rodrigues, A. Sharp, S. Sun, D. Lorente, R. Riisnaes, I. Figueiredo, Z. Zafeiriou, P. Rescigno and J. S. de Bono, Eur. Urol., 2016, 70, 599–608 CrossRef CAS PubMed.
- E. S. Antonarakis, C. Lu, H. Wang, B. Luber, M. Nakazawa, J. C. Roeser, Y. Chen, T. A. Mohammad, Y. Chen and H. L. Fedor, N. Engl. J. Med., 2014, 371, 1028–1038 CrossRef PubMed.
- P. A. Watson, Y. F. Chen, M. D. Balbas, J. Wongvipat, N. D. Socci, A. Viale, K. Kim and C. L. Sawyers, Proc. Natl. Acad. Sci. U. S. A., 2010, 107, 16759–16765 CrossRef CAS PubMed.
- R. Hu, T. A. Dunn, S. Wei, S. Isharwal, R. W. Veltri, E. Humphreys, M. Han, A. W. Partin, R. L. Vessella and W. B. Isaacs, Cancer Res., 2009, 69, 16–22 CrossRef CAS PubMed.
- S. Loeb, A. Vellekoop, H. U. Ahmed, J. Catto, M. Emberton, R. Nam, D. J. Rosario, V. Scattoni and Y. Lotan, Eur. Urol., 2013, 64, 876–892 CrossRef PubMed.
- A. K. Seitz, S. Thoene, A. Bietenbeck, R. Nawroth, R. Tauber, M. Thalgott, S. Schmid, R. Secci, M. Retz and J. E. Gschwend, Eur. Urol., 2017, 72, 828–834 CrossRef CAS PubMed.
- Y. Ma, A. Luk, F. P. Young, D. Lynch, W. Chua, B. Balakrishnar, P. de Souza and T. M. Becker, Int. J. Mol. Sci., 2016, 17, 1264 CrossRef PubMed.
- T. Takeuchi, Y. Okuno, M. Hattori-Kato, M. Zaitsu and K. Mikami, Res. Rep. Urol., 2016, 8, 21–25 CAS.
- H. Shao, H. Im, C. M. Castro, X. Breakefield, R. Weissleder and H. Lee, Chem. Rev., 2018, 118, 1917–1950 CrossRef CAS PubMed.
- A. Hoshino, B. Costa-Silva, T.-L. Shen, G. Rodrigues, A. Hashimoto, M. T. Mark, H. Molina, S. Kohsaka, A. Di Giannatale and S. Ceder, Nature, 2015, 527, 329–335 CrossRef CAS PubMed.
- S. A. Melo, L. B. Luecke, C. Kahlert, A. F. Fernandez, S. T. Gammon, J. Kaye, V. S. LeBleu, E. A. Mittendorf, J. Weitz and N. Rahbari, Nature, 2015, 523, 177–182 CrossRef CAS PubMed.
- J. Park, H.-Y. Lin, J. P. Assaker, S. Jeong, C.-H. Huang, A. Kurdi, K. Lee, K. Fraser, C. Min and S. Eskandari, ACS Nano, 2017, 11, 11041–11046 CrossRef CAS PubMed.
- R. Sullivan, G. Maresh, X. Zhang, C. Salomon, J. Hooper, D. Margolin and L. Li, Front. Endocrinol., 2017, 8, 194 CrossRef PubMed.
- K. Liang, F. Liu, J. Fan, D. Sun, C. Liu, C. J. Lyon, D. W. Bernard, Y. Li, K. Yokoi and M. H. Katz, Nat. Biomed. Eng., 2017, 1, 0021 CrossRef PubMed.
- P. Samuel, M. Fabbri and D. R. F. Carter, Proteomics, 2017, 17, 1600375 CrossRef PubMed.
- J. Read, A. Ingram, H. A. Al Saleh, K. Platko, K. Gabriel, A. Kapoor, J. Pinthus, F. Majeed, T. Qureshi and K. Al-Nedawi, Eur. J. Cancer, 2017, 70, 62–74 CrossRef CAS PubMed.
- M. Del Re, E. Biasco, S. Crucitta, L. Derosa, E. Rofi, C. Orlandini, M. Miccoli, L. Galli, A. Falcone and G. W. Jenster, Eur. Urol., 2017, 71, 680–687 CrossRef CAS PubMed.
- K. W. Witwer, E. I. Buzas, L. T. Bemis, A. Bora, C. Lässer, J. Lötvall, E. N. Nolte-‘t Hoen, M. G. Piper, S. Sivaraman and J. Skog, J. Extracell. Vesicles, 2013, 2, 20360 CrossRef PubMed.
- E. Willms, C. Cabañas, I. Mäger, M. Wood and P. Vader, Front. Immunol., 2018, 9, 738 CrossRef PubMed.
- S. S. Kanwar, C. J. Dunlay, D. M. Simeone and S. Nagrath, Lab Chip, 2014, 14, 1891–1900 RSC.
- J. Ko, N. Bhagwat, S. S. Yee, N. Ortiz, A. Sahmoud, T. Black, N. M. Aiello, L. McKenzie, M. O'Hara, C. Redlinger, J. Romeo, E. L. Carpenter, B. Z. Stanger and D. Issadore, ACS Nano, 2017, 11, 11182–11193 CrossRef CAS PubMed.
- E. Reategui, K. E. Vos, C. P. Lai, M. Zeinali, N. A. Atai, B. Aldikacti, F. P. Floyd Jr, A. H. Khankhel, V. Thapar, F. H. Hochberg, L. V. Sequish, B. V. Nahed, B. S. Carter, M. Toner, L. Balaj, D. T. Ting, X. O. Breakefield and S. L. Stott, Nat. Commun., 2018, 9, 175 CrossRef PubMed.
- E. A. Mol, M.-J. Goumans, P. A. Doevendans, J. P. Sluijter and P. Vader, Nanomed.: Nanotechnol., Biol. Med., 2017, 13, 2061–2065 CrossRef CAS PubMed.
- H.-K. Woo, V. Sunkara, J. Park, T.-H. Kim, J.-R. Han, C.-J. Kim, H.-I. Choi, Y.-K. Kim and Y.-K. Cho, ACS Nano, 2017, 11, 1360–1370 CrossRef CAS PubMed.
- P. Cornford, J. Bellmunt, M. Bolla, E. Briers, M. De Santis, T. Gross, A. M. Henry, S. Joniau, T. B. Lam and M. D. Mason, Eur. Urol., 2017, 71, 630–642 CrossRef PubMed.
- E. Hornberg, E. B. Ylitalo, S. Crnalic, H. Antti, P. Stattin, A. Widmark, A. Bergh and P. Wikstrom, PLoS One, 2011, 6, e19059 CrossRef PubMed.
- R. Hu, T. A. Dunn, S. Wei, S. Isharwal, R. W. Veltri, E. Humphreys, M. Han, A. W. Partin, R. L. Vessella, W. B. Isaacs, G. S. Bova and J. Luo, Cancer Res., 2009, 69, 16–22 CrossRef CAS PubMed.
- K. Kuroda, H. Liu, S. Kim, M. Guo, V. Navarro and N. H. Bander, Prostate, 2009, 69, 1579–1585 CrossRef CAS PubMed.
- S. K. Martin, C. A. Banuelos, M. D. Sadar and N. Kyprianou, Mol. Oncol., 2015, 9, 628–639 CrossRef CAS PubMed.
Footnotes |
| † Electronic supplementary information (ESI) available. See DOI: 10.1039/c8lc01185k |
| ‡ These authors contributed equally to this work. |
| This journal is © The Royal Society of Chemistry 2019 |

