DOI:
10.1039/C5RA16982H
(Paper)
RSC Adv., 2015,
5, 85417-85430
L-Proline-promoted synthesis of 2-amino-4-arylquinoline-3-carbonitriles as sustainable corrosion inhibitors for mild steel in 1 M HCl: experimental and computational studies
Received
22nd August 2015
, Accepted 24th September 2015
First published on 25th September 2015
Abstract
The inhibition of mild steel corrosion in 1 M HCl by 2-amino-4-(4-nitrophenyl) quinoline-3-carbonitrile (AAC-1), 2-amino-4-phenylquinoline-3-carbonitrile (AAC-2) and 2-amino-4-(4-hydroxyphenyl) quinoline-3-carbonitrile (AAC-3) has been investigated using weight loss, electrochemical (potentiodynamic polarization and electrochemical impedance spectroscopy (EIS)), surface (SEM, EDX and AFM) and quantum chemical calculation methods. The results indicated that the investigated inhibitors exhibited good inhibition efficiency against the corrosion of mild steel in acidic solution. The weight loss and electrochemical results suggested that inhibition efficiencies were enhanced with an increase in the concentration of 2-amino-4-arylquinoline-3-carbonitriles (AACs). The results showed that the inhibition efficiencies of the investigated AACs obeyed the order: AAC-3 (96.52%), AAC-2 (95.65%) and AAC-1 (94.78%). Potentiodynamic polarization study revealed that the investigated AACs act as cathodic type inhibitors. Adsorption of the AACs on a mild steel surface obeyed the Langmuir adsorption isotherm. Furthermore, SEM, EDX and AFM studies clearly revealed the film-forming ability of AACs on the mild steel surface. Quantum chemical calculations were undertaken to provide mechanistic insight into the mechanism of inhibition action of AACs. On the basis of experimental and theoretical studies it was concluded that the presence of electron releasing hydroxyl (–OH) groups in AAC-3 increases the inhibition efficiency whereas electron withdrawing nitro (–NO2) groups in AAC-1 decrease the inhibition efficiency.
1. Introduction
Acidic solutions are widely used in acid cleaning, acid descaling, oil well acidification and enhanced oil recovery techniques in petroleum and other industries which causes severe economic and safety problems due to corrosion.1–3 Among the several available methods, the use of synthetic corrosion inhibitors is the most effective, practical, and economic way to overcome this problem.4,5 In this sense, heterocyclic compounds containing polar functional groups (–OH, –NH2, –CN, –C![[double bond, length as m-dash]](https://www.rsc.org/images/entities/char_e001.gif) C–, –N
C–, –N![[double bond, length as m-dash]](https://www.rsc.org/images/entities/char_e001.gif) N–) and π-electrons in form of double and triple bonds draw much attention due to their high adsorption tendency in addition to their ease and economic synthesis.6,7 Generally, N-heterocyclic inhibitors adsorb on metallic surface through unshared paired electrons of heteroatoms (N, O), conjugated double and/or triple bonds, and aromatic rings.8,9 The adsorption of the heterocyclics on metal surface is influenced by several factors such as presence of functional groups, electron density at donor heteroatoms (N, O, and S), and chemical structure.10,11 Quinoline and its derivative possess potential applications for synthesis of biologically important compounds such as DNA binding capabilities, antitumor and DNA-intercalating carrier.12 Previously, few reports have been published in which quinoline and its derivatives emphasized as useful metallic corrosion inhibitors.12–19
N–) and π-electrons in form of double and triple bonds draw much attention due to their high adsorption tendency in addition to their ease and economic synthesis.6,7 Generally, N-heterocyclic inhibitors adsorb on metallic surface through unshared paired electrons of heteroatoms (N, O), conjugated double and/or triple bonds, and aromatic rings.8,9 The adsorption of the heterocyclics on metal surface is influenced by several factors such as presence of functional groups, electron density at donor heteroatoms (N, O, and S), and chemical structure.10,11 Quinoline and its derivative possess potential applications for synthesis of biologically important compounds such as DNA binding capabilities, antitumor and DNA-intercalating carrier.12 Previously, few reports have been published in which quinoline and its derivatives emphasized as useful metallic corrosion inhibitors.12–19
Multicomponent reactions have immerged as a green and powerful technique in synthetic organic chemistry and drug discovery in the sense that several biologically active complex molecules can be synthesized from commercially available cheap starting materials in one step.20 Further, the consumption of environmentally benign solvents and chemicals are of particular importance because they contribute many of the green chemistry principles. In asymmetric organocatalysis, use of proline particularly in water and ionic liquids is the most sustainable alternative method as it is directly isolated from natural biological sources without use of any hazardous chemical and solvents such as DMSO, DMF and other chlorinated solvents.21–23
The main objective of present work was to compare the corrosion inhibition efficiency of three synthesized 2-amino-4-arylquinoline-3-carbonitriles (AACs) on mild steel corrosion in 1 M HCl. Several methods such as weight loss, electrochemical impedance spectroscopy (EIS), scanning electron microscopy (SEM), atomic force microscopy (AFM), and quantum chemical techniques were used for this purpose. The selection criteria of these compounds as corrosion inhibitors was based on the facts that they: (a) can be easily synthesized from commercially available cheap and green starting materials with high yield (b) exhibited excellent inhibition efficiency even at low concentration (c) possess three aromatic rings, several heteroatoms (N, O) and polar functional groups (–OH –NO2, –CN, –NH2) through which they can adsorb on the metal surface (d) have high solubility in testing medium which is attributed due to presence of various polar functional groups.
2. Experimental procedures
2.1. Materials
2.1.1. Synthesis of 2-amino-4-arylquinoline-3-carbonitriles. As described earlier,24 the investigated 2-amino-4-arylquinoline-3-carbonitriles (AACs) were synthesized by refluxing a mixture comprising of aniline (1 mmol), aldehyde (1 mmol), and malononitrile (1 mmol) and L-proline catalyst (0.05 g, 20 mol%) in water (2 mL) was refluxed for 12 h. The synthetic scheme of the investigated AACs is shown in Fig. 1. Completion of reactions and formation of products were checked by TLC method. After completion of reaction, the reaction mixtures were cooled to room temperature and solid crude products were filtered. The solid crude precipitates were washed with water (10 mL) and finally with ethanol (5 mL) to obtain pure AACs. The synthesized inhibitors were characterized by spectroscopic analysis. The chemical structures, IUPAC name, abbreviation and analytical data of the investigated inhibitors are given in Table 1. The stock solution of inhibitors was prepared in 1 M HCl containing 2% acetone.
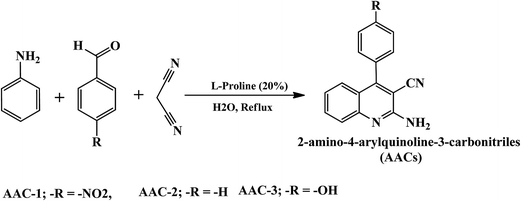 |
| | Fig. 1 Synthetic rout of studied AACs. | |
Table 1 IUPAC name, molecular structure, molecular formula, melting point and analytical data of studied AACs
| S. No. |
IUPAC name and abbreviation of inhibitor |
Chemical structure |
Molecular formula and M.P. and analytical data |
| 1 |
2-Amino-4-(4-nitrophenyl) quinoline-3-carbonitrile (AAC-1) |
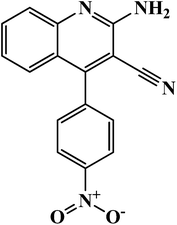 |
C16H10N4O2 (mol. wt. 290.08) cream colored solid, IR spectrum (KBr cm−1): 3578, 2858, 2228, 1723, 1680, 1656, 1530, 1448, 1357, 1118, 948, 875, 654, 1H NMR (300 MHz, DMSO) δ (ppm): 6.439–6.627, 6.737–6.763, 7.523–7.848, 8.031 |
| 2 |
2-Amino-4-phenylquinoline-3-carbonitrile (AAC-2) |
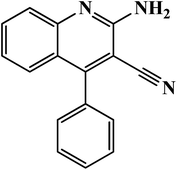 |
C16H11N3, (mol. wt. 245.09), brown colored waxy solid, IR spectrum (KBr cm−1): 3587, 3428, 2871, 2224, 1643, 1503, 1423, 1341, 1154, 924, 735, 652, 1H NMR (300 MHz, DMSO) δ (ppm): 6.337–6.527, 6.462–6.635, 7.338–7.536 |
| 3 |
2-Amino-4-(4-hydroxyphenyl) quinoline-3-carbonitrile (AAC-3) |
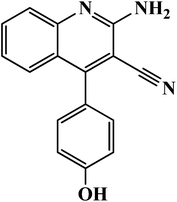 |
C16H11N3O, (mol. wt. 261.09), yellow colored; IR spectrum (KBr cm−1): 3646, 3542, 2856, 2245, 1646, 1564, 1472, 1227, 923, 830, 627, 1H NMR (300 MHz, DMSO) δ (ppm): 6.468–6.725, 6.635–6.974, 7.896–7.938, 8.323 |
2.1.2. Electrodes and reagents. For all weight loss and electrochemical experiments, working electrodes were cut from the commercially available mild steel sheet having chemical composition (weight percentage): C (0.076), Mn (0.192), P (0.012), Si (0.026), Cr (0.050), Al (0.023), and Fe (balance). The exposed surface of the working electrodes were cleaned successively with emery papers of different grade (600, 800, 1000, 1200), washed with deionized water, degreased with acetone, ultrasonically cleaned with ethanol and stored in moisture free desiccator before used in the experiments. Hydrochloric acid (HCl, 37%, MERCK) and double distilled water were used for preparation of test solution (1 M HCl).
2.2. Methods
2.2.1. Weight loss measurements. Cleaned, dried and accurately weighted mild steel specimens having dimension 2.5 × 2.0 × 0.025 cm3 were immersed in 1 M HCl without and with different concentrations of AACs for 3 h. After elapsed time, these specimens were removed, washed with distilled water and acetone, dried in moisture free desiccator, and again weighted accurately. To insure the reproducibility of the weight loss results, each experiment was triply performed and means values were reported at each concentration. From the calculated weight loss, inhibition efficiency (η%) was derived using following relationship:25,26| |
 | (1) |
where w0 and wi are the weight loss values in the absence and presence of AACs at different concentrations, respectively.
2.2.2. Electrochemical measurements. The mild steel specimens with exposed area 1 cm2 (one sided) were utilized for all electrochemical measurements were performed under potentiodynamic condition using Gamry Potentiostat/Galvanostat (Model G-300) instrument. Gamry Echem Analyst 5.0 software installed in the computer was used to fit and analyzed the all electrochemical data. The instrument consist of a mild steel working electrode (WE), platinum as a counter electrode and a saturated calomel electrode (SCE) as a reference electrode. Before starting the electrochemical experiments, the working electrode allowed to corrode freely for sufficient time in order to attain steady open circuit potential (OCP). During polarization measurements, the cathodic and anodic Tafel slopes were recorded by changing the electrode potential inevitably from 0.25 to +0.25 V vs. corrosion potential (Ecorr) at a constant sweep rate of 1.0 mV s−1. The corrosion current density (icorr) was calculated by extrapolating the linear segments of Tafel slopes (cathodic and anodic). From the calculated icorr value inhibition efficiency was calculated using following relation:25,26| |
 | (2) |
where, i0corr and iicorr are corrosion current in the absence and presence of AACs, respectively.Electrochemical impedance measurements were carried out at open circuit potential in the frequency range of 100 kHz to 0.01 Hz using AC signal of amplitude 10 mV peak to peak. The charge transfer resistances were calculated from Nyquist plots. The inhibition efficiency was calculated using following equation:25,26
| |
 | (3) |
where,
R0ct and
Rict are charge transfer resistances in absence and presence of AACs, respectively.
2.2.3. SEM, EDX and AFM measurements. For surface analysis, the cleaned mild steel specimens of above mentioned composition were allowed to corrode for 3 h in absence and presence of optimum concentration of AACs. Thereafter, the specimens were taken out washed with water, dried and employed for SEM, EDX and AFM analysis. The SEM model Ziess Evo 50 XVP was used to investigate the micromorphology of mild steel surface at 500× magnification. Chemical composition of the inhibited and uninhibited specimens was recorded by an EDX detector coupled to the SEM. NT-MDT multimode AFM, Russia, 111 controlled by solvers canning probe microscope controller was employed for surface analysis by AFM method. The single beam cantilever having resonance frequency in the range of 240–255 kHz in semi contact mode with corresponding spring constant of 11.5 N m−1 with NOVA programme was used for image interpretation. The scanning area during AFM analysis was 5 mm × 5 mm.
2.2.4. Quantum chemical calculations. Quantum chemical calculations were carried out on the investigated AACs using the density functional theory (DFT) method involving the Becke three-parameter hybrid functional together with the Lee–Yang–Paar correlation functional (B3LYP).27 The 6-31+G(d,p) basis set was chosen for all the calculations. The calculations were carried out with the aid of Gaussian 09 software for Windows (Revision D.01).28 The optimized geometries of the compounds were confirmed to correspond to their true energy minima by the absence of imaginary frequency in the computed vibrational frequencies. All quantum chemical parameters were derived based on the electronic parameters of the most stable conformers of the molecules. The frontier molecular orbital (FMO) energies, that is, the highest occupied molecular orbital energy (EHOMO) and the lowest unoccupied molecular energy (ELUMO) were calculated. Other parameters such as the energy gap (ΔE), global hardness (η), global electronegativity (χ), and the fraction of electrons transfer (ΔN) from the inhibitor to the metal atom were computed respectively according to the equations:29,30| |
 | (5) |
| |
 | (6) |
| |
 | (7) |
where χFe and ηinh denote the electronegativity and hardness of iron and inhibitor, respectively. A value of 7 eV mol−1 was used for the χFe, while ηFe was taken as 0 eV mol−1 for bulk Fe atom in accordance with the Pearson's electronegativity scale.31 The total energy change (ΔET) that accompanies the donor–acceptor charge transfer process was calculated according to the approximation made by Gomez et al.:32| |
 | (8) |
where η was approximated to the chemical hardness of the inhibitor molecule. Selected dihedral angles that might have some correlations with the experimental inhibition efficiency of the compounds were also reported.
3. Results and discussion
3.1. Weight loss measurements
3.1.1. Effect of AACs concentration. The weight loss is a reliable, useful, and widely used technique to examine the corrosion inhibition property of inhibitors. The effect of AACs concentrations on mild steel corrosion at 308 K after 3 immersion time were investigated by weight loss method. Variation of the inhibition efficiency with AACs concentration is shown in Fig. 2 and corrosion parameters such as corrosion rate (CR), inhibition efficiency (η%), and surface coverage (θ) are given in Table 2. From the results it is seen that the values of weight loss (mg) and corrosion rate (CR) were decreased with an increased in AACs concentration and maximum efficiency was observed at 40 mg L−1 concentration. The AAC-1, AAC-2 and AAC-3 showed maximum efficiency of 94.78%, 95.65% and 96.52%, respectively at 40 mg L−1 concentration and 308 K temperature. The increased AACs concentration causes increased in extent of adsorption and surface coverage due to availability of large number of inhibitor molecules therefore increases inhibition efficiency.33 The difference in the inhibition efficiency might be due to presence of different substituents and molecular size of the AACs.34 The AAC-3 attained the highest inhibition efficiency among the studied compounds due to presence of additional electron releasing hydroxyl (–OH) group in the phenyl moiety of aromatic aldehyde in AAC-3. Whereas, AAC-1 exhibited the lowest inhibition efficiency which is attributed due to presence of electron withdrawing nitro (–NO2) group in the phenyl moiety of aromatic aldehyde.
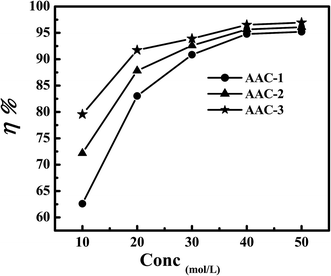 |
| | Fig. 2 Variation of inhibition efficiency with AACs concentration. | |
Table 2 The weight loss parameters obtained for mild steel in 1 M HCl containing different concentrations of AACs
| Inhibitor |
Conc (mg L−1) |
Weight loss (mg) |
CR (mg cm−2 h−1) |
Surface coverage (q) |
η% |
| Blank |
0.0 |
230 |
7.66 |
— |
— |
| AAC-1 |
10 |
86 |
2.86 |
0.626 |
62.6 |
| 20 |
39 |
1.30 |
0.8304 |
83.04 |
| 30 |
21 |
0.70 |
0.9086 |
90.86 |
| 40 |
12 |
0.40 |
0.9478 |
94.78 |
| 50 |
11 |
0.36 |
0.9521 |
95.21 |
| AAC-2 |
10 |
64 |
2.13 |
0.7217 |
72.17 |
| 20 |
28 |
0.93 |
0.8782 |
87.82 |
| 30 |
17 |
0.56 |
0.9260 |
92.60 |
| 40 |
10 |
0.33 |
0.9565 |
95.65 |
| 50 |
9 |
0.30 |
0.9608 |
96.08 |
| AAC-3 |
10 |
47 |
1.56 |
0.7956 |
79.56 |
| 20 |
19 |
0.63 |
0.9173 |
91.73 |
| 30 |
14 |
0.46 |
0.9391 |
93.91 |
| 40 |
8 |
0.26 |
0.9652 |
96.52 |
| 50 |
7 |
0.23 |
0.9695 |
96.95 |
3.1.2. Kinetic parameters: effect of temperature. Variation of inhibition efficiency (η%) and corrosion rate (CR) with electrolyte solution is given in Table 3. From the result depicted in Table 3 it seen that an increase in electrolyte temperature leads to an increase in the rate of mild steel dissolution and corrosion for inhibited and uninhibited acid solutions. The effect of temperature on metallic dissolution in inhibited solution is highly complex, because at elevated temperature several changes such as rapid etching, desorption of inhibitor and decomposition and/or rearrangement of inhibitor takes place.35 The Arrhenius equation is successfully used to establish the relationship between corrosion rate (CR) and temperature where the natural logarithm of the corrosion rate (CR) is a linear function with 1/T. | |
 | (9) |
where CR is the corrosion rate in mg cm−2 h−1, A is the Arrhenius pre-exponential factor, R is the gas constant and T is the absolute temperature. The Arrhenius plots (Fig. 3) give a straight line between log![[thin space (1/6-em)]](https://www.rsc.org/images/entities/char_2009.gif) CR versus 1/T. The values of activation energy (Ea) for mild steel dissolution were calculated from the slopes (−ΔEa/2.303R) of the Arrhenius plots and given in Table 4. From the results depicted in Table 4 it is seen that values of apparent activation energies are higher in presence of AACs than in their absence (28.48 kJ mol−1). The higher values of apparent activation energy for AAC-1 (71.40 kJ mol−1), AAC-2 (73.73 kJ mol−1) and AAC-3 (75.65 kJ mol−1) indicated the formation of energy barrier for mild steel dissolution in presence of AACs.36 Further, it is assume that electrostatic interaction (physical adsorption) between charged inhibitors and metal surface might cause increase in the values of apparent activation energy in presence of AACs.37
CR versus 1/T. The values of activation energy (Ea) for mild steel dissolution were calculated from the slopes (−ΔEa/2.303R) of the Arrhenius plots and given in Table 4. From the results depicted in Table 4 it is seen that values of apparent activation energies are higher in presence of AACs than in their absence (28.48 kJ mol−1). The higher values of apparent activation energy for AAC-1 (71.40 kJ mol−1), AAC-2 (73.73 kJ mol−1) and AAC-3 (75.65 kJ mol−1) indicated the formation of energy barrier for mild steel dissolution in presence of AACs.36 Further, it is assume that electrostatic interaction (physical adsorption) between charged inhibitors and metal surface might cause increase in the values of apparent activation energy in presence of AACs.37
Table 3 Variation of CR and η% with temperature in absence and presence of optimum concentration of AACs in 1 M HCl
| Temperature (K) |
Corrosion rate (CR) (mg cm−2 h−1) and inhibition efficiency (η%) |
| Blank |
AAC-1 |
AAC-2 |
AAC-3 |
| CR |
η% |
CR |
η% |
CR |
η% |
CR |
η% |
| 308 |
7.66 |
— |
0.40 |
94.77 |
0.33 |
95.69 |
0.26 |
96.60 |
| 318 |
11.0 |
— |
1.26 |
88.54 |
1.06 |
90.36 |
0.96 |
91.27 |
| 328 |
14.3 |
— |
2.43 |
83.00 |
1.93 |
86.50 |
1.63 |
88.60 |
| 338 |
18.6 |
— |
4.10 |
77.95 |
3.90 |
79.03 |
3.63 |
80.48 |
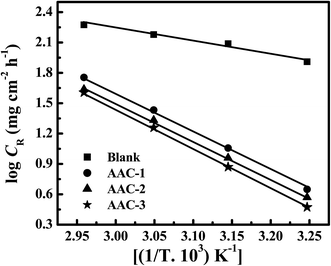 |
| | Fig. 3 Arrhenius plots for the corrosion rate of mild steel versus the temperature in 1 M HCl. | |
Table 4 Values of activation energies for mild steel dissolution in 1 M HCl in the absence and at of optimum concentration of AACs
| Inhibitor |
Ea |
| Blank |
28.48 |
| AAC-1 |
71.40 |
| AAC-2 |
73.73 |
| AAC-3 |
75.65 |
3.2. Electrochemical measurements
3.2.1. Potentiodynamic polarization studies. Potentiodynamic polarization studied was carried out to understand the mechanism of the mild steel dissolution at anode and evolution of hydrogen at cathode. The current–potential curves for mild steel corrosion without and with several concentrations of three AACs are show in Fig. 5. As reflected from the Tafel slopes, the presence of inhibitors causes significant shift in the anodic and cathodic processes toward lower current relative to the Tafel slopes of blank specimen. And, therefore it is concluded that presence of inhibitors affect the anodic mild steel dissolution as well as the cathodic hydrogen evolution to some extent.44 Simultaneously, this decrease in anodic and cathodic current densities becomes more significant with increasing inhibitors concentration. A successful extrapolation of linear segments of the anodic and Tafel cathodic slopes provided some important electrochemical parameters such as corrosion potential (Ecorr), corrosion current density (icorr), anodic and cathodic Tafel slopes (βa and βc), as well as corrosion inhibition efficiency (η%). The calculated parameters were listed in Table 6.
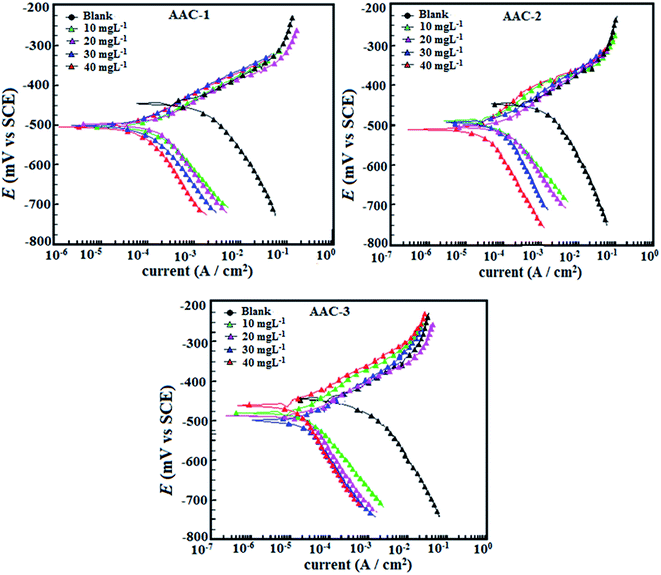 |
| | Fig. 5 (a–c) Polarization curves for mild in absence and presence of different concentration of AACs. | |
Table 6 Tafel polarization parameters for mild steel in 1 M HCl solution in absence and at different concentration of AACs
| Inhibitor |
Conc Mg L−1 |
Ecorr (mV per SCE) |
βa (μA cm−2) |
βc (mV per dec) |
icorr (mV per dec) |
η% |
θ |
| Blank |
— |
−445 |
70.5 |
114.6 |
1150 |
— |
— |
| AAC-1 |
10 |
−489 |
79.2 |
146.4 |
436.6 |
62.03 |
0.6203 |
| 20 |
−499 |
77.3 |
187.5 |
173.2 |
84.93 |
0.8493 |
| 30 |
−504 |
77.3 |
127.8 |
93.7 |
91.85 |
0.9185 |
| 40 |
−494 |
85.1 |
90.8 |
76.8 |
93.32 |
0.9332 |
| AAC-2 |
10 |
−499 |
80.2 |
103.5 |
263.9 |
77.05 |
0.7705 |
| 20 |
−458 |
39.6 |
52.0 |
128.3 |
88.84 |
0.8884 |
| 30 |
−491 |
75.6 |
82.6 |
68.5 |
94.04 |
0.9404 |
| 40 |
−510 |
80.7 |
116.7 |
47.1 |
95.90 |
0.9590 |
| AAC-3 |
10 |
−504 |
72.2 |
119.8 |
213.5 |
81.43 |
0.8143 |
| 20 |
−500 |
73.1 |
187.0 |
86.8 |
92.45 |
0.9245 |
| 30 |
−479 |
72.1 |
103.3 |
53.9 |
95.31 |
0.9531 |
| 40 |
−511 |
43.4 |
39.3 |
17.86 |
98.44 |
0.9844 |
From the polarization results depicted in Fig. 5 and Table 6 it is observed that the presence of three inhibitors significantly reduced the values of corrosion current densities without causing any substantial change in the values of Ecorr. This finding suggests that investigated AACs inhibit mild steel corrosion in acid solution by forming a surface film without changing the mechanism of mild steel corrosion.45 Further, the shift in Ecorr values is not very prominent, the maximum shift in Ecorr values were 59, 65 and 66 mV for AAC-1, AAC-2 and AAC-3, respectively, toward cathodic polarization suggesting that investigated inhibitors acted as mixed type inhibitors mainly cathodic inhibitors.46
3.2.2. Electrochemical impedance spectroscopy (EIS) study. The electrochemical impedance spectroscopy is an important technique to study the characteristics and kinetics of electrochemical reactions occurring on the metal surface in acid solution. Nyquist plots for mild steel in absence and presence of different concentration of the inhibitors are given in Fig. 6. The impedance spectrum at each condition gives depressed capacitive imperfect semicircles in high frequency region which is attributed to the charge transfer process and the formation of a protective layer by inhibitors on the metal surface.47 The imperfect semicircle of the impedance spectrum is attributed to the mass transfer processes, frequency dispersion as well as inhomogeneities and roughness of metal surface.48 Meanwhile, the diameter of the imperfect semicircles increases on increasing AACs concentrations. This finding suggests that the studied inhibitors strongly aggregate on the mild steel surface and block the active sites and therefore increases the charge transfer resistance as well as inhibition efficiency.49,50 In the present case, the impedance nature of mild steel corrosion was studied using previously described simple electrical equivalent circuit consisting of a resistor of solution resistance (Rs), a resistor of charge transfer (Rct), and a double layer capacitance.51 The double layer capacitance was replaced by constant phase element (CPE) to find more precise and accurate fit of impedance data. The impedance nature of CPE is defined as follows:51| |
 | (12) |
where, Y0 is the CPE constant, ω is the angular frequency; j is the imaginary number and n is the phase shift (exponent). The values double layer capacitance (Cdl) in absence and presence of inhibitors was derived using following relationship:52where, ωmax is the frequency at which the imaginary part of impedance has attained the maximum (rad s−1) value. Generally, the value of n related to the surface inhomogeneity. The electrochemical behavior of the CPE is related to the value of n. In general, the value of n equal to 0, 1, −1 and 0.5 associated with the resistance, capacitance, inductance and Warburg impedance nature of the metal/electrolyte interface, respectively. In our present work, the value of n varies from 0.777 to 0.998. Upon inspection of the data in Table 7 it can be seen that Rct increased with increase in the AACs concentration while values of Cdl decreased with concentration signifying that the AACs functioned by adsorption at the metal/electrolyte interfaces.53 The inhibition efficiency was calculated using eqn (6) and maximum observed efficiencies were 94.27%, 96.08%, and 97.42 for AAC-1, AAC-2and AAC-3, respectively, at 40 mg L−1 concentration and 308 K temperature.
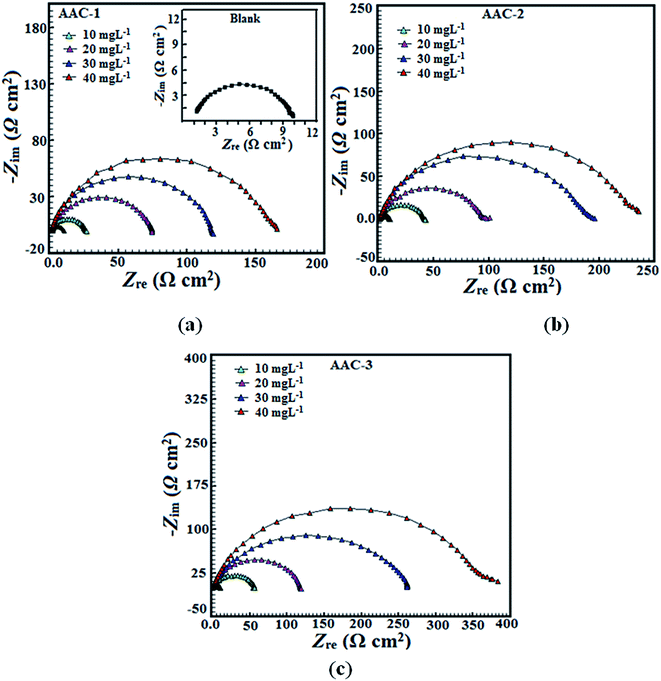 |
| | Fig. 6 (a–c) Nyquist plot for mild steel in 1 M HCl without and with different concentrations of AACs. | |
Table 7 EIS parameters obtained for mild steel in 1 M HCl in absence and presence of different concentration of AACs
| Inhibitor |
Conc Mg L−1 |
Rs (Ω cm2) |
Rct (Ω cm2) |
n |
Cdl (μF cm−2) |
η% |
θ |
| Blank |
— |
1.12 |
9.58 |
0.827 |
106.21 |
— |
— |
| AAC-1 |
10 |
0.820 |
24.9 |
0.857 |
30.83 |
61.52 |
0.6152 |
| 20 |
0.997 |
72.3 |
0.859 |
76.35 |
86.74 |
0.8674 |
| 300 |
1.510 |
121.3 |
0.866 |
36.40 |
92.10 |
0.9210 |
| 40 |
0.892 |
167.4 |
0.873 |
32.80 |
94.27 |
0.9427 |
| AAC-2 |
10 |
0.719 |
40.1 |
0.859 |
64.56 |
76.10 |
0.7610 |
| 20 |
1.160 |
94.7 |
0.860 |
34.99 |
89.88 |
0.8988 |
| 30 |
0.649 |
195.5 |
0.869 |
32.15 |
95.09 |
0.9509 |
| 40 |
0.810 |
244.4 |
0.885 |
29.52 |
96.08 |
0.9608 |
| AAC-3 |
10 |
2.34 |
51.3 |
0.863 |
62.77 |
81.32 |
0.8132 |
| 20 |
0.891 |
120.5 |
0.866 |
34.63 |
92.04 |
0.9204 |
| 30 |
0.76 |
258.8 |
0.879 |
28.47 |
96.29 |
0.9629 |
| 40 |
0.88 |
371.6 |
0.886 |
25.76 |
97.42 |
0.9742 |
The Bode plots, shown in Fig. 7a–c exhibited three different segments in absence of AACs. In high frequency region the values of log|Z|and phase angle (α0) tend to become zero which is a characteristics response of resistive behavior and corresponds to solution resistance enclosed between reference electrode (saturated calomel electrode) and working electrode (mild steel).54,55 However, in the medium frequency region, a linear relationship between log|Z| against log![[thin space (1/6-em)]](https://www.rsc.org/images/entities/char_2009.gif) f, with slop values close to −1 and the phase angle value tends to become −70°, were observed. This is a characteristics response of capacitive behavior. An ideal capacitor is associated with slope value of −1 and phase angle value of −90°.56 The deviation from ideal capacitive behavior in the presence study is attributed due to rough working electrode surface resulted due to corrosion. The careful examination of the Bode plots reveal that the values of phase angle significantly increased and therefore, surface roughness remarkably decreased in presence of AACs due to formation of protective surface film.57 Further, Bode plots give one time constant, sigma maxima in the intermediate frequency region. The broadening of this maximum in the Bode plots is attributed due to the adsorption and formation of protective film by inhibitors at the metal/electrolyte interface.58
f, with slop values close to −1 and the phase angle value tends to become −70°, were observed. This is a characteristics response of capacitive behavior. An ideal capacitor is associated with slope value of −1 and phase angle value of −90°.56 The deviation from ideal capacitive behavior in the presence study is attributed due to rough working electrode surface resulted due to corrosion. The careful examination of the Bode plots reveal that the values of phase angle significantly increased and therefore, surface roughness remarkably decreased in presence of AACs due to formation of protective surface film.57 Further, Bode plots give one time constant, sigma maxima in the intermediate frequency region. The broadening of this maximum in the Bode plots is attributed due to the adsorption and formation of protective film by inhibitors at the metal/electrolyte interface.58
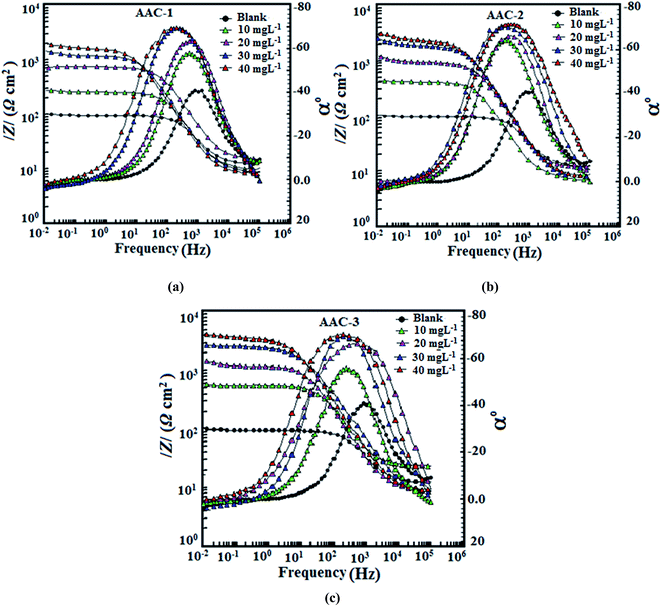 |
| | Fig. 7 (a–c) Bode (log![[thin space (1/6-em)]](https://www.rsc.org/images/entities/char_2009.gif) f vs. log|Z|) and phase angle (log f vs. log|Z|) and phase angle (log![[thin space (1/6-em)]](https://www.rsc.org/images/entities/char_2009.gif) f vs. α0) plots for mild steel in 1 M HCl in absence and presence of different concentration of AACs. f vs. α0) plots for mild steel in 1 M HCl in absence and presence of different concentration of AACs. | |
3.3. Surface measurements
3.3.1. Scanning electron microscopy (SEM) study. Fig. 8a reveals a SEM micrograph of mild steel surface before exposing to the test solution which clearly shows the abrading scratches on surface formed during cleaning by SiC emery papers. The morphology of mild steel specimen surface in Fig. 8b reveals that in the absence of AACs, the surface is highly corroded and damaged with some area of localized corrosion which is attributed due to the free acid corrosion of mild steel. However, in the presence of AACs, at their optimum concentration, the surface morphologies (Fig. 8c–e) are remarkably smoothed. By comparing the surface morphology of mild steel in absence and presence of AACs at same magnification (500×), it is seen that in presence of AACs the mild steel surfaces are comparatively less corroded and less damaged. This behavior is because of the formation of protective surface film by AACs. This finding suggests that the AACs inhibit mild steel corrosion in 1 M HCl by forming a protecting surface film.
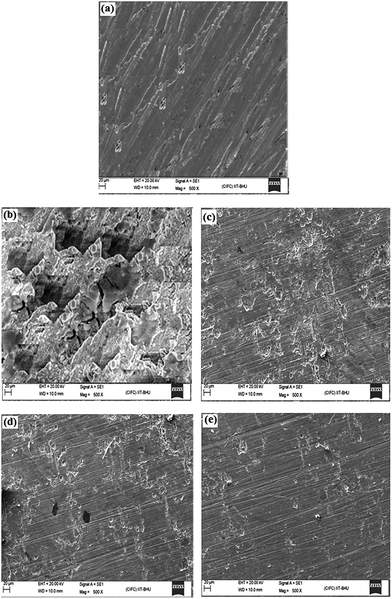 |
| | Fig. 8 (a–e) SEM images of mild steel surfaces: (a) abraded, (b) in absence of AACs and in the presence of 40 mg L−1 of (c) AAC-1, (d) AAC-2, and (e) AAC-3. | |
3.3.2. Energy dispersive X-ray (EDX) study. To determine the elements present on the mild steel surface before and after exposure to the AACs solution, the EDX spectra of the specimens were taken after 3 h immersion time. Fig. 9 represents the EDX spectra of mild steel specimens in absence and presence of AACs at their optimum concentration. In absence of AACs the EDX spectrum shown in Fig. 9a gives characteristics peaks of the elements (Fe, carbon and oxygen) constituting the mild steel specimen. The presence of low intensity signal corresponding to oxygen (O) is might be due to formation of iron oxide after removal of the specimen from the uninhibited solution during SEM/EDX operation. However, in presence of optimum concentration of AACs (Fig. 9b–d), the EDX spectra show additional signals for nitrogen suggesting that in the inhibited solution AACs adsorb on the metal surface and from protective surface film which is responsible for the appearances of pick for the nitrogen in the EDX spectra of inhibited mild steel specimens. Moreover, the signals corresponding to the oxygen (O) for inhibited mild steel specimens show comparatively high intensities as compare to uninhibited specimens. This finding again suggests the adsorption of AACs on mild steel surface resulting into increased intensity of signals corresponds to the oxygen. The elemental composition of the mild steel surface obtained from EDX analysis is given in Table 8.
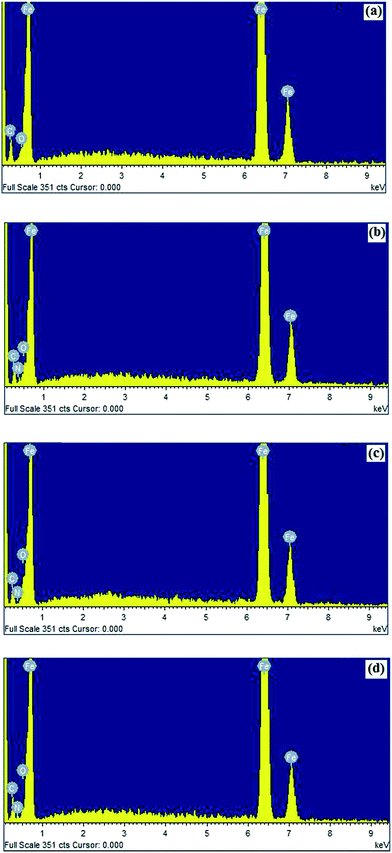 |
| | Fig. 9 (a–d) EDX images of mild steel: (a) in absence of AACs and in the presence of 40 mg L−1 of (b) AAC-1, (c) AAC-2, and (d) AAC-3. | |
Table 8 Percentage atomic contents of elements obtained from EDX spectra for AACs
| Inhibitor |
Fe |
C |
N |
O |
| Blank |
62.27 |
34.94 |
— |
2.77 |
| AAC-1 |
64.86 |
24.48 |
5.28 |
5.34 |
| AAC-2 |
65.18 |
26.28 |
6.37 |
2.17 |
| AAC-3 |
63.42 |
24.87 |
7.94 |
3.86 |
3.3.3. Atomic force microscopy (AFM) study. AFM is a powerful tool to study the surface morphology at nano- to micro-scale and has become a new choice to study the influence of inhibitors on the generation and the progress of the corrosion at the metal/solution interface. The 3D AFM micrographs of mild steel specimens after 3 h immersion time in absence and presence of AACs at their optimum concentration are shown in Fig. 10. Fig. 10a represents the surface morphology of the mild steel in absence of AACs which reveals a very rough surface. This is concluded that in absence of AACs, the mild steel surface highly corroded resulting in the highly surface roughness. The calculated average surface roughness of the mild steel surface in absence of AACs was 392 nm. However, in presence of AACs (Fig. 10b–d), the surface morphologies are significantly improved might be due to formation of protective surface film. The protective surface films isolated the specimens from aggressive acid solution and therefore inhibit corrosion. The calculated average surface roughnesses were 194, 139 and 108 nm in presence of inhibitor AAC-1, AAC-2 and AAC-3, respectively.
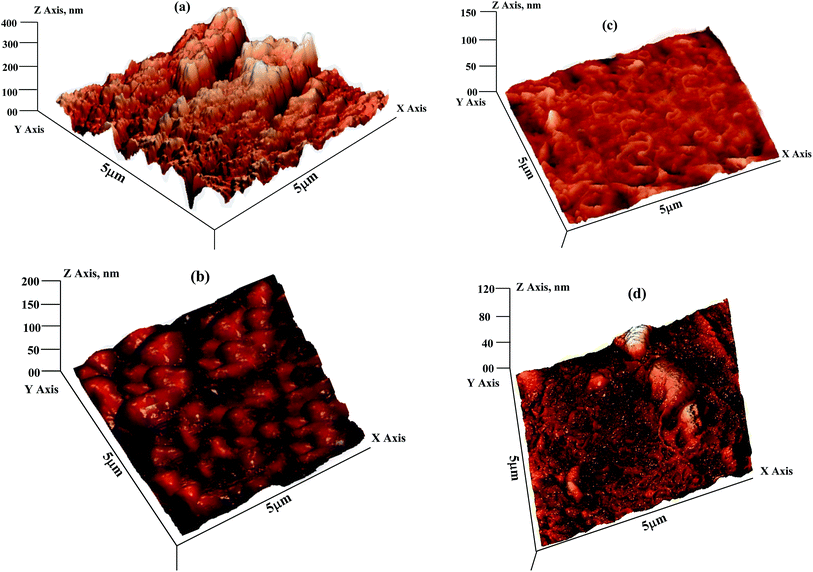 |
| | Fig. 10 (a–d) AFM images of mild steel: (a) in absence of AACs and in the presence of 40 mg L−1 of (b) AAC-1, (c) AAC-2, and (d) AAC-3. | |
3.4. Quantum chemical calculations
The optimized structures of the studied compounds showing the dihedral angles between the planes of the atoms labeled a, b, c, d are shown in Fig. 11. It is apparent from Fig. 11 that the phenyl group attached to the 4-position of the quinoline ring is not coplanar with the quinoline ring. Since the structural differences in the three AACs are mainly found on the 4-phenyl group substituent, it may be necessary to compare the degree of planarity/non-planarity of this phenyl group in the three compounds. This is because molecules with high degree of planarity are generally believed to exhibit higher inhibition efficiencies than their corresponding less (non)-planar analogues.59–61 A flat molecule has the tendency to cover the surface of the metal optimally and also to offer enhanced electrostatic interactions between its coplanar atoms and the metallic atom. The lower inhibition efficiency of AAC-1 despite its more number of N and O atoms compared to the other two compounds could be as a result of the highly electron-withdrawing effect of the nitro group of the 4-nitrophenyl, which reduces the electron density of the aromatic ring, and also the relatively less planarity of the 4-nitrophenyl group compared to AAC-2, which lessens the possible electrostatic interactions between the electron-density of the aromatic group and the charged or polarized metal atom.62,63 AAC-3 on the other hand has –OH substituent group at positions 4 making it a potentially better inhibitor than AAC-2 without any substituent. The frontier molecular orbitals provide information about the prospective sites of the molecules involved in donor–acceptor relationship between the inhibitor molecules and the metal atom. The HOMO and LUMO electron density distributions of the studied AACs are shown in Fig. 12. The HOMO electron densities of AAC-1 and AAC-2 are essentially distributed on the atoms in the quinoline ring and extended to the N atom of the amino group attached to the position 2 of the ring. This suggests that the quinoline rings in AAC-1 and AAC-2 play a major role in donating π-electrons to the vacant d-orbital of Fe. There is also the tendency of the 2-amino group donating σ-electrons to the vacant d-orbital of the Fe. For AAC-3, the HOMO electron densities are distributed over the entire quinoline rings and extended to the 4-hydroxylphenyl and the 2-amino groups. This suggests that the quinoline ring, the 4-hydroxylphenyl and the 2-amino groups are likely to participate in donating electrons to the appropriate vacant orbitals of the Fe for effective corrosion inhibition. The LUMO electron densities in the three compounds are nearly distributed over the entire molecular areas. This suggests that the compounds are capable of accepting electrons from the appropriate occupied orbitals of the Fe atom during the donor–acceptor interactions.
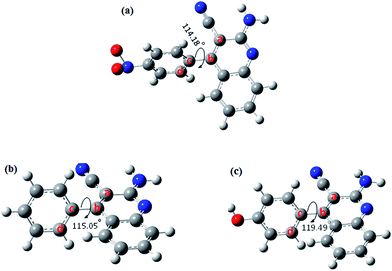 |
| | Fig. 11 Optimized molecular structures of the studied compounds showing the dihedral angles a–d (in degrees). | |
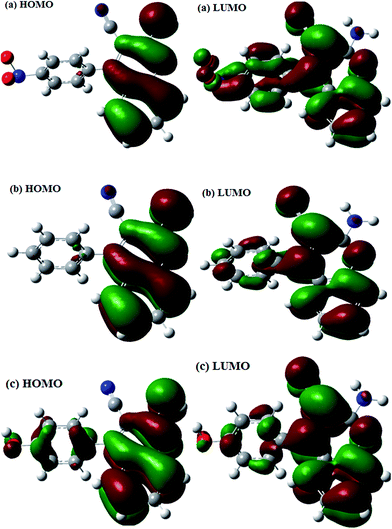 |
| | Fig. 12 The frontier molecular orbital of studied AACs (a) AAC-1 (left, HOMO; right, LUMO), (b) AAC-2 (left, HOMO; right, LUMO) and (c) AAC-3 (left, HOMO; right, LUMO). | |
The calculated quantum chemical parameters are listed in Table 9. The EHOMO is a measure of the tendency of a molecule to donate its HOMO electrons to the appropriate vacant orbital of an electron-acceptor during the donor–acceptor interactions. The higher the value of the EHOMO the better will be chance of electron donation by the donor molecule. The results in Table 9 shows that the trend of the EHOMO for the studied compounds is: AAC-3 > AAC-2 > AAC-1, which corresponds to the trend of the observed inhibition efficiency. The ELUMO on the other hand is a measure of the tendency of a molecule to accept electrons into its LUMO from the appropriate occupied orbital of an electron-donor. That is, the lower the value of the ELUMO the better the chance of electron acceptance by the acceptor molecule. The values of the ELUMO obtained for the studied compounds do not correlate with the observed η%. The opposite trends of the ELUMO values and the η% suggest that the inhibition potentials of the studied AACs are not informed by their ability to receive electrons from the occupied orbitals of Fe. Similarly, the values of the energy gap (ΔE) and the global hardness (η) often employed as indices of relative reactivity or stability of a molecule do not correlate with the observed η%. However, the values of the global electronegativity (χ) show that AAC-3 has the least tendency to hold on to its electrons or the highest propensity to release its electrons in a favorable donor–acceptor mechanism. The trend of the χ results is in complete agreement with the observed η%. The fraction of electrons transferred (ΔN) from an inhibitor molecule to the metal atom can be used as the gauge of the relative performance of a set of inhibitor molecules in electron transfer process. The results in Table 9 show that the trend of ΔN is AAC-3 > AAC-2 > AAC-1, which is in conformity with the trend of the observed η%. According to Gomez et al., the change in energy (ΔET) that accompanies the electron transfer process from an inhibitor to a metal atom can be used to predict the favorability of the donor–acceptor interactions between the interacting species. A negative value of ΔET though does not really predict the occurrence of back-donation; it is an indication that the charge transfer to a molecule, followed by a back-donation from the molecule is energetically favorable. Suppose there is any chance of charge transfer from Fe to the studied inhibitors and also retro-donation from the inhibitor molecules to the Fe, the more negative the value of ΔET the better the stabilization of the product of the donor–acceptor relationship. The results in Table 9 suggest that AAC-3 will form a more stable inhibitor–Fe complex compared to the AAC-1 and AAC-2, the trend of ΔET values is in agreement with the experimentally observed η%.
Table 9 Quantum chemical parameters derived from the B3LYP/6-31+G(d,p) method
| Inhibitors |
Parameters |
| EHOMO (eV) |
ELUMO (eV) |
ΔE (eV) |
η (eV) |
χ (eV) |
ΔN |
ΔET |
| AAC-1 |
−6.456 |
−2.584 |
3.872 |
1.936 |
4.520 |
0.640 |
−0.484 |
| AAC-2 |
−6.225 |
−2.257 |
3.968 |
1.984 |
4.241 |
0.695 |
−0.496 |
| AAC-3 |
−6.114 |
−2.121 |
3.993 |
1.996 |
4.117 |
0.722 |
−0.499 |
4. Conclusion
The effect of electron donating hydroxyl (–OH) and electron withdrawing nitro (–NO2) groups in 2-amino-4-arylquinoline-3-carbonitriles (AACs) was studied on the corrosion behavior of mild steel in 1 M HCl. The weight loss and electrochemical results suggest that the inhibition efficiency increases with increasing AACs concentrations. The EIS plots suggest that charge-transfer resistance of the corrosion process increases on increasing AACs concentration due to adsorption of these inhibitors at metal/electrolyte interfaces. The adsorption of the AACs on the mild steel surface obeyed the Langmuir adsorption isotherm. The values of activation energies suggested that AACs inhibit mild steel corrosion by forming a protective surface film at metal/electrolyte interfaces. The adsorbed layer of the AACs over the surface of mild steel has been furthermore conformed by SEM, EDX and AFM analysis. The experimental results were well supported by quantum chemical calculations.
References
- K. Zhang, B. Xu, W. Yang, X. Yin, Y. Liu and Y. Chen, Corros. Sci., 2015, 90, 284–295 CrossRef CAS PubMed.
- S. M. Shaban, I. Aiad, M. M. El-Sukkary, E. A. Soliman and M. Y. El-Awady, J. Mol. Liq., 2015, 203, 20–28 CrossRef CAS PubMed.
- A. A. Farag and T. A. Ali, J. Ind. Eng. Chem., 2015, 21, 627–634 CrossRef CAS PubMed.
- R. Hasanov, S. Bilge, S. Bilgiç, G. Gece and Z. Kılıç, Corros. Sci., 2010, 52, 984–990 CrossRef CAS PubMed.
- C. Verma, P. Singh, I. Bahadur, E. E. Ebenso and M. A. Quraishi, J. Mol. Liq., 2015, 209, 767–778 CrossRef CAS PubMed.
- M. A. Amin, Q. Mohsen and O. A. Hazzazi, Mater. Chem. Phys., 2009, 114, 908–914 CrossRef CAS PubMed.
- I. B. Obot, D. D. Macdonald and Z. M. Gasem, Corros. Sci. DOI:10.1016/j.corsci.2015.01.037.
- J. Aljourani, K. Raeissi and M. A. Golozar, Corros. Sci., 2009, 51, 1836–1843 CrossRef CAS PubMed.
- M. L. Zheludkevich, K. A. Yasakau and S. K. Poznyak, Corros. Sci., 2005, 47, 3368–3383 CrossRef CAS PubMed.
- F. Bentiss, M. Bouanis and B. Mernari, J. Appl. Electrochem., 2002, 32, 671–678 CrossRef CAS.
- Q. Qu, S. Jiang and W. Bai, Electrochim. Acta, 2007, 52, 6811–6820 CrossRef CAS PubMed.
- E. E. Ebenso, I. B. Obot and L. C. Murulana, Int. J. Electrochem. Sci., 2010, 5, 1574–1586 CAS.
- S. M. Li, H. R. Zhang and J. H. Liu, Trans. Nonferrous Met. Soc. China, 2007, 17, 318–325 CrossRef CAS.
- S. V. Lamaka, M. L. Zheludkevich and K. A. Yasakau, Electrochim. Acta, 2007, 52, 7231–7247 CrossRef CAS PubMed.
- G. Achary, H. P. Sachin and Y. A. Naik, Mater. Chem. Phys., 2008, 107, 44–50 CrossRef CAS PubMed.
- A. Popova, M. Christov and A. Vasilev, Corros. Sci., 2011, 53, 1770–1777 CrossRef CAS PubMed.
- M. K. Pavithra, T. V. Venkatesha and K. Vathsala, Corros. Sci., 2010, 52, 3811–3819 CrossRef CAS PubMed.
- X. Wang, H. Yang and F. Wang, Corros. Sci., 2012, 55, 145–152 CrossRef CAS PubMed.
- E. E. Ebenso, M. M. Kabanda, T. Arslan, M. Saracoglu, F. Kandemirli, L. C. Murulana, A. K. Singh, S. K. Shukla, B. Hammouti, K. F. Khaled, M. A. Quraishi, I. B. Obot and N. O. Eddy, Int. J. Electrochem. Sci., 2012, 5643–5676 CAS.
- C. Beattie, M. North and P. Villuendas, Molecules, 2011, 16, 3420–3432 CrossRef CAS PubMed.
- N. R. Agrawal, S. P. Bahekar, P. B. Sarode, S. S. Zade and H. S. Chandak, RSC Adv., 2015, 5, 47053–47059 RSC.
- T. P. Loh, L. C. Feng, H. Y. Yang and J. Y. Yang, Tetrahedron Lett., 2002, 43, 8741–8743 CrossRef CAS.
- R. A. Sheldon, Green Chem., 2005, 7, 267–278 RSC.
- A. K. Nezhad, S. Sarikhani, E. S. Shahidzadeh and F. Panahi, Green Chem., 2012, 14, 2876–2884 RSC.
- C. B. Verma, M. A. Quraishi and E. E. Ebenso, Int. J. Electrochem. Sci., 2013, 8, 7401–7413 CAS.
- C. B. Verma, M. J. Reddy and M. A. Quraishi, Anal. Bioanal. Electrochem., 2014, 6, 321–340 Search PubMed.
- A. D. Becke, J. Chem. Phys., 1993, 98, 5648–5652 CrossRef CAS PubMed.
- M. J. Frisch, G. W. Trucks, H. B. Schlegel, G. E. Scuseria, M. A. Robb, J. R. Cheeseman, G. Scalmani, V. Barone, B. Mennucci and G. A. Petersson, et al., Gaussian 09, Revision D.01, Gaussian, Inc., Wallingford CT, 2009 Search PubMed.
- S. Martinez, Mater. Chem. Phys., 2003, 77, 97–102 CrossRef CAS.
- L. O. Olasunkanmi, I. B. Obot, M. M. Kabanda and E. E. Ebenso, J. Phys. Chem. C, 2015, 119, 16004–16019 CAS.
- R. G. Pearson, Inorg. Chem., 1988, 27, 734–740 CrossRef CAS.
- B. Gomez, N. V. Likhanova, M. A. Dominguez, R. Martinez-Palou, A. Vela and J. L. Gazquez, J. Phys. Chem. B, 2006, 110, 8928–8934 CrossRef CAS PubMed.
- M. Yadav, D. Behera, S. Kumar and R. R. Sinha, Ind. Eng. Chem. Res., 2013, 52, 6318–6328 CrossRef CAS.
- A. Aouniti, K. Khaled and B. Hammouti, Int. J. Electrochem. Sci., 2013, 8, 5925–5943 CAS.
- L. Bai, L.-J. Feng, H.-Y. Wang, Y.-B. Lu, X.-W. Lei and F.-L. Bai, RSC Adv., 2015, 5, 4716–4726 RSC.
- D. K. Yadav and M. A. Quraishi, Ind. Eng. Chem. Res., 2012, 51, 14966–14979 CrossRef CAS.
- H. Ashassi-Sorkhabi, B. Shaabani and D. Seifzadeh, Appl. Surf. Sci., 2005, 239, 154–164 CrossRef CAS PubMed.
- N. A. Negm, M. F. Zaki, M. M. Said and S. M. Morsy, Corros. Sci., 2011, 53, 4233–4240 CrossRef CAS PubMed.
- S. Ghareba and S. Omanovic, Corros. Sci., 2010, 52, 2104–2113 CrossRef CAS PubMed.
- Y. Ait Albrimi, A. Ait Addi, J. Douch, R. M. Souto and M. Hamdani, Corros. Sci., 2015, 90, 522–528 CrossRef CAS PubMed.
- R. Yıldız, A. Doner, T. Dogan and I. Dehri, Corros. Sci., 2014, 82, 125–132 CrossRef PubMed.
- R. Yıldız, T. Dogan and I. Dehri, Corros. Sci., 2014, 85, 215–221 CrossRef PubMed.
- X. Li, S. Deng and H. Fu, Corros. Sci., 2011, 53, 302–309 CrossRef CAS PubMed.
- S. K. Saha, A. Dutta, P. Ghosh, D. Sukul and P. Banerjee, Phys. Chem. Chem. Phys., 2015, 17, 5679–5690 RSC.
- L. C. Murulana, M. M. Kabanda and E. E. Ebenso, RSC Adv., 2015, 5, 28743–28761 RSC.
- H. Z. Alkhathlan, M. Khan, M. M. S. Abdullah, A. M. AlMayouf, A. Yacine Badjah-Hadj-Ahmed, Z. A. AlOthman and A. A. Mousa, RSC Adv., 2015, 5, 54283–54292 RSC.
- B. Xu, Y. Ji, X. Zhang, X. Jin, W. Yang and Y. Chen, RSC Adv., 2015, 5, 56049–56059 RSC.
- B. D. Mert, A. O. Yüce, G. Kardas and B. Yazıcı, Corros. Sci., 2014, 85, 287–295 CrossRef CAS PubMed.
- P. Roy, P. Karfa, U. Adhikari and D. Sukul, Corros. Sci., 2014, 88, 246–253 CrossRef CAS PubMed.
- P. Mourya, S. Banerjee and M. M. Singh, Corros. Sci., 2014, 85, 352–363 CrossRef CAS PubMed.
- C. Verma, P. Singh and M. A. Quraishi, J. Assoc. Arab Univ. Basic Appl. Sci., 2015 DOI:10.1016/j.jaubas.2015.04.003.
- A. Yousefi, S. Javadian, N. Dalir, J. Kakemam and J. Akbari, RSC Adv., 2015, 5, 11697–11713 RSC.
- C. B. Verma, M. A. Quraishi and A. Singh, J. Taiwan Inst. Chem. Eng., 2015, 49, 229–239 CrossRef CAS PubMed.
- M. Kissi, M. Bouklah, B. Hammouti and M. Benkaddour, Appl. Surf. Sci., 2006, 252, 4190–4197 CrossRef CAS PubMed.
- E. Naderi, A. H. Jafari, M. Ehteshamzadeha and M. G. Hosseini, Mater. Chem. Phys., 2009, 115, 852 CrossRef CAS PubMed.
- H. M. A. El-Lateef, Corros. Sci., 2015, 92, 104–117 CrossRef PubMed.
- J. C. Liu, S. W. Park, S. Nagao, M. Nogi, H. Koga, J. S. Ma, G. Zhang and K. Suganuma, Corros. Sci., 2015, 92, 263–271 CrossRef CAS PubMed.
- M. Behpour, S. M. Ghoreishi, N. Soltani and M. Salavati-Niasari, Corros. Sci., 2009, 51, 1073–1082 CrossRef CAS PubMed.
- E. E. Ebenso, M. M. Kabanda, L. C. Murulana, A. K. Singh and S. K. Shukla, Ind. Eng. Chem. Res., 2012, 51, 12940–12958 CrossRef CAS.
- T. Arslan, F. Kandemirli, E. E. Ebenso, I. Love and H. Alemu, Corros. Sci., 2009, 51, 35–47 CrossRef CAS PubMed.
- F. Bentiss and M. Lagrenee, J. Mater. Environ. Sci., 2011, 2, 13–17 CAS.
- C. B. Verma, M. A. Quraishi and A. Singh, J. Taiwan Inst. Chem. Eng., 2015 DOI:10.1016/j.jtice.2015.06.020.
- C. Verma, A. Singh, G. Pallikonda, M. Chakravarty, M. A. Quraishi, I. Bahadur and E. E. Ebenso, J. Mol. Liq., 2015, 209, 306–319 CrossRef CAS PubMed.
|
| This journal is © The Royal Society of Chemistry 2015 |
Click here to see how this site uses Cookies. View our privacy policy here. ![[double bond, length as m-dash]](https://www.rsc.org/images/entities/char_e001.gif) C–, –N
C–, –N![[double bond, length as m-dash]](https://www.rsc.org/images/entities/char_e001.gif) N–) and π-electrons in form of double and triple bonds draw much attention due to their high adsorption tendency in addition to their ease and economic synthesis.6,7 Generally, N-heterocyclic inhibitors adsorb on metallic surface through unshared paired electrons of heteroatoms (N, O), conjugated double and/or triple bonds, and aromatic rings.8,9 The adsorption of the heterocyclics on metal surface is influenced by several factors such as presence of functional groups, electron density at donor heteroatoms (N, O, and S), and chemical structure.10,11 Quinoline and its derivative possess potential applications for synthesis of biologically important compounds such as DNA binding capabilities, antitumor and DNA-intercalating carrier.12 Previously, few reports have been published in which quinoline and its derivatives emphasized as useful metallic corrosion inhibitors.12–19
N–) and π-electrons in form of double and triple bonds draw much attention due to their high adsorption tendency in addition to their ease and economic synthesis.6,7 Generally, N-heterocyclic inhibitors adsorb on metallic surface through unshared paired electrons of heteroatoms (N, O), conjugated double and/or triple bonds, and aromatic rings.8,9 The adsorption of the heterocyclics on metal surface is influenced by several factors such as presence of functional groups, electron density at donor heteroatoms (N, O, and S), and chemical structure.10,11 Quinoline and its derivative possess potential applications for synthesis of biologically important compounds such as DNA binding capabilities, antitumor and DNA-intercalating carrier.12 Previously, few reports have been published in which quinoline and its derivatives emphasized as useful metallic corrosion inhibitors.12–19


![[thin space (1/6-em)]](https://www.rsc.org/images/entities/char_2009.gif) CR versus 1/T. The values of activation energy (Ea) for mild steel dissolution were calculated from the slopes (−ΔEa/2.303R) of the Arrhenius plots and given in Table 4. From the results depicted in Table 4 it is seen that values of apparent activation energies are higher in presence of AACs than in their absence (28.48 kJ mol−1). The higher values of apparent activation energy for AAC-1 (71.40 kJ mol−1), AAC-2 (73.73 kJ mol−1) and AAC-3 (75.65 kJ mol−1) indicated the formation of energy barrier for mild steel dissolution in presence of AACs.36 Further, it is assume that electrostatic interaction (physical adsorption) between charged inhibitors and metal surface might cause increase in the values of apparent activation energy in presence of AACs.37
CR versus 1/T. The values of activation energy (Ea) for mild steel dissolution were calculated from the slopes (−ΔEa/2.303R) of the Arrhenius plots and given in Table 4. From the results depicted in Table 4 it is seen that values of apparent activation energies are higher in presence of AACs than in their absence (28.48 kJ mol−1). The higher values of apparent activation energy for AAC-1 (71.40 kJ mol−1), AAC-2 (73.73 kJ mol−1) and AAC-3 (75.65 kJ mol−1) indicated the formation of energy barrier for mild steel dissolution in presence of AACs.36 Further, it is assume that electrostatic interaction (physical adsorption) between charged inhibitors and metal surface might cause increase in the values of apparent activation energy in presence of AACs.37

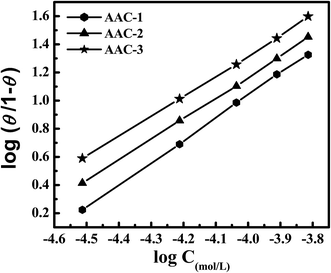
![[thin space (1/6-em)]](https://www.rsc.org/images/entities/char_2009.gif) θ/1 − θ versus log
θ/1 − θ versus log![[thin space (1/6-em)]](https://www.rsc.org/images/entities/char_2009.gif) C (mol L−1). The values of free energy of adsorption (ΔG0ads) can be calculated using eqn (11). In this equation numerical value of 55.5 represents the molar concentration of water in acid solution:
C (mol L−1). The values of free energy of adsorption (ΔG0ads) can be calculated using eqn (11). In this equation numerical value of 55.5 represents the molar concentration of water in acid solution:![[thin space (1/6-em)]](https://www.rsc.org/images/entities/char_2009.gif) ln(55.5Kads)
ln(55.5Kads)


![[thin space (1/6-em)]](https://www.rsc.org/images/entities/char_2009.gif) f, with slop values close to −1 and the phase angle value tends to become −70°, were observed. This is a characteristics response of capacitive behavior. An ideal capacitor is associated with slope value of −1 and phase angle value of −90°.56 The deviation from ideal capacitive behavior in the presence study is attributed due to rough working electrode surface resulted due to corrosion. The careful examination of the Bode plots reveal that the values of phase angle significantly increased and therefore, surface roughness remarkably decreased in presence of AACs due to formation of protective surface film.57 Further, Bode plots give one time constant, sigma maxima in the intermediate frequency region. The broadening of this maximum in the Bode plots is attributed due to the adsorption and formation of protective film by inhibitors at the metal/electrolyte interface.58
f, with slop values close to −1 and the phase angle value tends to become −70°, were observed. This is a characteristics response of capacitive behavior. An ideal capacitor is associated with slope value of −1 and phase angle value of −90°.56 The deviation from ideal capacitive behavior in the presence study is attributed due to rough working electrode surface resulted due to corrosion. The careful examination of the Bode plots reveal that the values of phase angle significantly increased and therefore, surface roughness remarkably decreased in presence of AACs due to formation of protective surface film.57 Further, Bode plots give one time constant, sigma maxima in the intermediate frequency region. The broadening of this maximum in the Bode plots is attributed due to the adsorption and formation of protective film by inhibitors at the metal/electrolyte interface.58


