
Synthesis and serum protein binding of novel ring-substituted harmine derivatives†
Celesztina Domonkosa,
Ferenc Zsila*a,
Ilona Fitosa,
Júlia Visya,
Rudolf Kassaib,
Balázs Bálintb and
András Kotschyb
aResearch Group of Chemical Biology, Institute of Organic Chemistry, Research Centre for Natural Sciences, Hungarian Academy of Sciences, POB 289, H-1519, Budapest, Hungary. E-mail: zsila.ferenc@ttk.mta.hu
bServier Research Institute of Medicinal Chemistry, Záhony utca 7, H-1031, Budapest, Hungary
First published on 10th June 2015
Abstract
A series of new derivatives of the natural β-carboline alkaloid harmine, introducing hydrophobic substituents into positions 7 and 9 were synthesized as potential anticancer agents. Their binding affinities for human serum albumin (HSA) and α1-acid glycoprotein (AAG) were investigated by affinity chromatography combined with fluorescence, circular dichroism (CD) and UV absorption spectroscopy. The weak binding of harmine to both proteins (Ka ∼ 3 × 10⁴ M−1) was highly increased by aromatic substitutions (Ka ∼ 105–106 M−1). Derivatives having a substituted benzyl group in the N9-position of the β-carboline nucleus showed about tenfold and hundredfold affinity enhancement for HSA and AAG, respectively. Such a strong plasma protein interaction would be of pharmacokinetic relevance for these potential drug candidates. Induced CD spectra indicated the variant selective, dimeric binding of the 7-pyridylethoxy derivative to AAG. Absorbance and fluorescence spectra refer to the binding preference of the neutral form of the studied β-carbolines for both proteins.
Introduction
Harmine, possessing a tricyclic pyrido[3,4-b]indole ring structure, is a representative member of the naturally occurring β-carboline alkaloids. It was originally isolated from the seed of Peganum harmala and widely utilized for hundreds of years in traditional Chinese medicine to treat alimentary tract cancer and malaria.1 This herbal substance is of great interest due to its diverse biochemical activities including DNA intercalation,1,2 inhibition of topoisomerase1 and cyclin-dependent kinases.1,3 Several studies demonstrated that it inhibits selectively monoamine oxidases,4 which play a key role in psychiatric and neurological disorders5 (depression and Parkinson's diseases). Harmine was also identified as a potential inhibitor of the kinase Dyrk1A that is implicated in the pathogenesis of Down syndrome,6 a common hereditary disorder.In the past, numerous studies investigated the effect of harmine on the central nervous system such as its interaction with benzodiazepine, 5-HT2A, 5HT2C and imidazoline receptors. Recently, however, harmine and its ring-substituted derivatives attracted attention as potential cancer drugs. Ishida et al. evaluated7 the change in the antitumor activity of this alkaloid on the introduction of various substituents onto the β-carboline skeleton at positions 1, 2, 6, 7, and 9. Structure–activity relationship studies indicated that upon incorporation of appropriate alkyl and aralkyl groups in position 9, the antitumor effect of harmine against Lewis lung cancer and sarcoma 180 was dramatically enhanced. It was also proved8,9 that the neurotoxic side effect of these compounds can be decreased by replacing methoxy group at position 7. We performed the synthesis of a series of 7- and 9-substituted harmine derivatives (Scheme 1) in order to study their interaction with human serum proteins.
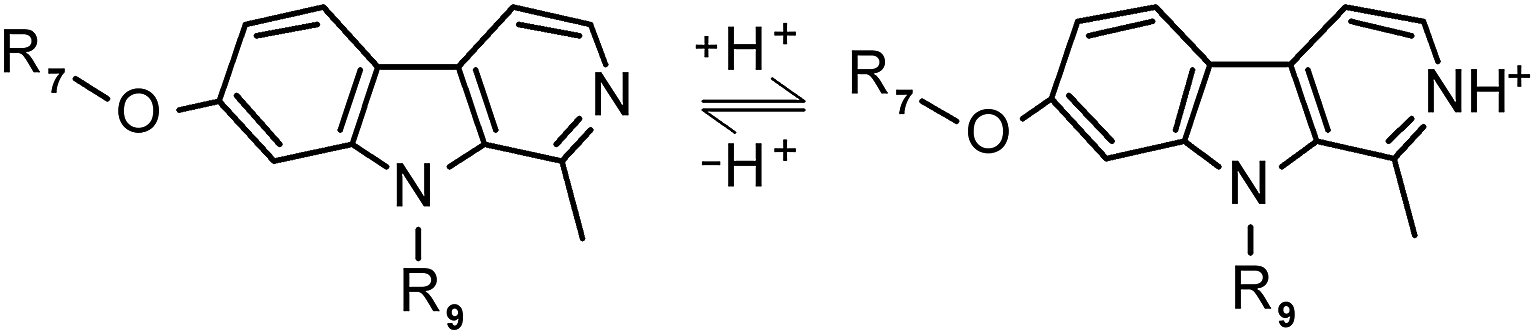 | ||
| Scheme 1 General chemical structure of harmine (R7: Me and R9: H) and its derivatives showing the equilibrium between the protonated and nonprotonated forms (the pKa of harmine is 7.45). The R7 and R9 notations represent the frequently substituted positions. | ||
Binding of drugs10 and natural products11,12 to blood plasma proteins influences their pharmacokinetic and pharmacodynamic action. Among human serum proteins, the most abundant albumin component (HSA) is of the highest importance,13,14 but no data are available on the harmine–HSA interaction. HSA binding of the related β-carboline compound harmane (R7: H) was found to be weak15 (Ka ∼ 2.4 × 10⁴ M−1), while the binding of norharmane, lacking 1-methyl substitution, is much more pronounced (Ka ∼ 1.7 × 10⁵ M−1). Besides HSA, α1-acid glycoprotein (AAG) also plays a decisive role in the binding and transportation of a broad array of basic and neutral drug molecules.16,17 AAG association of β-carbolines has not been evaluated though these molecules exist as a mixture of neutral and cationic forms at physiological pH. Thus, in this work we studied the binding of harmine and its derivatives to HSA and AAG. Since plasma AAG is a mixture of two main genetic variants with different drug binding abilities,18–21 the separated F1/S and A genetic variants were tested as well. The applied experimental methodologies include affinity chromatography, as well as fluorescence, circular dichroism, and UV absorption spectroscopic techniques.
Experimental details
General methods
1H, 13C and 19F NMR spectra were recorded on a Bruker Avance III 500 instrument. Chemical shifts are given in parts per million (ppm) and spectra are obtained as DMSO-d6 or CDCl3 solutions, using chloroform (7.26 ppm) or DMSO-d6 (2.50 ppm) as the reference standard. The following abbreviations are used to denote signal multiplicities: s = singlet, d = doublet, t = triplet, m = multiplet, and br = broadened. All coupling constants (J) are given in hertz (Hz). Analytical HPLC was performed on Agilent 1200 Series utilizing Waters Acquity UPLC BEH C18, 2.1 × 30 mm, 1.7 μm column (solvent A: 100![[thin space (1/6-em)]](https://www.rsc.org/images/entities/char_2009.gif) :2:0.1 H2O/ACN/MeSO3H, solvent B: 100:2:0.1 ACN/H2O/MeSO3H, gradient: 0 min 0% B, 6 min 100%, 7 min 100%, 7.5 min 0%, 9 min 0%, flow: 0.8 mL min−1) and UV detection at 210 nm. High resolution mass spectrometric identification of compounds was performed using SHIMADZU LCMS-IT-TOF ESI, WATERS SUNFIRE C18, 2.1 × 50 mm, 2.5 μm column (solvent A: 100:3 H2O/2-PrOH + 0.05% HCOOH, solvent B: 95:5:3 H2O/ACN/2-PrOH + 0.05% HCOOH, gradient: 0 min 0% B, 9 min 100%, 11 min 100%, 11.1 min 0%, 15 min 0%, flow: 0.7 mL min−1). Flash chromatography was performed on Teledyne ISCO CombiFlashRF instrument, using RediSept RF pre-packed silica gel columns and UV detection at 254 or 210 nm. Reagents and solvents were used as obtained from commercial suppliers without further purification. Yields refer to purified products and are not optimized. All tested compounds were >95% pure as assessed by LCMS and 1H NMR.
:2:0.1 H2O/ACN/MeSO3H, solvent B: 100:2:0.1 ACN/H2O/MeSO3H, gradient: 0 min 0% B, 6 min 100%, 7 min 100%, 7.5 min 0%, 9 min 0%, flow: 0.8 mL min−1) and UV detection at 210 nm. High resolution mass spectrometric identification of compounds was performed using SHIMADZU LCMS-IT-TOF ESI, WATERS SUNFIRE C18, 2.1 × 50 mm, 2.5 μm column (solvent A: 100:3 H2O/2-PrOH + 0.05% HCOOH, solvent B: 95:5:3 H2O/ACN/2-PrOH + 0.05% HCOOH, gradient: 0 min 0% B, 9 min 100%, 11 min 100%, 11.1 min 0%, 15 min 0%, flow: 0.7 mL min−1). Flash chromatography was performed on Teledyne ISCO CombiFlashRF instrument, using RediSept RF pre-packed silica gel columns and UV detection at 254 or 210 nm. Reagents and solvents were used as obtained from commercial suppliers without further purification. Yields refer to purified products and are not optimized. All tested compounds were >95% pure as assessed by LCMS and 1H NMR.
Synthesis of compounds
[1]: 7-isopropoxy-1-methyl-9H-pyrido[3,4-b]indole. Using 120 mg 2-propanol 44 mg 1 (37%) was obtained. 1H NMR (500 MHz, DMSO-d6) δ 11.35 (s, 1H), 8.13 (d, J = 5.3 Hz, 1H), 8.03 (d, J = 8.5 Hz, 1H), 7.79 (d, J = 5.3 Hz, 1H), 6.98 (d, J = 2.2 Hz, 1H), 6.81 (dd, J = 8.5, 2.2 Hz, 1H), 4.27 (sp, J = 6.0 Hz, 1H), 2.71 (s, 3H), 1.33 (d, J = 6.0 Hz, 6H); 13C NMR (125 MHz, DMSO-d6) δ 158.6, 142.4, 141.7, 138.2, 135.0, 127.7, 123.1, 115.2, 112.4, 110.7, 97.1, 70.0, 23.3, 20.8; HRMS calculated for C15H16N2O: 240.1263; found 241.1329 (M + H).
[2]: 1-methyl-7-(1-phenylethoxy)-9H-pyrido[3,4-b]indole. Using 244 mg rac-1-phenylethanol and 3 equivalent cyanomethylenetributylphosphorane instead of PPh3 and diethyl azodicarboxylate 91 mg 2 (60%) was obtained. 50 mg of the racemate was separated via chiral chromatography using Chiralpak AD column and ethanol/heptane (5
:95) eluent. 2a refers to the earlier eluting enantiomer.
2a. 24 mg; retention time: 76 min; 1H NMR (500 MHz, DMSO-d6) δ 11.30 (s, 1H), 8.11 (d, J = 5.3 Hz, 1H), 7.99 (d, J = 8.5 Hz, 1H), 7.75 (d, J = 5.3 Hz, 1H), 7.46 (d, J = 8.3 Hz, 2H), 7.36 (t, J = 7.7 Hz, 2H), 7.25 (t, J = 7.3 Hz, 1H), 6.89 (d, J = 2.1 Hz, 1H), 6.87 (dd, J = 8.5, 2.1 Hz, 1H), 5.60 (q, J = 6.4 Hz, 1H), 2.66 (s, 3H), 1.61 (d, J = 6.4 Hz, 3H); 13C NMR (125 MHz, DMSO-d6) δ 158.6, 143.6, 142.0, 141.7, 138.2, 134.9, 129.1, 127.9, 127.5, 126.1, 123.0, 115.3, 112.4, 110.8, 97.5, 75.7, 25.0, 20.7.
2b. 23 mg; retention time: 112 min; 1H NMR (500 MHz, DMSO-d6) δ 11.30 (s, 1H), 8.11 (d, J = 5.3 Hz, 1H), 7.99 (d, J = 8.5 Hz, 1H), 7.75 (d, J = 5.3 Hz, 1H), 7.46 (d, J = 8.3 Hz, 2H), 7.36 (t, J = 7.7 Hz, 2H), 7.25 (t, J = 7.3 Hz, 1H), 6.89 (d, J = 2.1 Hz, 1H), 6.87 (dd, J = 8.5, 2.1 Hz, 1H), 5.60 (q, J = 6.4 Hz, 1H), 2.66 (s, 3H), 1.61 (d, J = 6.4 Hz, 3H); 13C NMR (125 MHz, DMSO-d6) δ 158.6, 143.6, 142.0, 141.7, 138.2, 134.9, 129.1, 127.9, 127.5, 126.1, 123.0, 115.3, 112.4, 110.8, 97.5, 75.7, 25.0, 20.7.
[3]: 1-methyl-7-(2-pyridylmethoxy)-9H-pyrido[3,4-b]indole. Using 218 mg 2-pyridinemethanol 120 mg 3 (92%) was obtained. 1H NMR (500 MHz, DMSO-d6) δ 11.40 (s, 1H), 8.60 (d, J = 4.6 Hz, 1H), 8.13 (d, J = 5.3 Hz, 1H), 8.06 (d, J = 8.7 Hz, 1H), 7.83 (t, J = 7.6 Hz, 1H), 7.79 (d, J = 5.3 Hz, 1H), 7.55 (d, J = 7.9 Hz, 1H), 7.35 (t, J = 6.2 Hz, 1H), 7.06 (d, J = 1.6 Hz, 1H), 6.94 (dd, J = 8.7, 1.6 Hz, 1H), 5.30 (s, 2H), 2.69 (s, 3H); 13C NMR (125 MHz, DMSO-d6) δ 159.3, 157.2, 149.6, 142.2, 141.8, 138.2, 137.5, 135, 127.6, 123.5, 123.2, 122.1, 115.6, 112.5, 110.1, 96.3, 71.0, 20.7; HRMS calculated for C18H15N3O: 289.1215; found 290.1287 (M + H).
[4]: 1-methyl-7-[2-(2-pyridyl)ethoxy]-9H-pyrido[3,4-b]indole. Using 244 mg 2-(2-hydroxyethyl)pyridine 121 mg 4 (79%) was obtained. 1H NMR (500 MHz, DMSO-d6) δ 11.36 (s, 1H), 8.52 (d, J = 4.7 Hz, 1H), 8.22 (m, 1H), 8.12 (d, J = 5.3 Hz, 1H), 8.01 (d, J = 8.6 Hz, 1H), 7.78 (d, J = 5.3 Hz, 1H), 7.74 (td, J = 7.6, 1.7 Hz, 1H), 7.40 (d, J = 7.6 Hz, 1H), 7.25 (dd, J = 7.3, 5.3 Hz, 1H), 7.01 (d, J = 2.1 Hz, 1H), 6.80 (dd, J = 8.6, 2.1 Hz, 1H), 4.47 (t, J = 6.5 Hz, 2H), 3.25 (t, J = 6.5 Hz, 2H), 2.70 (s, 3H). 13C NMR (125 MHz, DMSO-d6) δ 159.6, 149.6, 142.3, 141.7, 138.2, 137.0, 135.0, 127.6, 124.1, 123.1, 122.2, 115.4, 112.4, 109.8, 95.8, 67.4, 37.6, 20.8; HRMS calculated for C19H17N3O: 303.1372; found 304.1437 (M + H).
[5]: 9-benzyl-7-methoxy-1-methyl-pyrido[3,4-b]indole. Using 94 mg benzyl bromide 110 mg 5 (73%) was obtained; 1H NMR (500 MHz, DMSO-d6) δ 8.18 (d, J = 5.1 Hz, 1H), 8.15 (d, J = 8.6 Hz, 1H), 7.93 (d, J = 5.1 Hz, 1H), 7.28 (t, J = 7.4 Hz, 2H), 7.22 (t, J = 7.4 Hz, 1H), 7.19 (d, J = 2.1 Hz, 1H), 6.92 (d, J = 7.4 Hz, 2H), 6.90 (dd, J = 8.6, 2.1 Hz, 1H), 5.89 (s, 2H), 3.82 (s, 3H), 2.73 (s, 3H); 13C NMR (125 MHz, DMSO-d6) δ 161.2, 143.8, 141.3, 139.5, 138.6, 135.4, 129.3, 129.0, 127.6, 125.8, 123.0, 114.7, 112.8, 109.9, 94.2, 56.1, 47.7, 23.2. HRMS calculated for C20H18N2O: 302.1419; found 303.1487 (M + H).
[6]: 7-methoxy-9-[(3-methoxyphenyl)methyl]-1-methyl-pyrido[3,4-b]indole. Using 111 mg 3-methoxybenzyl bromide 107 mg 6 (64%) was obtained; 1H NMR (500 MHz, DMSO-d6) δ 8.18 (d, J = 5.2 Hz, 1H), 8.15 (d, J = 8.6 Hz, 1H), 7.93 (d, J = 5.2 Hz, 1H), 7.18 (d, J = 2.1 Hz, 1H), 7.18 (m, 1H), 6.90 (dd, J = 8.6, 2.1 Hz, 1H), 6.80 (m, 1H), 6.51 (m, 1H), 6.41 (m, 1H), 5.85 (s, 2H), 3.83 (s, 3H), 3.65 (s, 3H), 2.74 (s, 3H); 13C NMR (125 MHz, DMSO-d6) δ 161.2, 160.0, 143.8, 141.3, 141.2, 138.6, 135.4, 130.5, 129.0, 123.0, 117.8, 114.6, 112.8, 112.4, 112.0, 109.9, 94.2, 56.1, 55.4, 47.6, 23.2; HRMS calculated for C21H20N2O2: 332.1525; found 333.1583 (M + H).
[7]: 7-methoxy-1-methyl-9-[[4-(trifluoromethyl)phenyl]methyl]pyrido[3,4-b]indole. Using 131 mg 4-(trifluoromethyl)benzyl bromide 153 mg 7 (83%) was obtained; 1H NMR (500 MHz, DMSO-d6) δ 8.20 (d, J = 5.2 Hz, 1H), 8.17 (d, J = 8.6 Hz, 1H), 7.95 (d, J = 5.2 Hz, 1H), 7.68 (d, J = 8.1 Hz, 2H), 7.21 (d, J = 2.1 Hz, 1H), 7.16 (d, J = 8.1 Hz, 2H), 6.92 (dd, J = 8.6, 2.1 Hz, 1H), 6.01 (s, 2H), 3.82 (s, 3H), 2.70 (s, 3H); 13C NMR (125 MHz, DMSO-d6) δ 161.3, 144.5, 143.7, 141.2, 138.8, 135.2, 129.2, 128.2, 126.7, 126.3, 124.7, 123.1, 114.7, 112.9, 110.1, 94.1, 56.1, 47.4, 23.1; HRMS calculated for C21H17F3N2O: 370.1293; found 371.1362 (M + H).
[8]: 7-methoxy-1-methyl-9-[1-[4-(trifluoromethyl)phenyl]ethyl]pyrido[3,4-b]indole. Using 139 mg rac-1-(1-bromoethyl)-4-(trifluoromethyl)benzene 180 mg 8 was obtained. HRMS calculated for C22H19F3N2O: 384.1449; found 385.1513 (M + H). The racemate was separated via chiral chromatography using Chiralcel OK column and EtOH/heptane (30
:70) eluent. 8a was isolated as the first eluting enantiomer.
8a. 85 mg (44%); retention time: 32 min; 1H NMR (500 MHz, DMSO-d6) δ 8.26 (d, J = 5.2 Hz, 1H), 8.13 (d, J = 8.7 Hz, 1H), 7.95 (d, J = 5.2 Hz, 1H), 7.74 (d, J = 8.2 Hz, 2H), 7.52 (d, J = 8.2 Hz, 2H), 6.84 (dd, J = 8.7, 2.1 Hz, 1H), 6.65 (q, J = 7.0 Hz, 1H), 6.4 (br, 1H), 3.62 (s, 3H), 2.91 (br, 3H), 2.01 (d, J = 7.0 Hz, 3H); 13C NMR (125 MHz, DMSO-d6) δ 160.0, 146.5, 141.2, 140.9, 138.7, 135.9, 129.2, 128.3, 127.8, 126.0, 123.1, 116.1, 112.9, 109.2, 96.9, 55.6, 53.6, 24.7, 18.1;
8b. 87 mg (45%); retention time: 42 min; 1H NMR (500 MHz, DMSO-d6) δ 8.26 (d, J = 5.2 Hz, 1H), 8.13 (d, J = 8.7 Hz, 1H), 7.95 (d, J = 5.2 Hz, 1H), 7.74 (d, J = 8.2 Hz, 2H), 7.52 (d, J = 8.2 Hz, 2H), 6.84 (dd, J = 8.7, 2.1 Hz, 1H), 6.65 (q, J = 7.0 Hz, 1H), 6.4 (br, 1H), 3.62 (s, 3H), 2.91 (br, 3H), 2.01 (d, J = 7.0 Hz, 3H); 13C NMR (125 MHz, DMSO-d6) δ 160.0, 146.5, 141.2, 140.9, 138.7, 135.9, 129.2, 128.3, 127.8, 126.0, 123.1, 116.1, 112.9, 109.2, 96.9, 55.6, 53.6, 24.7, 18.1;
[9]: 7-methoxy-1-methyl-9-[2-[4-(trifluoromethyl)phenyl]ethyl]pyrido[3,4-b]indole. 106 mg harmine (0.50 mmol), 85 mg 4′-trifluoromethylphenyl acetylene (0.50 mmol) and 3 mg (0.05 mmol) KOH were dissolved in 1 mL dry dimethyl sulfoxide. The solution was stirred at 130 °C until no further conversion was observed. After the completion of the reaction the product was purified via preparative reversed phase chromatography using 5 mM aqueous NH4HCO3 solution and acetonitrile as eluents. The obtained intermediate (117 mg) was dissolved in ethanol and 10 w/w% Pd/C was added. The reaction was run until completion in a pressure-boiler under 5 bar H2 at rt. The mixture was filtered and the filtrate evaporated to give 77 mg 9 (40% for 2 steps) in sufficient purity.1H NMR (500 MHz, DMSO-d6) δ 8.19 (d, J = 5.3 Hz, 1H), 8.09 (d, J = 8.5 Hz, 1H), 7.93 (d, J = 5.3 Hz, 1H), 7.59 (d, J = 8.0 Hz, 2H), 7.43 (d, J = 8.0 Hz, 2H), 7.04 (d, J = 2.1 Hz, 1H), 6.84 (dd, J = 8.2, 2.1 Hz, 1H), 4.84 (t, J = 7.4 Hz, 2H), 3.84 (s, 3H), 3.17 (t, J = 7.4 Hz, 2H), 2.97 (s, 3H); 13C NMR (125 MHz, DMSO-d6) δ 161.1, 143.8, 143.3, 140.9, 137.8, 134.9, 130.4, 129.3, 127.7, 125.6, 122.9, 114.5, 112.9, 110.1, 94.1, 55.9, 45.6, 36.3, 23.3; HRMS calculated for C22H19F3N2O: 384.1449; found 385.1520 (M + H).
Preparation of ligand and protein sample solutions
The 2 mM stock solutions of β-carbolines were prepared freshly before each measurement in dioxane or in the EtOH/water mixture. The volume of dioxane or EtOH added into sample solutions never exceeded 5% (v/v) and caused negligible effects on the CD or fluorescence spectra. HSA (Sigma, 97%, essentially fatty acid-free) and AAG (Sigma) samples were dissolved in pH 7.4 Ringer buffer solution (8.1 mM Na2HPO4·12H2O, 1.5 mM KH2PO4, 137 mM NaCl, 2.7 mM KCl, 0.8 mM CaCl2, 1.1 mM MgCl2). Genetic variants of AAG were separated following the chromatographic method of Hervé et al. as described previously.18HSA binding test by affinity chromatography
Chromatographic experiments on HSA–Sepharose gel were performed as described previously, using oxazepam acetate, lorazepam acetate enantiomers and diazepam as reference compounds.23 Elution volume of harmine and its derivatives were detected at 280 nm. Control experiments were performed on a gel containing no HSA. Compounds 2 and 7–9 showed some non-specific adsorption.Fluorescence spectroscopic measurements
Fluorescence measurements were carried out in a JASCO FP 8300 spectrofluorimeter at 23 ± 1 °C, using a quartz cuvette with 1 cm optical path length; both excitation and emission bandwidths were set at 5 nm. The β-carbolines were excited at 320 nm. Intensities were corrected for the inner filter effect according to the absorbance of the added alkaloids at both the excitation and the emission wavelengths. The association binding constants at 1:1 stoichiometry were calculated from the fluorescence emission increase of the protein bound alkaloids using the following equation (non-linear regression analysis with Microcal Origin ver. 8.6):where [P]t,[L]t are the total concentration of the protein and ligand; fp, fl, fpl are the specific fluorescence of the protein, ligand and complex.24

Circular dichroism and UV absorption spectroscopy measurements
CD and UV absorption spectra were recorded on a JASCO J-715 spectropolarimeter at 25 ± 0.2 °C. Temperature control was provided by a Peltier thermostat equipped with magnetic stirring. Rectangular quartz cells of a 1 cm optical path length (Hellma, USA) were used. Each spectrum represents the average of three scans obtained by collecting data at a scan speed of 100 nm min−1. Absorption spectra were obtained by conversion of the high voltage (HT) values of the photomultiplier tube of the CD equipment into absorbance units. CD and absorption curves of ligand–protein mixtures were corrected by subtracting the spectra of ligand-free protein solutions. JASCO CD spectropolarimeters record CD data as ellipticity (Θ) in units of millidegrees (mdeg). Details of the estimation of the association constant (Ka) and the number of binding sites (n) using CD spectroscopic data have been described elsewhere.25 Non-linear regression analysis of the induced CD values measured at increasing [ligand]/[protein] molar ratios was performed by Microcal Origin 8.6 Pro (OriginLab Corporation, Northhampton, MA).Molecular docking calculations
All calculations were performed using DockingServer.26 PM6 semi-empirical method (MOPAC2009) was used for energy minimization and partial charges calculation to the neutral form of compound 4. X-ray structure of the A variant of AAG (PDB code 3APU) was selected. All water molecules were removed from the protein coordinates prior to docking calculations. Hydrogen atoms were added to the PDB structure using AutoDockTools. The total charge of AAG and partial charges of the atoms were calculated by the Mozyme function of MOPAC2009 software. The calculated partial charges were applied for further calculations. Sequential ligand docking was carried out, initial position and orientation of compound 4 were set randomly. The first molecule was docked using a pre-evaluated interaction grid based on interactions with atoms in the protein alone. The second ligand was then docked employing an interaction grid including interactions with the protein and bound configurations of the first ligand. Affinity (grid) maps of 25 × 25 × 25 Å grid points were generated using the Autogrid program. AutoDock parameter set- and distance-dependent dielectric functions were used in the calculation of the van der Waals and the electrostatic terms, respectively. Docking simulations were performed using the Lamarckian genetic algorithm and the Solis & Wets local search method. Each docking experiment was derived from 100 different runs which were set to terminate after a maximum of 2500000 energy evaluations. The population size was set to 150. During the search, a translational step of 0.2 Å, and quaternions and torsion steps of 5 were applied. The outputs of docking calculations were rendered with PyMOL (The PyMOL Molecular Graphics System, DeLano Scientific LLC, Palo Alto, CA, USA. http://www.pymol.org).
pKa prediction
Calculator Plugin of the software MarvinSketch version 6.3.0 (2014, ChemAxon, http://www.chemaxon.com) was used to estimate the pKa values of harmine and its synthetic derivatives.Results and discussion
HSA binding studies by affinity chromatography
HSA interaction of harmine and its nine synthetic analogues were evaluated from their retentions on a HSA–Sepharose column, where the elution volume is characteristic of the overall binding affinity (∑nKa). Results showed that harmine binds weakly to HSA (Ka ∼ 2.5 × 10⁴ M−1) and the methoxy-isopropyloxy group replacement (compound 1) caused only a slight affinity increase (Table 1). A similar result (Ka ∼ 2.4 × 10⁴ M−1) was found for the HSA binding of harmane15 which lacks a methoxy substituent of harmine. For harmine–bovine serum albumin interaction also weak binding was reported (Ka ∼ 2.0 × 10⁴ M−1).27 Introducing aromatic substituents in position 7, however, resulted in considerably enhanced albumin binding affinities. Compound 2 showed about ten times stronger association compared to harmine, without significant enantioselectivity. In case of compounds 3 and 4 having a pyridine ring in their R7 substituent, the Ka values are only about four times higher than that of harmine. Aromatic substitution on the pyrrole nitrogen provoked even stronger enhancement, association constant values of compounds 5–9 are about 4.0 × 10⁵ M−1. The enantiomers of compound 8 showed no stereospecific binding, either. The enhanced HSA affinity of the more hydrophobic harmine derivatives may be beneficial since the overall solubility of the drugs in plasma will increase. Furthermore, tight albumin association may improve the chemical as well as the metabolic stability of the alkaloids28 and can facilitate their uptake in growing tumor tissues where albumin molecules are increasingly taken up by cancer cells.29 However, the efficacy of drugs can be compromised by extensive HSA binding since only the unbound fraction exhibits pharmacologic effects. The highest HSA affinity constants obtained in this study predict no serious limitation for the pharmacological activity of the harmine derivates that is also impacted by other factors such as tissue binding, stability, and clearance.30,31| Compound | Substituent | Ka (M−1) | ||
|---|---|---|---|---|
| R7 | R9 | HSA (ac) | AAG (fl) | |
| a The assignment of the chirality is arbitrary and it is only used to denote the stereochemical relationship of compounds 2a–2b and 8a–8b. | ||||
| Harmine | Me | H | 2.5 × 10⁴ | 3.3 × 10⁴ |
| 1 |  |
H | 3.5 × 10⁴ | n.d. |
| 2aa |  |
H | 2.2 × 10⁵ | 1.3 × 10⁵ |
| 2ba |  |
H | 2.7 × 10⁵ | 1.3 × 10⁵ |
| 3 |  |
H | 9.0 × 10⁴, 8.4 × 10⁴ (fl) | 3.3 × 10⁵ |
| 4 |  |
H | 9.0 × 10⁴, 9.4 × 10⁴ (fl) | 4.1 × 10⁵ (F1/S) (cd), 3.4 × 10⁵ (A) (cd) |
| 5 | Me |  |
4.0 × 10⁵, 7.2 × 10⁵ (fl) | 1.6 × 10⁶ |
| 6 | Me |  |
4.3 × 10⁵, 4.0 × 10⁵ (fl) | 8.0 × 10⁵ |
| 7 | Me | 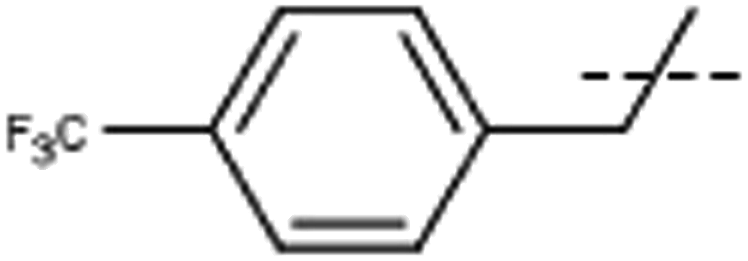 |
4.0 × 10⁵, 3.1 × 10⁵ (fl) | 4.1 × 10⁶ (F1/S), 3.9 × 10⁵ (A) |
| 8aa | Me | 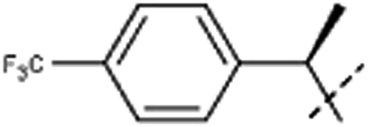 |
3.9 × 10⁵, 2.1 × 10⁵ (fl) | 1.2 × 10⁶ |
| 8ba | Me | 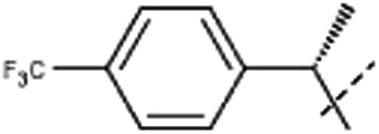 |
3.5 × 10⁵ | 7.0 × 10⁵ |
| 9 | Me | 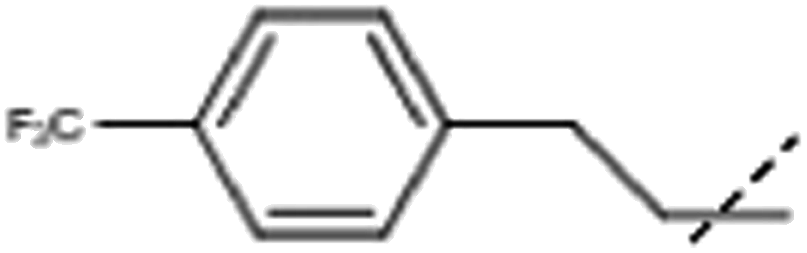 |
3.2 × 10⁵, 1.1 × 10⁵ (fl) | 2.8 × 10⁶ |
Protein binding studies by fluorescence spectroscopy
Harmine and its derivatives, like other β-carbolines, are highly fluorescent compounds. Fluorescence properties of the cationic and neutral forms are different, and this phenomenon can be utilized in protein binding studies, as shown previously for the HSA association of harmane and norharmane.15,28 The cationic species fluoresces strongly with a peak maximum centred ∼430 nm while the blue shifted emission of the neutral molecules is much weaker centered around 350 nm. The experimentally determined pKa of harmine is 7.45.32 The use of this value in the Henderson–Hasselbalch equation at pH 7.4 gives rise to 53 and 47 per cent for the neutral and cationic form of harmine, respectively. Since the protonation constants of the synthetic derivatives are unknown, calculated pKa values are shown in the ESI.† As expected, the substitutions made in the 7 and 9 positions do not alter significantly the basicity of the pyridine nitrogen suggesting very similar neutral–cationic equilibrium for the derivatives. The fluorescence approach was employed to investigate the AAG binding properties of harmine and its derivatives. Fig. 1 shows the change of the fluorescence emission of harmine upon addition of AAG. The ligand solution at pH 7.4 displays a single, unstructured band at 421.5 nm, assigned to the emission of the cationic form due to the well-studied excited state pKa shift of β-carbolines.33 Increasing concentration of AAG induces intensity decrease with simultaneous development of a new band with a maximum around 349 nm, indicating the bound neutral form of harmine. An isoemission point appears around 379 nm suggesting the co-existence of the bound and free species at equilibrium. Based on the emission data at 349 nm, a value of Ka ∼ 3.3 × 10⁴ M−1 could be calculated, which is close to that measured for HSA binding of harmine (Table 1).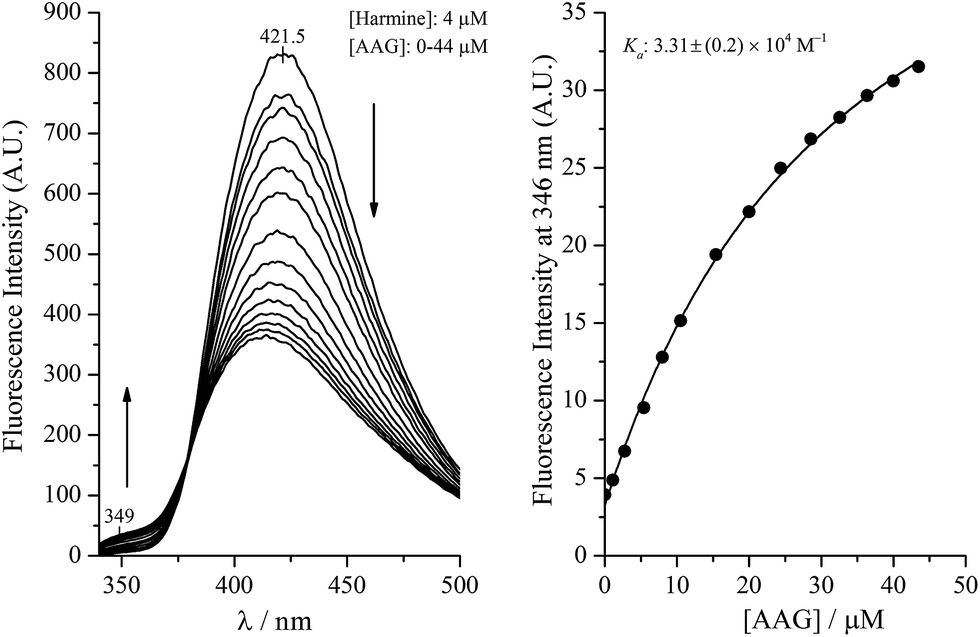 | ||
| Fig. 1 Emission spectra of harmine measured in AAG solution at increasing protein/ligand molar ratios (2 mL of harmine solution was titrated with 200 μM AAG dissolved in the ligand solution). Fluorescence intensities plotted against the AAG concentration of the sample solution. The solid line is the result of non-linear fitting analysis. | ||
Similar experiments, comparing the binding of compound 7 to AAG and HSA can be seen in Fig. 2. Analysis of the low intensity emission data of the HSA bound neutral species at 366 nm yielded a Ka value of 3.1 × 10⁵ M−1 for HSA, which is in good agreement with the affinity constant obtained on the HSA column. The fluorescence changes measured with AAG, however, prove about eight times stronger AAG binding (Ka ∼ 2.4 × 10⁶ M−1). It is to be noted that the satisfactory concordance between the HSA affinity constants of additional harmine derivatives estimated by affinity chromatography method as well as from fluorescence emission of the protein bound neutral species (Table 1) refers to the decisive contribution of the neutral form in the binding process.
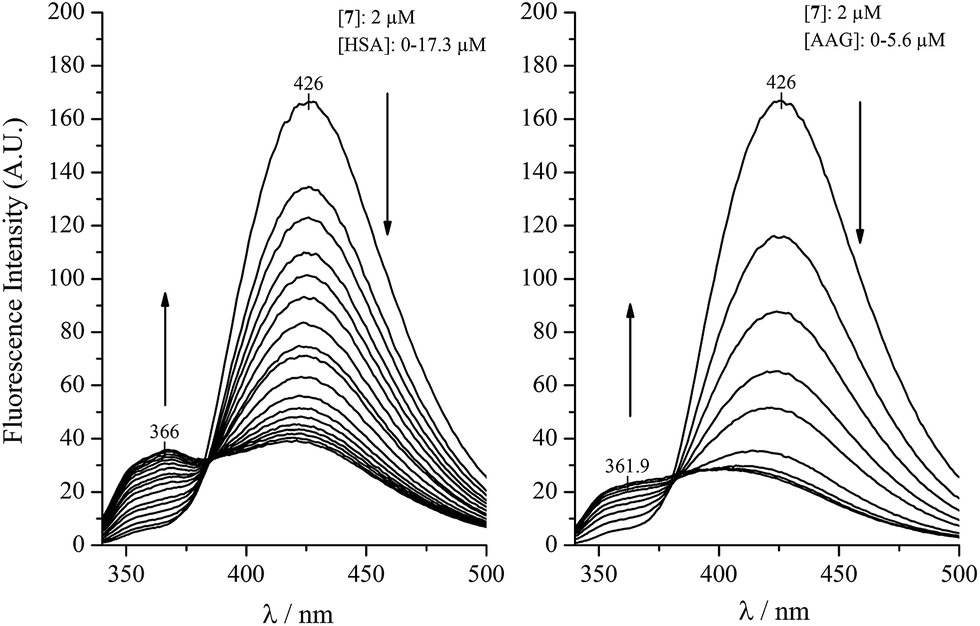 | ||
| Fig. 2 Fluorescence emission spectral changes of compound 7 as a function of HSA and AAG concentration (2 mL of 2 μM ligand solution was titrated with aliquots of 80 μM HSA and AAG dissolved in the ligand stock solution). | ||
Due to genetic polymorphism, AAG can be isolated as a 70:30 mixture of two genetic variants, called F1/S and A, having different drug binding properties. The binding of compounds 7 and 4 to the separated F1/S and A variants was examined, too. In case of 7 we observed (Fig. 3) that addition of the F1/S variant form to the ligand solution gave rise to more pronounced fluorescence changes than the same amount of the A variant, corresponding to ten times higher affinity on the F1/S variant compared to the A (Table 1). By monitoring the fluorescence spectral changes of 4 upon addition of the genetic variants, the descending emission of the peak at 422 nm could be observed, however, the short-wavelength band corresponding to the neutral form evolved only in presence of the F1/S variant (Fig. 3). Therefore, in case of the A form the fluorescence method was not adequate to calculate the association constant, but it demonstrates different affinity of this ligand for the genetic variants of AAG.
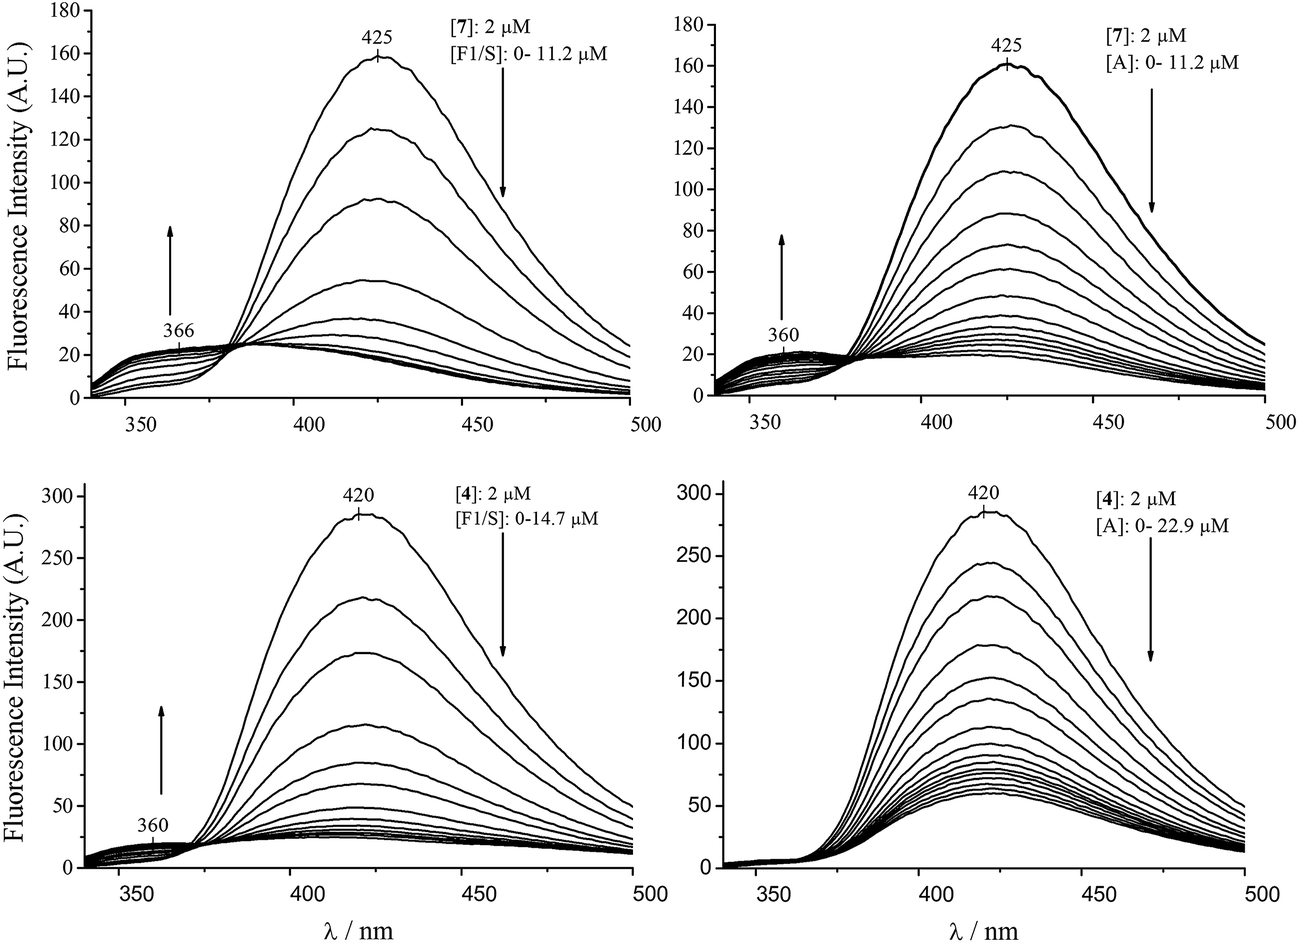 | ||
| Fig. 3 Comparison of the emission spectral changes of compounds 7 and 4 in the presence of the F1/S and a genetic variant of AAG (2 mL of ligand solutions were titrated with 80 μM AAG variants dissolved in the ligand stock solution). | ||
AAG affinity data derived for harmine and its derivatives are summarized in Table 1. Similarly to HSA, the AAG binding of harmine is also weak. Substitution in position 9 with aralkyl groups, besides enhancing their cytotoxic activity in general, also increased the interaction with plasma proteins. The replacement of the methoxy group by alkoxy and (het)aryl alkoxy substituents in position 7 has a similar effect. Compared to harmine, this modification resulted in a four to ten times higher AAG affinity (Table 1). It is to be noted, that the HSA interaction of compounds possessing a pyridine moiety was weaker. The configuration of the stereocenter of 2 or 8 had negligible effect on protein binding. The AAG affinity of compounds 5–9 bearing a benzyl-type substituent on the indole nitrogen (R9) was high (Ka ∼ 106 M−1). The substitution of the phenyl ring had only minor influence on the binding. The highest affinities were measured for the 4-trifluoromethyl substituted analogues, while the 3-methoxy group reduced the binding.
Circular dichroism and UV absorption spectroscopic investigation on the binding of derivatives 4 and 7 to AAG
HSA binding of the optically inactive β-carboline derivatives studied in this work induced no or poor quality CD bands in the respective light absorption region of the ligands (data not shown). Therefore, the induced CD spectroscopic approach15,34,35 could not be employed for estimation of the HSA association constants. In contrast to this, entrapment of some alkaloids within the central drug binding pocket of AAG induced salient CD activity. Addition of the 7-pyridylethoxy derivative of harmine (4) to the A genetic variant of AAG induced multiple CD signals between 240 and 400 nm (Fig. 4). Two weaker, opposite signals can be seen at 303 and 360 nm which are allied to the broad absorption band displayed above 280 nm. In the short-wavelength region a more intense, negative–positive CD band pair was resolved with a zero cross-over point around 253 nm. Magnitudes of these induced CD peaks increased proportionally with the increasing concentration of the ligand but neither their shape nor their position showed variations during the titration. Comparison of the UV spectra of the free and AAG bound form of 4 recorded at the same concentration indicates large intensity reduction of the absorption values (green and black curves in Fig. 5). This phenomenon, called hypochromism, suggests the π–π stacking of two carboline rings at the binding site of AAG. Due to the asymmetry of the protein environment, the stacked, planar aromatic moieties cannot be arranged in a completely parallel fashion but their long axis are rotated relative to each other, forming a helical array. This situation results in a chiral intermolecular exciton coupling between the π–π* transition moments of the proximal carboline chromophores generating two intense, opposite CD bands associated to the respective UV absorption peak (Fig. 4). As it follows from the exciton chirality rule,36 the negative–positive order of these signals predicts the M-helicity of the stacked dimer accommodated within the central cavity of AAG. The less intense ellipticity bands of 4 measured above 290 nm may also be of excitonic origin. The dimeric binding mode of 4 inferred from the spectroscopic results is supported by the analysis of the CD titration data. The best fit on the experimental values was obtained using 2:1 ligand:protein binding stoichiometry. The estimated affinity constants refer to tight interaction of 4 with both genetic variants of AAG (Table 1).
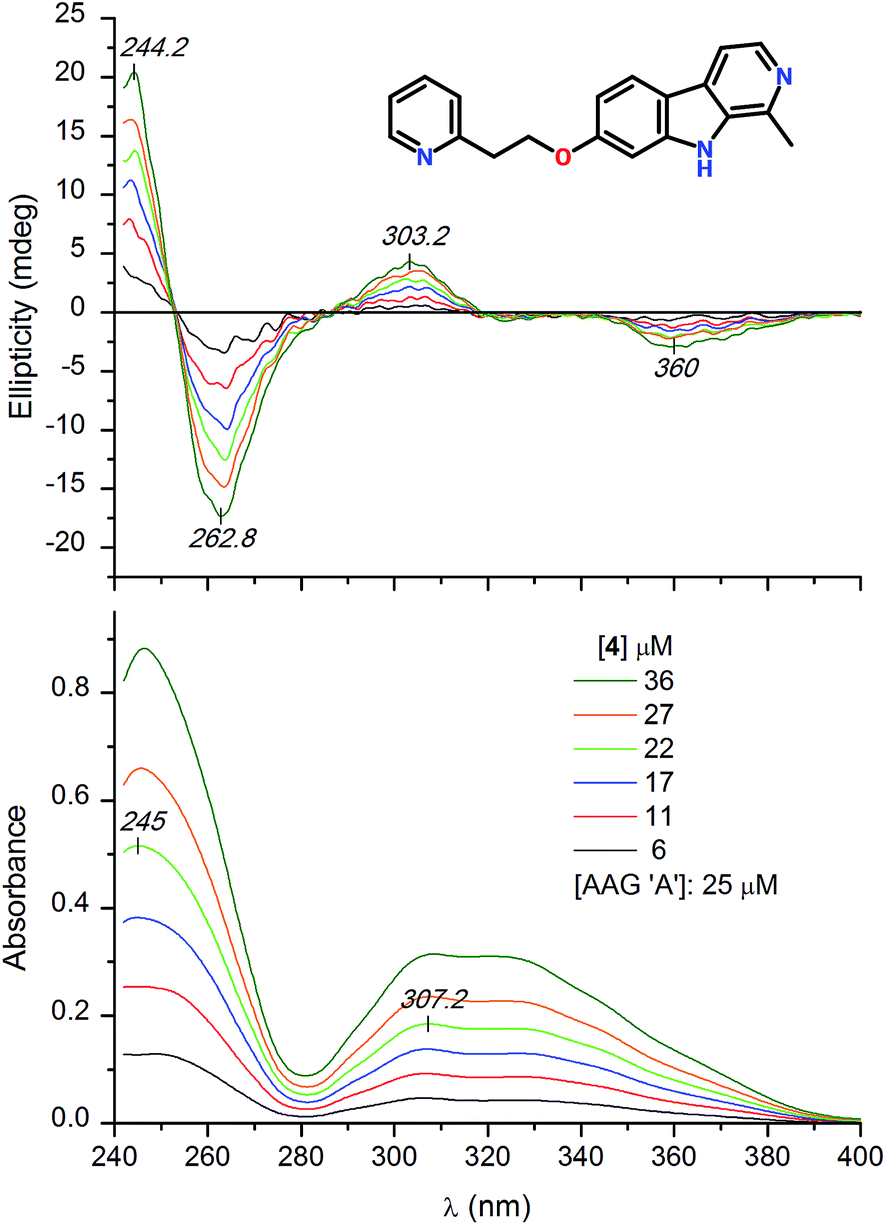 | ||
| Fig. 4 Difference CD and UV absorption spectra of compound 4 added to 25 μM buffer solution of the a genetic variant of AAG. | ||
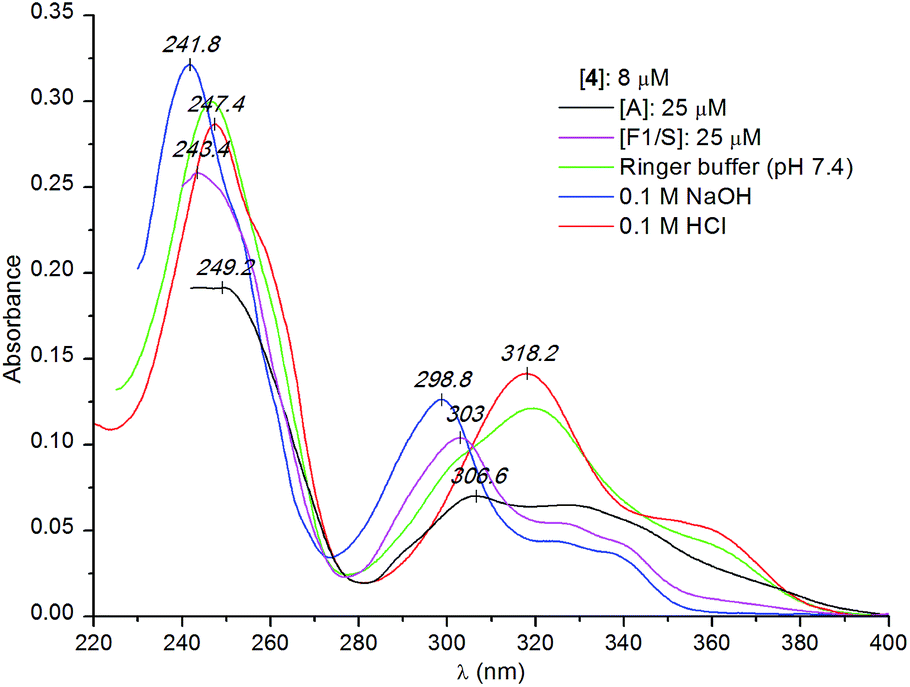 | ||
| Fig. 5 Comparison of the UV absorption spectra of compound 4 measured in protein-free solutions at different pH values and in the presence of the A and F1/S genetic variant of AAG (Ringer buffer). | ||
It is to be noted that apart from the hypochromism, the overall UV absorption profile of compound 4 measured with the A variant of AAG shows the relative dominance of the neutral species but binding in the charged form also occurs (Fig. 5). Binding preference for the unprotonated ligand is more pronounced in the presence of the F1/S variant, where the UV profile of the bound ligand is very similar to that observed in alkaline solution (Fig. 5). The weaker hypochromism and the less intense induced CD bands (data not shown) suggest that the F1/S protein also binds two alkaloid molecules but with a larger intermolecular distance between them.
Taking into consideration these data, the very low fluorescence emission of the neutral species of compound 4 obtained with the A variant (Fig. 3) might in part be attributed to its mixed, neutral–cationic binding and also to a dimerization caused self-quenching mechanism.37
Interestingly, the AAG binding behaviour of 4 is highly reminiscent to that of acridine orange, the association of which to the A variant also occurs in a dimeric form inducing a characteristic biphasic CD pattern.19 Similarly to compound 4, F1/S binding of the acridine orange results in much weaker exciton signals. Comparison of the crystal structures of the genetic variants revealed that the central drug binding pocket is narrower in the A form.38 Instead of the three sub-chambers present in F1/S, the A variant possesses only two binding lobes. It follows that due to steric restrictions, co-binding of two molecules of compound 4 can occur only in a tightly stacked, dimeric configuration while the larger cleft of the F1/S variant allows greater room and separation of the carboline moieties. The pyridine side chain seems to be important for the dimeric binding since the harmine–AAG interaction did not produce the above spectroscopic features (hypochromism, exciton CD coupling).
As the fluorescence measurements showed, compound 7 bearing a trifluorophenyl substituent attached to the indole nitrogen also exhibits selective AAG binding in favour of the F1/S variant (Fig. 3). This behaviour is reflected in the distinct CD and absorption spectroscopic changes obtained with the genetic variants, too (Fig. 6). The F1/S form binds preferentially the neutral species of the molecule which is attested by the great similarity between the UV curves recorded in 0.1 M NaOH and in pH 7.4 buffer solution of the protein. In relation to the absorption spectrum measured in buffer, the A variant provoked limited changes only suggesting that its cationic–neutral discrimination ability is much weaker than that of the F1/S form. Due to the more uniform, tighter association of compound 7 to the F1/S variant, higher intensity ellipticity signals were induced than that measured with the A form (Fig. 6). Distinctly from 4, the bulky trifluoromethyl-phenyl moiety sterically restricts the dimeric binding of 7. Similarly to various AAG ligands having a rigid, planar ring system, the observed CD activity of 7 may be induced through non-degenerate exciton coupling with high-energy π–π* transitions of adjacent aromatic side chains of the binding pocket.39,40
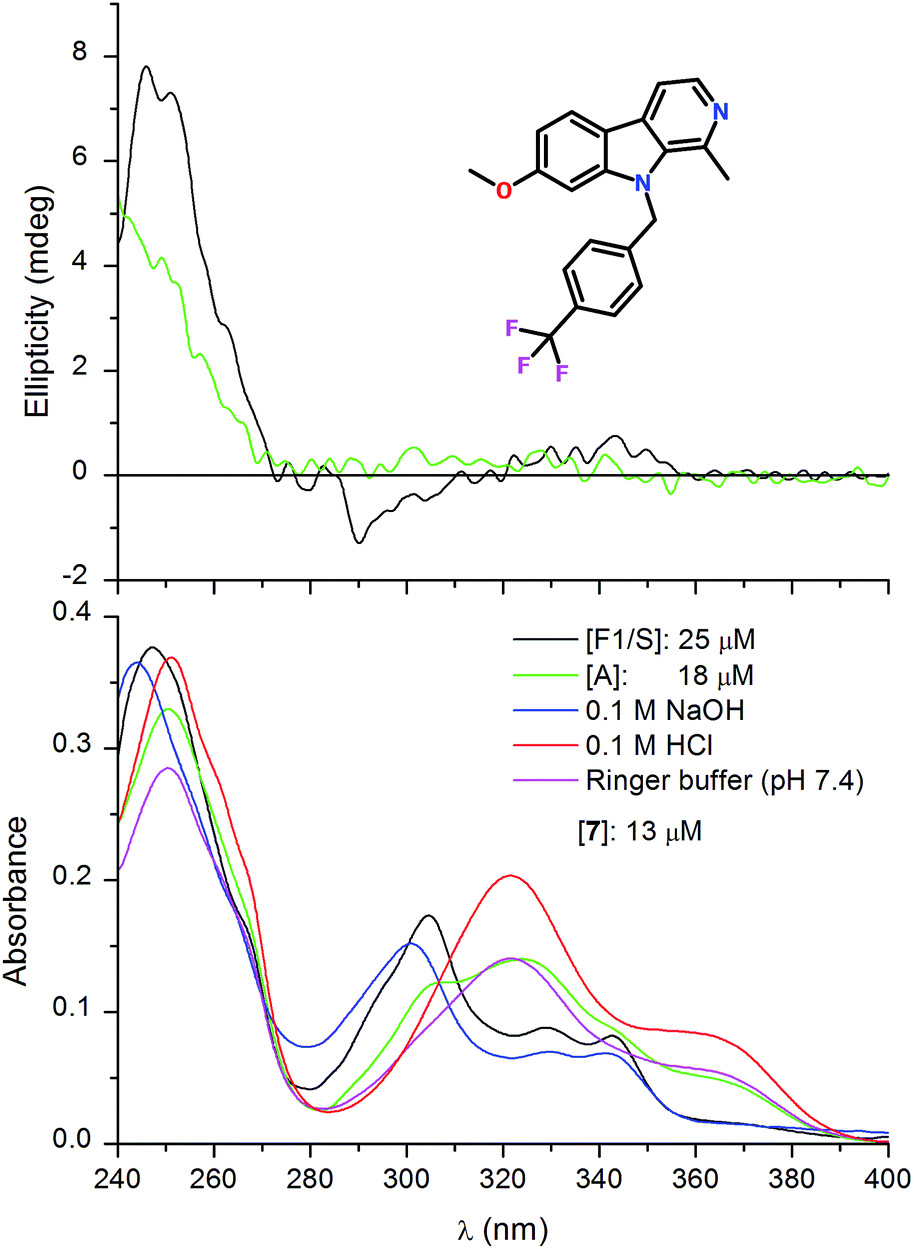 | ||
| Fig. 6 Difference CD and UV absorption spectra of compound 7 measured with the F1/S and A genetic variant of AAG. UV curves of the ligand recorded in protein-free solutions at different pH values are also shown. | ||
Sequential molecular docking of compound 4 to the A variant of AAG
Computational docking calculation was also performed to obtain insight into the molecular details of the AAG association of compound 4. Taking into account the CD and UV spectroscopic results, two molecules of compound 4 were docked sequentially into the binding room of AAG. The most frequent and best energy result shows a pair of partially π-stacked ligand molecules in the binding crevice stabilized by four intermolecular H-bonds (Fig. 7). The interplanar distance between the β-carboline skeletons is about 4 Å and their long axes close a counterclockwise, left-handed angle. This binding geometry is favourable for dipole–dipole coupling between the π–π* transitions of the β-carboline chromophores, which is consistent with the induced CD exciton couplet and the UV hypochromism of the AAG bound species (Fig. 4). Considering the exciton chirality rule,36 the left-handed (M-helical) orientation of the ligand molecules predicts a longer-wavelength negative and a shorter-wavelength positive CD band pair which is in full accordance with the spectroscopic data.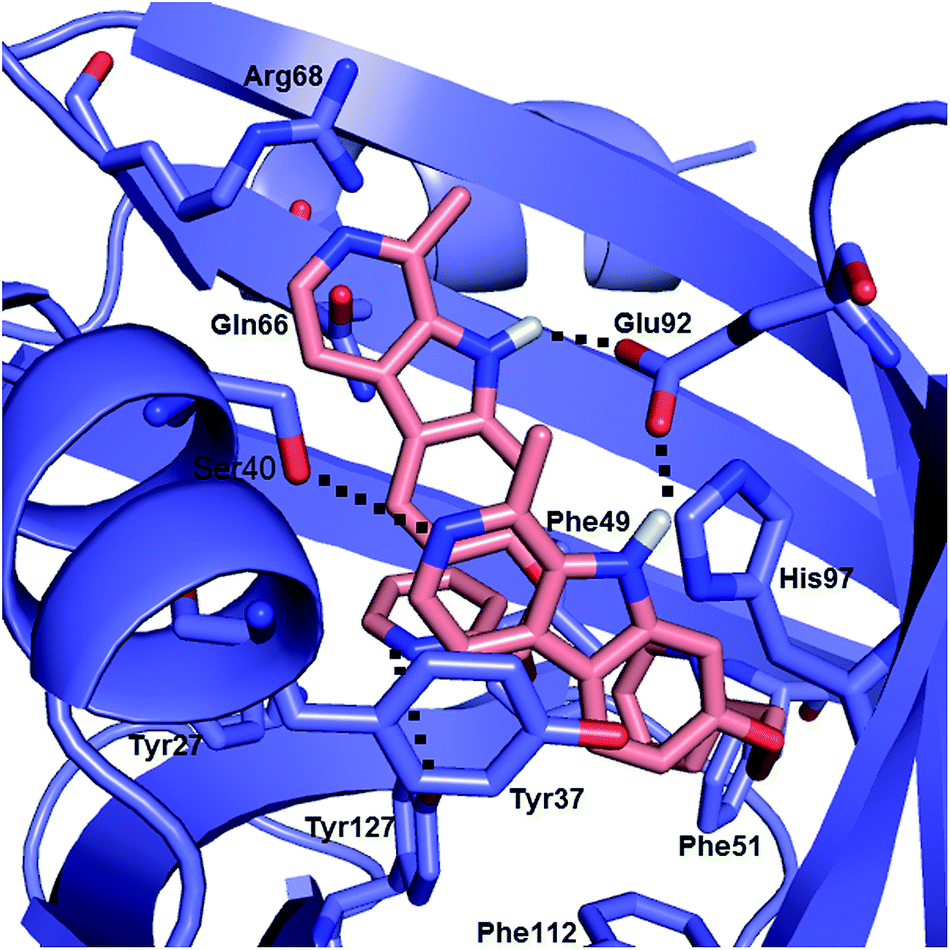 | ||
| Fig. 7 Two compound 4 molecules docked sequentially into the binding cavity of the A variant of AAG. Dotted lines indicate intermolecular H-bonds. | ||
Conclusions
In the present study, the synthesis of a series of novel harmine derivatives bearing an arylated alkoxy substituent in position 7, or a modified benzyl moiety in position 9 was described. Plasma protein binding of these β-carboline analogues was found to be substituent-dependent. Incorporation of the aromatic pharmacophore group into the positions 7 or 9 of the carboline skeleton brought about considerably enhanced affinity to both HSA and AAG. These results imply that the pharmacologically active, free serum levels of these potential therapeutic agents are supposed to be very low that should be taken into consideration during further drug development phases. In contrast to the well documented cationic drug binding preference of AAG, the spectroscopic results proved that the AAG association of β-carbolines possessing basic pyridine nitrogen takes place mainly in non-protonated form. Moreover, the 7-pyridylethoxy derivative of harmine exhibited π-stacked, dimeric binding to the A but not to the F1/S variant of AAG that is related to the distinct architecture of the internal cavity of their β-barrels.Acknowledgements
Financial support of the ‘Lendület’ Program of the Hungarian Academy of Sciences (LP2013-55/2013) is acknowledged.References
- R. Cao, W. Peng, Z. Wang and A. Xu, Curr. Med. Chem., 2007, 14, 479–500 CrossRef CAS.
- R. Cao, W. Peng, H. Chen, Y. Ma, X. Liu, X. Hou, H. Guan and A. Xu, Biochem. Biophys. Res. Commun., 2005, 338, 1557–1563 CrossRef CAS PubMed.
- J. Bain, L. Plater, M. Elliott, N. Shpiro, C. J. Hastie, H. McLauchlan, I. Klevernic, J. S. Arthur, D. R. Alessi and P. Cohen, Biochem. J., 2007, 408, 297–315 CrossRef CAS PubMed.
- A. Miralles, S. Esteban, A. Sastre-Coll, D. Moranta, V. J. Asensio and J. A. Garcia-Sevilla, Eur. J. Pharmacol., 2005, 518, 234–242 CrossRef CAS PubMed.
- D. Frost, B. Meechoovet, T. Wang, S. Gately, M. Giorgetti, I. Shcherbakova and T. Dunckley, PLoS One, 2011, 6, e19264 CAS.
- F. K. Wiseman, K. A. Alford, V. L. Tybulewicz and E. M. Fisher, Hum. Mol. Genet., 2009, 18, R75–R83 CrossRef CAS PubMed.
- J. Ishida, H. K. Wang, K. F. Bastow, C. Q. Hu and K. H. Lee, Bioorg. Med. Chem. Lett., 1999, 9, 3319–3324 CrossRef CAS.
- R. Cao, Q. Chen, X. Hou, H. Chen, H. Guan, Y. Ma, W. Peng and A. Xu, Bioorg. Med. Chem., 2004, 12, 4613–4623 CrossRef CAS PubMed.
- R. Cao, W. Fan, L. Guo, Q. Ma, G. Zhang, J. Li, X. Chen, Z. Ren and L. Qiu, Eur. J. Med. Chem., 2013, 60, 135–143 CrossRef CAS PubMed.
- R. Calvo, J. C. Lukas, M. Rodriguez, N. Leal and E. Suarez, Curr. Pharm. Des., 2006, 12, 977–987 CrossRef CAS.
- A. Das and G. S. Kumar, RSC Adv., 2014, 4, 33082–33090 RSC.
- M. Hossain, A. Y. Khan and G. S. Kumar, J. Chem. Thermodyn., 2012, 47, 90–99 CrossRef CAS PubMed.
- F. Zsila, Mol. Pharm., 2013, 10, 1668–1682 CrossRef CAS PubMed.
- A. Varshney, P. Sen, E. Ahmad, M. Rehan, N. Subbarao and R. H. Khan, Chirality, 2010, 22, 77–87 CrossRef CAS PubMed.
- C. Domonkos, I. Fitos, J. Visy and F. Zsila, Mol. Pharm., 2013, 10, 4706–4716 CrossRef CAS PubMed.
- Z. H. Israili and P. G. Dayton, Drug Metab. Rev., 2001, 33, 161–235 CrossRef CAS PubMed.
- M. Otagiri, Drug Metab. Pharmacokinet., 2005, 20, 309–323 CrossRef CAS.
- F. Hervé, G. Caron, J. C. Duche, P. Gaillard, N. Abd Rahman, A. Tsantili-Kakoulidou, P. A. Carrupt, P. d'Athis, J. P. Tillement and B. Testa, Mol. Pharmacol., 1998, 54, 129–138 Search PubMed.
- I. Fitos, J. Visy, F. Zsila, Z. Bikádi, G. Mády and M. Simonyi, Biochem. Pharmacol., 2004, 67, 679–688 CrossRef CAS PubMed.
- K. Nishi, M. Ueno, Y. Murakami, N. Fukunaga, T. Akuta, D. Kadowaki, H. Watanabe, A. Suenaga, T. Maruyama and M. Otagiri, J. Pharm. Sci., 2009, 98, 4316–4326 CrossRef CAS PubMed.
- I. Fitos, J. Visy, M. Simonyi, G. Mády and F. Zsila, Biochim. Biophys. Acta, 2010, 1800, 367–372 CrossRef CAS PubMed.
- P. Jandera, Anal. Chim. Acta, 2011, 692, 1–25 CrossRef CAS PubMed.
- I. Fitos, Z. Tegyey, M. Simonyi, I. Sjoholm, T. Larsson and C. Lagercrantz, Biochem. Pharmacol., 1986, 35, 263–269 CrossRef CAS.
- D. A. Breustedt, D. L. Schonfeld and A. Skerra, Biochim. Biophys. Acta, 2006, 1764, 161–173 CrossRef CAS PubMed.
- F. Zsila, Z. Bikádi and M. Simonyi, Biochem. Pharmacol., 2003, 65, 447–456 CrossRef CAS.
- Z. Bikadi and E. Hazai, J. Cheminf., 2009, 1, 15 Search PubMed.
- A. P. Shohreh Nafisi and G. B. Sadeghi, J. Lumin., 2012, 132, 2361–2366 CrossRef PubMed.
- H. Greige-Gerges, Y. Diab, J. Farah, J. Magdalou, C. Haddad and N. Ouaini, Biopharm. Drug Dispos., 2008, 29, 83–89 CrossRef CAS PubMed.
- A. M. Merlot, S. Sahni, D. J. Lane, A. M. Fordham, N. Pantarat, D. E. Hibbs, V. Richardson, M. R. Doddareddy, J. A. Ong, M. L. Huang, D. R. Richardson and D. S. Kalinowski, OncoTargets Ther., 2015, 6, 10374–10398 Search PubMed.
- A. Sparreboom, K. Nooter, W. J. Loos and J. Verweij, Neth. J. Med., 2001, 59, 196–207 CrossRef CAS.
- J. Heuberger, S. Schmidt and H. Derendorf, J. Pharm. Sci., 2013, 102, 3458–3467 CrossRef CAS PubMed.
- M. Balon, J. Hidalgo, P. Guardado, M. A. Munoz and C. Carmona, J. Chem. Soc., Perkin Trans. 2, 1993, 99–104 RSC.
- A. Mallick, P. Das and N. Chattopadhyay, J. Photochem. Photobiol., C, 2010, 11, 62–72 CrossRef CAS PubMed.
- D. Tedesco and C. Bertucci, J. Pharm. Biomed. Anal., 2015 DOI:10.1016/j.jpba.2015.02.024.
- C. Domonkos, I. Fitos, J. Visy and F. Zsila, Phys. Chem. Chem. Phys., 2014, 16, 22632–22642 RSC.
- N. Berova, L. Di Bari and G. Pescitelli, Chem. Soc. Rev., 2007, 36, 914–931 RSC.
- J. P. Knemeyer and N. Marme, Recent Pat. DNA Gene Sequences, 2007, 1, 145–147 CrossRef CAS.
- K. Nishi, T. Ono, T. Nakamura, N. Fukunaga, M. Izumi, H. Watanabe, A. Suenaga, T. Maruyama, Y. Yamagata, S. Curry and M. Otagiri, J. Biol. Chem., 2011, 286, 14427–14434 CrossRef CAS PubMed.
- F. Zsila and Y. Iwao, Biochim. Biophys. Acta, 2007, 1770, 797–809 CrossRef CAS PubMed.
- F. Zsila, J. Mol. Recognit., 2011, 24, 995–1006 CrossRef PubMed.
Footnote |
| † Electronic supplementary information (ESI) available: Predicted pKa values of harmine and its synthetic derivatives. See DOI: 10.1039/c5ra06426k |
| This journal is © The Royal Society of Chemistry 2015 |