
A tailored high-nickel cobalt-free Na-doped LiNi0.9Mn0.06Al0.04O2 cathode for superior lithium storage
Xiaoyi
Hou†
 *abc,
Xi
Wu†
a,
Leilei
Hu
a,
Haozhe
Wu
a,
Yibo
Zhang
a,
Liang
Zhao
a and
Jiatai
Wang
abc
*abc,
Xi
Wu†
a,
Leilei
Hu
a,
Haozhe
Wu
a,
Yibo
Zhang
a,
Liang
Zhao
a and
Jiatai
Wang
abc
aCollege of Physics and Electronic Information Engineering, Qinghai Normal University, Xining 810000, China. E-mail: houxy13@foxmail.com
bQinghai Key Laboratory of Advanced Technology and Application of Environmental Functional Materials, Xining 810016, China
cAcademy of Plateau Science and Sustainability, Qinghai Normal University, Xining 810016, China
First published on 25th June 2025
Abstract
To meet the growing demands of the electric vehicle market, it is urgent to search for high-nickel cobalt-free layered cathodes for lithium-ion batteries (LIBs) to boost electrochemical energy storage. However, their practical application is severely limited by some disadvantages in terms of relatively high cost, inherent structural instability and severely detrimental phase transitions. Herein, an Na-doped LiNi0.9Mn0.06Al0.04O2 sample was fabricated by a simple high-temperature solid-state method. When evaluated as a cathode for LIBs, it delivers prospective electrochemical performance with a high capacity of 252.98 mA h g−1 at 0.1C and excellent cycling stability of 86.7% after 100 cycles at 0.5C. The significant improvement of electrochemical performance is primarily attributed to the broadened Li interlayer spacing and stabilized crystal structure by introducing sodium ions. The present work may demonstrate great potential in high-performance electrode materials by an Na-doped strategy.
1. Introduction
The excessive emission of carbon dioxide and other greenhouse gases has intensified the greenhouse effect, resulting in a series of negative consequences such as the deterioration of the global climate.1–3 To address these problems, the persistent pursuits of advanced electric energy storage devices have stimulated plenty of research efforts on the development of new energy storage components. Lithium-ion batteries (LIBs) have aroused increasing interest in recent years due to their high energy density, long cycle life, lack of memory effect, and so on.4–7 Among many components of batteries, the cathode plays a pivotal role in determining the capacity, operating voltage, and energy density.5,8–10 As is well known, the most widely utilized ternary cathode materials for LIBs are LiNixCoyMnzO2 (NCM) and LiNi1−x−yCoxAlyO2 (NCA). However, the application of cobalt element in these cathode materials is severely hindered due to the scarcity of cobalt resources and high toxicity.11,12 Therefore, it is a necessary trend to design well-suited cobalt-free ternary cathode materials with enhanced electrochemical properties.Generally, high-nickel cobalt-free cathode materials suffer from inherent structural and chemical instability, transition metal dissolution and serious Li+/Ni2+ cation mixing caused by the similar ionic radii of Li+ (0.76 Å) and Ni2+ (0.69 Å).13,14 Moreover, the rapid accumulation of internal stress in the highly delithiated state could cause the continuous formation of microcracks, which may lead to some side reactions by allowing the electrolyte to penetrate the bulk phase along the cracks.15,16 These problems significantly hinder the application of high-nickel cobalt-free cathode materials. Consequently, many efforts have been conducted to explore effective strategies to enhance the electrochemical performance of these materials, such as element doping,17–20 surface coating,21–23 and microstructure adjustment.24–26
Among these strategies, element doping is widely utilized because of its high flexibility. The ionic radius of Na ions is 1.02 Å, which is closest to Li+ (0.76 Å) in size. Through Na-doping strategies, sodium ions could occupy the site of lithium ions and result in the expansion of the interlayer spacing due to its larger ionic radius, which could facilitate the transport of lithium-ions and enhance the electrochemical performance by accommodating more lithium ions.27,28 Furthermore, they can act as pillar ions in high-nickel ternary materials to stabilize the material structure. Park et al. synthesized Na-doped LiNi0.8Mn0.2O2 cathode material by Ph-dependent polymer-assisted surface dense doping (Nax@NM).29 The study showed that Na-doping provides a larger channel for lithium-ion diffusion by expanding the interlayer spacing, and effectively inhibits the formation of oxygen vacancies and structural degradation under high-voltage cycles. These reports suggest that Na-doping can strengthen the electrochemical properties of high-nickel ternary cathode materials.
Herein, we have proposed an Na-doping strategy for LiNi0.9Mn0.06Al0.04O2 high-nickel cathode materials by using a simple high-temperature solid-state method. The unique Na-doping strategy could expand the interlayer spacing of Li+ and enhance the diffusion coefficient of Li ions; meanwhile, it could reduce the Li+/Ni2+ cation mixing and improve the structural stability of the target material. As a result, when used as an electrode for LIBs, it exhibits high specific capacity, superior rate performance and excellent cycling stability.
2. Experimental section
2.1. Material synthesis
Firstly, 1 L of deionized water was added to a three-neck flask filled with N2 for 2 h, and heated at 50 °C to accelerate the removal of dissolved oxygen. Subsequently, a certain amount of NiSO4·6H2O, MnSO4·H2O, Al(NO3)3·9H2O, PEG6000 and 10 mL of PEG200 (as dispersant) were dissolved in deionized water, and completely mixed in a three-neck flask at 82 °C; di-n-butylamine was then added into the three-neck flask as a precipitant. Afterward, the synthesized precursor was filtered, washed, and dried at 80 °C for 12 h. Finally, the obtained Ni0.9Mn0.06Al0.04(OH)2 precursor was mixed with LiOH·H2O at a molar ratio of 1![[thin space (1/6-em)]](https://www.rsc.org/images/entities/char_2009.gif) :1.02. Finally, the target LiNi0.9Mn0.06Al0.04O2 (NMA964) sample was obtained by pre-calcinating at 500 °C for 5 h and calcinating at 750 °C for 15 h with a flowing oxygen atmosphere.
:1.02. Finally, the target LiNi0.9Mn0.06Al0.04O2 (NMA964) sample was obtained by pre-calcinating at 500 °C for 5 h and calcinating at 750 °C for 15 h with a flowing oxygen atmosphere.
Na-doped LiNi0.9Mn0.06Al0.04O2 (Na-NMA964): the Ni0.9Mn0.06Al0.04(OH)2 precursor, LiOH·H2O, and Na2CO3 were mixed in a beaker filled with alcohol in the molar ratio of 1:1.02 − y![[thin space (1/6-em)]](https://www.rsc.org/images/entities/i_char_2009.gif) :y (y = 0.01, 0.02, 0.03). The mixture was then placed in an ultrasonic machine at 60 °C for 90 min. Afterward, the mixture was dried in a constant-temperature oven at 120 °C for 4 h. Finally, the Na-NMA964 samples (labeled as 1%Na-NMA964, 2%Na-NMA964, and 3%Na-NMA964) were fabricated by pre-calcinating at 500 °C for 5 h and calcinating at 750 °C for 15 h.
:y (y = 0.01, 0.02, 0.03). The mixture was then placed in an ultrasonic machine at 60 °C for 90 min. Afterward, the mixture was dried in a constant-temperature oven at 120 °C for 4 h. Finally, the Na-NMA964 samples (labeled as 1%Na-NMA964, 2%Na-NMA964, and 3%Na-NMA964) were fabricated by pre-calcinating at 500 °C for 5 h and calcinating at 750 °C for 15 h.
2.2. Material characterization
The crystal phases of the pristine and Na-doped samples were analyzed by using X-ray diffraction (Smartlab, Rigaku) in the Cu Kα range at a scanning rate of 10° min−1 in the 2θ range of 10–80°. Rietveld refinement was conducted through the software FullProf to obtain the detailed crystal parameters. Scanning electron microscopy (SEM, JSM-7900F) was used to study the surface morphology. The elemental composition of the material was analyzed by using energy-dispersive spectroscopy (EDS). The internal structure of the material was further investigated by transmission electron microscopy (TEM, Tecnai G2 F30). The surface valence states of the elements were obtained using X-ray photoelectron spectroscopy (XPS, Thermo ESCALAB 250Xi).2.3. Electrochemical measurements
The electrode material, polyvinylidene fluoride (PVDF) and carbon black were evenly mixed with a weight ratio of 8:1:1, and an appropriate amount of NMP was added to form a slurry. Then the slurry was coated on aluminum foil and dried in a vacuum drying oven at 80 °C. The diaphragm is porous polypropylene, the electrolyte is a mixture by dissolving 1.0 M of LiPF6 into the component solvent of ethylene carbonate/dimethyl carbonate/diethyl carbonate (EC:DMC:DEC = 1:1:1 vol%). CR2032 coin batteries were assembled in an Ar gas glove box (O2 < 0.1 ppm, H2O < 0.1 ppm). The electrochemical performance tests were performed by using a Neware battery test system (CT-4008T) with a voltage range of 2.5–4.3 V (vs. Li/Li+) at room temperature. Cyclic voltammetry (CV, scan speed = 0.2 mV s−1, voltage window = 2.5–4.3 V) (Chenhua, Shanghai, China) and electrochemical impedance spectroscopy (EIS, frequency range = 100 mHz–100 kHz, Chenhua, Shanghai, China) were performed on a CHI660E electrochemical workstation.
3. Results and discussion
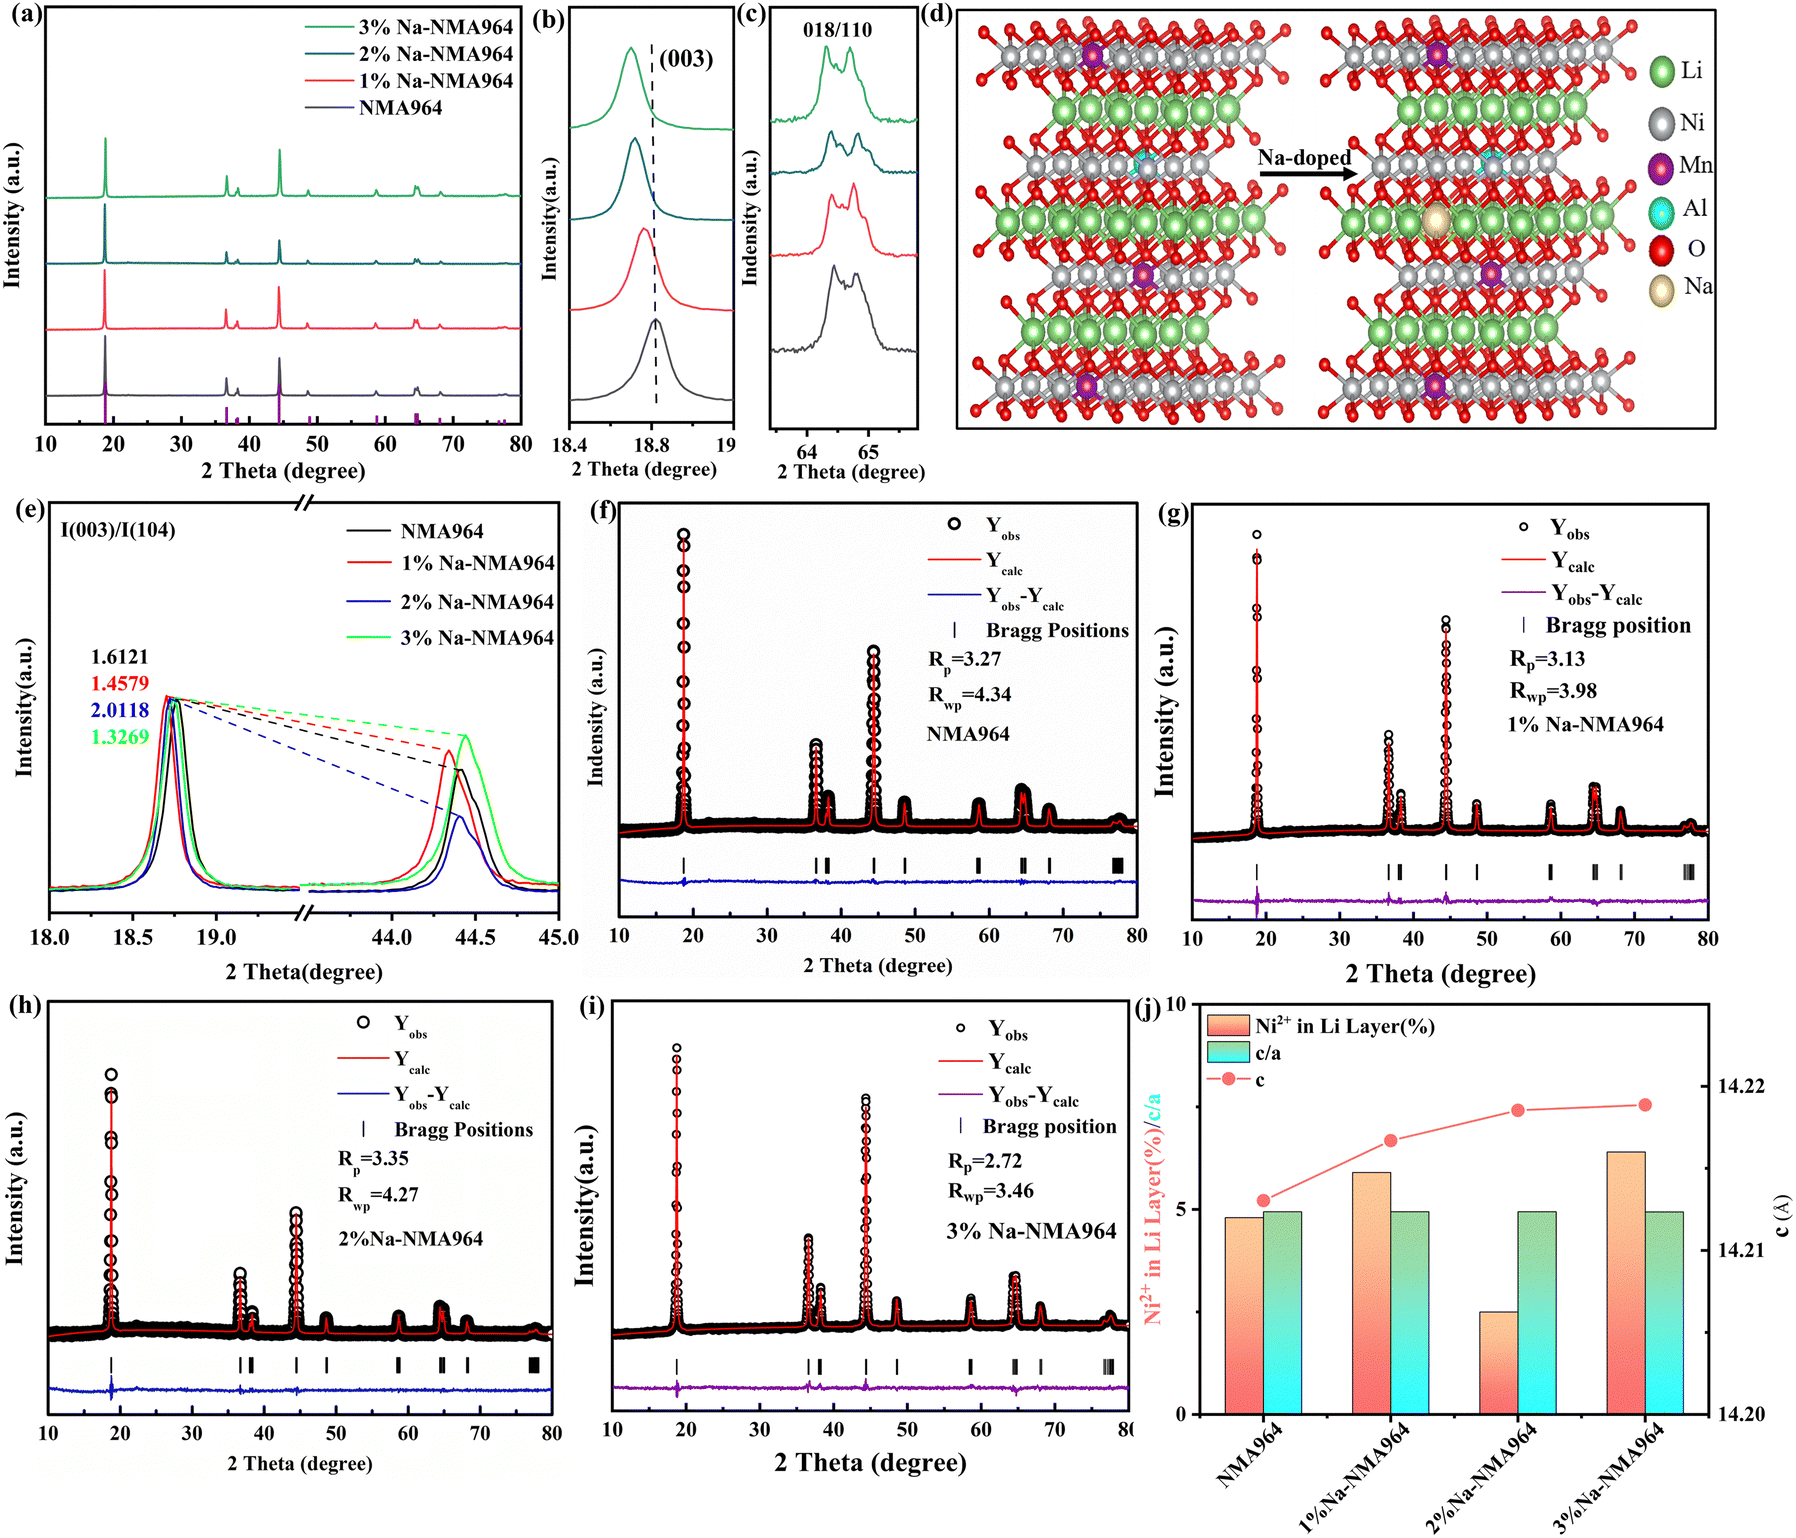
The effect of Na-doping on the structure and electrochemical properties of high-nickel ternary cathode materials is systematically studied. As shown in Fig. 1a, all of the strong diffraction peaks can be indexed to the hexagonal structure of α-NaFeO2 with the R![[3 with combining macron]](https://www.rsc.org/images/entities/char_0033_0304.gif) m space group. Notably, no impurity peaks are detected, indicating that Na-doping does not induce the formation of additional impurity phases. Compared with the NMA964 material, the (003) peak of the Na-NMA964 sample shifts towards a lower angle, which signifies an expansion of the lattice parameter and is conducive to enhancing the transport characteristics of lithium ions (see Fig. 1b).30 Furthermore, the (018)/(110) diffraction peaks in Fig. 1c of all samples are well split, signifying the higher ordered layered structure.31,32Fig. 1d illustrates the corresponding crystal structure of the NMA964 and Na-NMA964 samples, revealing a possible structural change in which sodium ions replace the positions of the lithium ions. Generally, the intensity ratio of the (003) and (104) peaks is closely related to the Li+/Ni2+ cation mixing, and a value exceeding 1.2 delivers a lower degree of Li+/Ni2+ cation mixing and a more ordered crystal structure.33–36 As shown in Fig. 1e, the intensity ratios of the (003)/(104) peaks of all samples exceed 1.2, suggesting that all samples present relatively lower degree of Li+/Ni2+ cation mixing. Notably, the 2%Na-NMA964 sample exhibits the highest intensity ratio of the (003)/(104) peaks, implying that an appropriate Na-doping amount could effectively reduce the degree of Li+/Ni2+ cation mixing of the target NMA964 sample. In other words, insufficient or excessive Na-doping amount may result in a negative impact on the orderliness of the crystal structures.
m space group. Notably, no impurity peaks are detected, indicating that Na-doping does not induce the formation of additional impurity phases. Compared with the NMA964 material, the (003) peak of the Na-NMA964 sample shifts towards a lower angle, which signifies an expansion of the lattice parameter and is conducive to enhancing the transport characteristics of lithium ions (see Fig. 1b).30 Furthermore, the (018)/(110) diffraction peaks in Fig. 1c of all samples are well split, signifying the higher ordered layered structure.31,32Fig. 1d illustrates the corresponding crystal structure of the NMA964 and Na-NMA964 samples, revealing a possible structural change in which sodium ions replace the positions of the lithium ions. Generally, the intensity ratio of the (003) and (104) peaks is closely related to the Li+/Ni2+ cation mixing, and a value exceeding 1.2 delivers a lower degree of Li+/Ni2+ cation mixing and a more ordered crystal structure.33–36 As shown in Fig. 1e, the intensity ratios of the (003)/(104) peaks of all samples exceed 1.2, suggesting that all samples present relatively lower degree of Li+/Ni2+ cation mixing. Notably, the 2%Na-NMA964 sample exhibits the highest intensity ratio of the (003)/(104) peaks, implying that an appropriate Na-doping amount could effectively reduce the degree of Li+/Ni2+ cation mixing of the target NMA964 sample. In other words, insufficient or excessive Na-doping amount may result in a negative impact on the orderliness of the crystal structures.
 | ||
| Fig. 1 (a) XRD patterns of the as-prepared NMA964, 1%Na-NMA964, 2%Na-NMA964 and 3%Na-NMA964 samples. (b) and (c) Enlarged characteristic peaks of (003) and (018)/(110). (d) The crystal structure diagrams of NMA964 and Na-NMA964. (e) Selected 003/104 planes. (f)–(i) Rietveld refinement results. (j) c-axis, c/a, and the content of Ni2+ in the Li layer under varying doping amounts. | ||
The structures of all samples are further identified by XRD refinement, and shown in Fig. 1f-i. The corresponding refinement parameters are listed in Table 1, and the Rp and Rwp values are all lower than 10%, confirming that the refinement results are reliable. It is noted that the c-axis tends to increase, which is consistent with the observed shift of the (003) diffraction peak. The c/a ratio in the Na-NMA964 material is about 4.9, suggesting that the Na-doping procedure has little impact on the crystal structure and delivers a well layered structure.37 From the visual bar chart in Fig. 1j, the proportion of nickel ions replacing lithium ions is consistent with the I(003)/I(104) ratios. It is confirmed that moderate Na-doping amount can not only reduce Li+/Ni2+ cation mixing, but also maintain a well-ordered layered structure. In addition, sodium ions occupy the sites of lithium ions in the crystal structure of NMA964, and the interlayer spacing will expand due to the larger ionic radius of sodium ions, which is conducive to the intercalation/deintercalation of lithium ions during the discharge/charge process.38
| Sample | a (Å) | c (Å) | c/a | I(003)/I(104) | Ni2+ in Li layer (%) |
|---|---|---|---|---|---|
| NMA964 | 2.8753 | 14.2130 | 4.9431 | 1.6121 | 4.80 |
| 1%Na-NMA964 | 2.8765 | 14.2165 | 4.9423 | 1.4579 | 5.94 |
| 2%Na-NMA964 | 2.8770 | 14.2185 | 4.9421 | 2.0118 | 2.48 |
| 3%Na-NMA964 | 2.8782 | 14.2188 | 4.9402 | 1.3269 | 6.40 |
The morphologies of the as-synthesized NMA964 and Na-NMA964 samples were examined by SEM, and shown in Fig. 2a–d. All samples show secondary quasi-spherical particles, and there are no significant changes in the morphologies between Na-doped samples and the pristine sample, which may be related to the relatively low amount of doping. A large number of fine particles on the surface can increase the specific surface area of the material, thereby shortening the diffusion distance of lithium ions. EDS analysis was further performed to investigate the elemental distribution of the Na-doped NMA964 sample, and shown in Fig. 2e. As can be seen, the target Ni, Mn and Al, and Na elements are uniformly distributed on the surface of the 2%Na-NMA964 sample, indicating that the Na element was successfully incorporated into the NMA964 material with a uniform distribution during the high-temperature calcination process. Furthermore, Fig. 2f, g, i and j displays the low-resolution and high-resolution TEM images of the NMA964 and 2%Na-NMA964 samples. Obviously, some clear lattice fringes can be observed in all samples, indicating that the prepared materials deliver good crystallinity.39–41 From Fig. 2h and k, the SAED patterns of all samples present well-defined diffraction spots in the reciprocal space, revealing a typical single crystallized structure. Compared with the NMA964 sample, the interlayer spacing of the (003) plane in the 2%Na-NMA964 structure enlarges from 0.478 to 0.486 nm, confirming that Na+ is successfully introduced into the crystal lattice. The above results indicate that Na-doping does not change the objective material's structure, which is well consistent with the XRD patterns. Moreover, the increased interlayer spacing could effectively expand the diffusion channels of lithium ions, which may significantly accelerate the kinetic transport characteristics and improve the structural stability of the NMA964 sample.
 | ||
| Fig. 2 SEM images of (a) NMA964, (b) 1%Na-NMA964, (c) 2%Na-NMA964 and (d) 3%Na-NMA964. (e) EDS elemental mappings of the 2%Na-NMA964 sample. (f)–(k) TEM images of NMA964, 2%Na-NMA964, and the corresponding SEAD patterns. | ||
To acquire more detailed information on the surface chemical composition of the high-nickel cathode materials, XPS was carried out and presented in Fig. 3. As can be seen in Fig. 3a, the Ni 2p spectra for both the NMA964 and 2%Na-NMA964 samples can be fitted into two peaks. The Ni 2p2/3 peaks at the binding energies of 854.28 and 855.88 eV are attributed to Ni2+ and Ni3+, respectively.6,42 It is noted that the proportion of Ni2+ on the surface of the NMA964 sample is higher than that of the 2%Na-NMA964 sample, which could have resulted from the Na-doping strategy by mitigating the cationic mixing degree.43 In contrast, the peak positions of Mn 2p do not significantly shift, indicating that Na-doping has almost no influence on the valence state of Mn (Fig. 3b). The evident Na 1s peak in Fig. 3c is located at about 1068.8 eV, demonstrating that Na+ is doped into the NMA964 material.44 In addition, Fig. 3d shows the C 1s fine XPS spectra of the NMA964 and 2%Na-NMA964 samples, and the characteristic peaks at 284.4, 285.7, 288.5 and 289.9 eV could be ascribed to the C–C, C–O, C![[double bond, length as m-dash]](https://www.rsc.org/images/entities/char_e001.gif) O, and CO32− groups, respectively.45 According to the C 1s fine XPS spectra of the NMA964 and 2%Na-NMA964 samples, the integral area ratio of CO32− in 2% Na-NMA964 is smaller, confirming the reduction in Li2CO3 on the surface. It needs to be emphasized that the lower residual alkali content on the surface of the 2%Na-NMA964 material can effectively reduce the release of CO2 and O2 during cycling, thereby enhancing the structural stability of the electrode material.
O, and CO32− groups, respectively.45 According to the C 1s fine XPS spectra of the NMA964 and 2%Na-NMA964 samples, the integral area ratio of CO32− in 2% Na-NMA964 is smaller, confirming the reduction in Li2CO3 on the surface. It needs to be emphasized that the lower residual alkali content on the surface of the 2%Na-NMA964 material can effectively reduce the release of CO2 and O2 during cycling, thereby enhancing the structural stability of the electrode material.
 | ||
| Fig. 3 XPS spectra of (a) Ni 2p, (b) Mn 2p, (c) Na 1s, and (d) C 1s of the NMA964 and 2%Na-NMA964 samples. | ||
The influence of Na-doping on the electrochemical performance of the NMA964 cathode materials is evaluated by assembling coin-type cells. Fig. 4a–d show the CV curves for the initial three cycles of the NMA964 and Na-NMA964 samples. Obviously, three pairs of redox peaks can be observed for all electrodes, which correspond to the typical H1-M, M-H2, and H2-H3 phase transitions, respectively.46,47 It is generally considered that the potential difference (ΔV) of the first pair of redox peaks reflects the interfacial polarization of the cathode material.48,49 The potential differences for the NMA964, 1%Na-NMA964, 2%Na-NMA964, and 3%Na-NMA964 samples are 0.241, 0.206, 0.181, and 0.277 V, respectively. Predictably, the 2%Na-NMA964 sample exhibits optimal reversibility and minimum degradation of the redox peaks, implying that Na-doping could effectively improve the stability of the layered structure of the material. Consistent with the CV curves, three oxidation/reduction peaks are observed in the dQ/dV curves of the Na-NMA964 and 2%Na-NMA964 samples, corresponding to the H1 → M, M → H2, and H2 → H3 phase transitions during the delithiation process (see Fig. 4e and f). Therein, the phase transition between H2 and H3 could lead to an abrupt contraction and expansion of the c-axis lattice, which may cause irreversible pulverization of the structure and rapid attenuation of the capacity.50,51 As a result, the higher reversibility of the transition between H2 and H3 is observed in the 2%Na-NMA964 sample, suggesting a greatly enhanced structural stability after Na-doping modification.
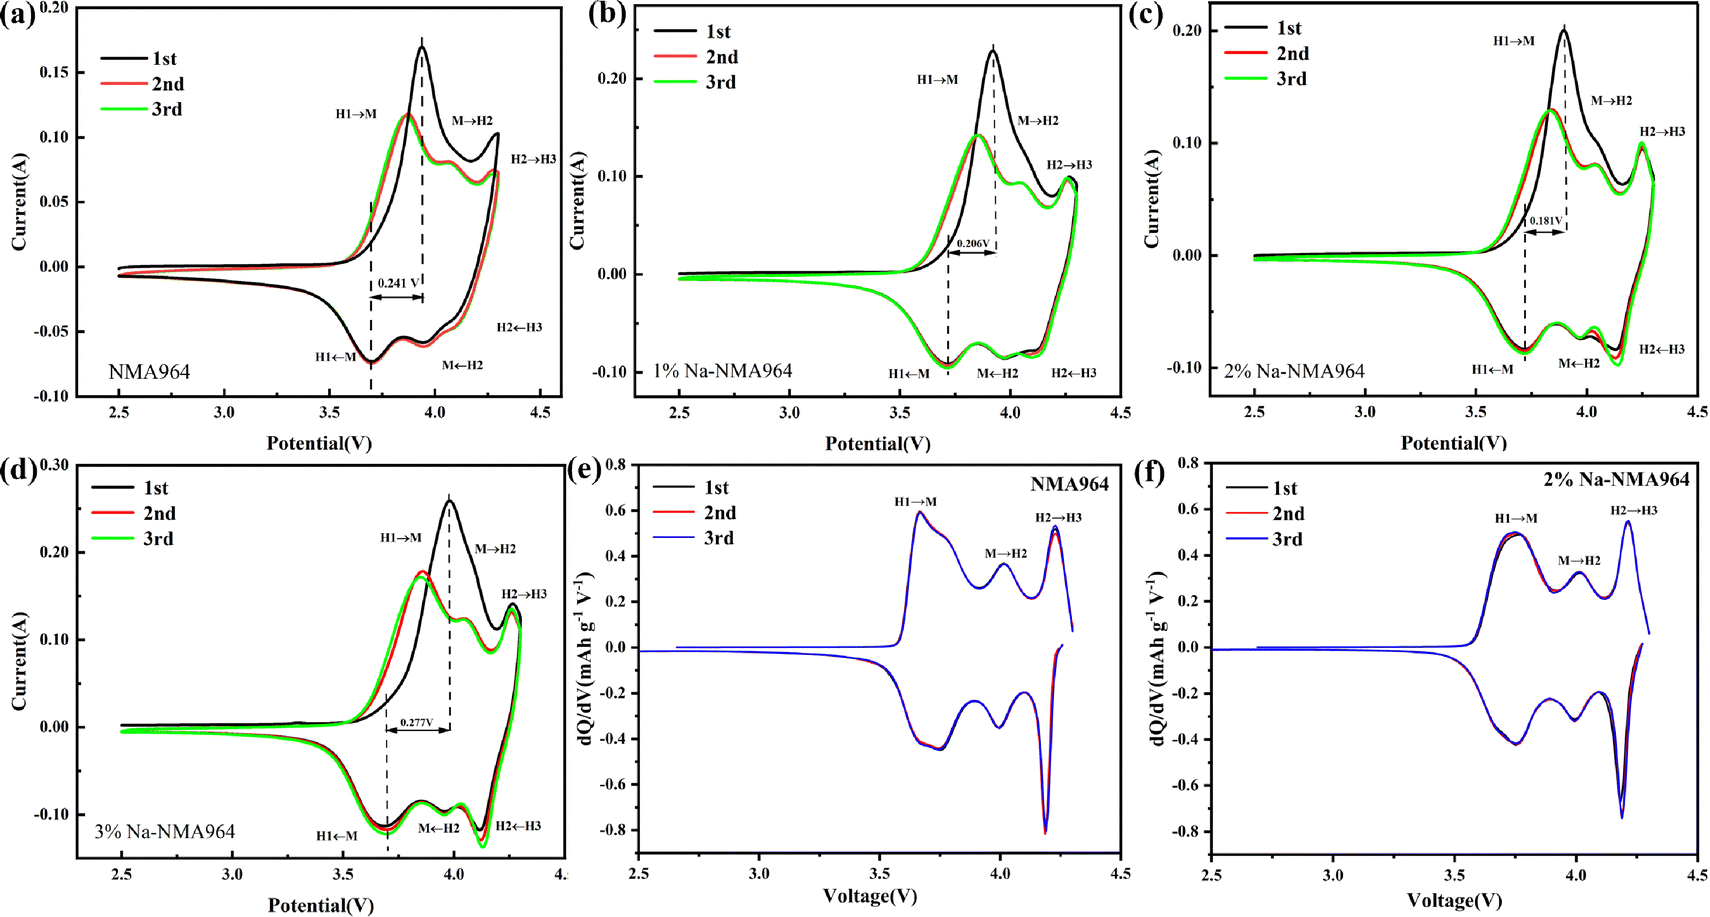 | ||
| Fig. 4 Initial three CV curves of (a) NMA964, (b) 1%Na-NMA964, (c) 2%Na-NMA964, and (d) 3%Na-NMA964 with a scan rate of 0.2 mV s−1. The dQ/dV profiles of the initial three cycles for (e) NMA964 and (f) 2%Na-NMA964. | ||
Fig. 5a shows the initial galvanostatic charge–discharge (GCD) curves of all samples at 0.1C within a voltage range of 2.5–4.3 V. As can be seen, the GCD curves for all samples exhibit similar platforms, indicating that the incorporation of sodium element could not induce additional redox reactions. The initial discharge capacities of the NMA964, 1%Na-NMA964, 2%Na-NMA964 and 3%Na-NMA964 electrodes are 220.93, 236.78, 252.98, and 205.90 mA h g−1, respectively. The 2%Na-NMA964 sample exhibits an optimum initial discharge capacity with a relatively high coulombic efficiency of 97.47%, which is primarily attributed to the fact that the larger ionic radius of the sodium ion could expand the diffusion channels of the lithium ions.50 The rate capability of the NMA964, 1%Na-NMA964, 2%Na-NMA964, and 3%Na-NMA964 samples was evaluated at various discharge current densities from 0.1 to 5C, and shown in Fig. 5b and c. With the increase of the current density, the discharge capacity of all samples decreases. Notably, the 2%Na-NMA964 sample delivers minimum capacity attenuation, which is mainly attributed to the broadened diffusion channels of lithium ions by the larger ion radius of Na+. Additionally, the discharge voltage difference ΔV for the 2% Na-NMA964 sample between 0.1C and 5C is 0.4231 V, which is less than that for the pristine material with ΔV = 0.4892 V (see Fig. 5d and e), showing a great electrochemical reversibility.
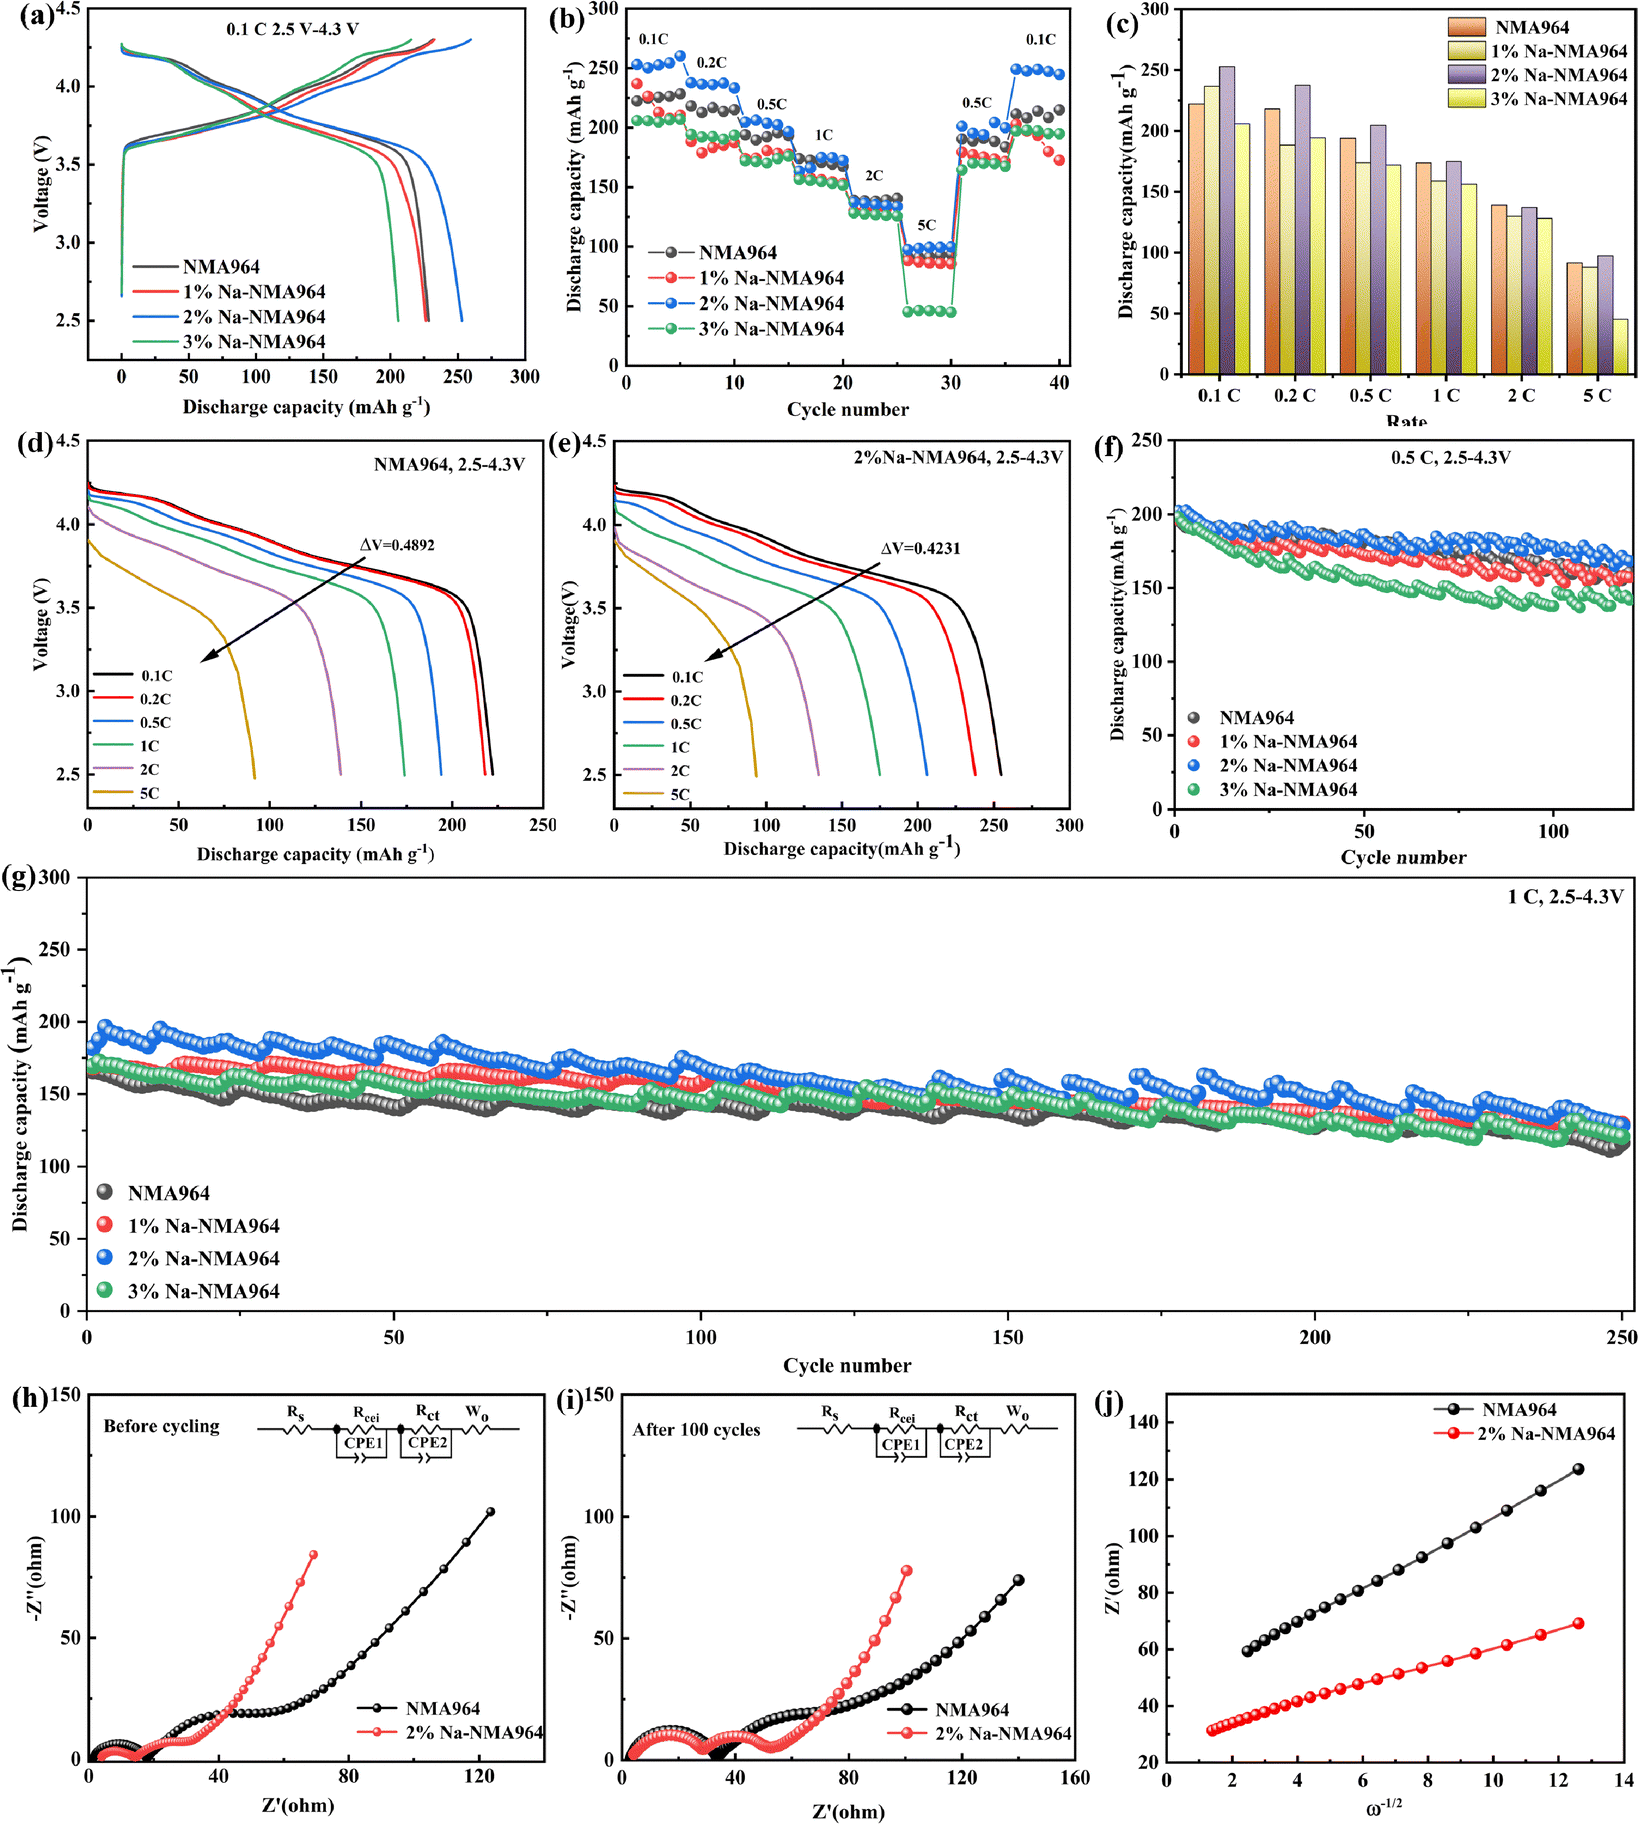 | ||
| Fig. 5 (a) The initial charge/discharge curves. (b) Rate capability. (c) Bar chart of rate performances. (d) and (e) Galvanostatic discharge curves at different rates of the NMA964 and 2%Na-NMA964 samples. (f) Cycling performances. (g) Cycling performances at 1C. (h)–(j) Nyquist plots and linear fitting plots between Z′ and ω−1/2. | ||
Fig. 5f shows the cycling performance of the fabricated samples. As can be seen, the pristine NMA964 electrode has an initial discharge capacity of 195.60 mA h g−1 at 0.5C, which is slightly lower than that for the 2%Na-NMA964 sample (202.75 mA h g−1). In addition, the NMA964 sample displays a relatively high capacity retention of 82.19% after 120 cycles, while the capacity retention for the 2%Na-NMA964 sample is 83.15%. Such great improvement in cycling performance is mainly attributed to the fact that Na-doping with an appropriate amount can effectively decrease the extent of Li+/Ni2+ cation mixing and expand the channels of Li+ transmission, thereby improving the discharge capacity.44,51 Moreover, the Na-doping strategy could stabilize the crystal structure by acting as a pillar-ion. However, the capacity retention of the 3%Na-NMA964 sample is significantly lower than that of the NMA964 material, which may be associated with the lattice distortion caused by excessive Na-doping.44,51 In order to further evaluate the electrochemical properties under harsh conditions, long-term cycling at a high current density was performed. As exhibited in Fig. 5g, the 2%Na-NMA964 sample achieves a reversible capacity of 135.30 mA h g−1 at 1C after 250 cycles, corresponding to the capacity retention of 74.37%, while the NMA964 sample only obtains 70.27%. Table 2 shows the comparison of the cycling performance of the optimized 2%Na-NMA964 sample with related nickel-rich cathode materials at 1C.52–57
| Material | Modification methods | 1st discharge capacity (mA h g−1) | Discharge capacity (mA h g−1) | Capacity retention/cycles | Voltage window (V) | Current density | Ref. |
|---|---|---|---|---|---|---|---|
| LiNi0.88Co0.09Al0.03O2 | Ta doping | – | 171 | 93%/100 | 2.7–4.3 | 1C | 52 |
| LiNi0.925Co0.03Mn0.045O2 | B doping | 195.7 | 149.3 | 76.3%/150 | 2.8–4.3 | 1C | 53 |
| LiNi0.9Mn0.1O2 | Al doping | 185.8 | 166.1 | 89.4%/180 | 2.7–4.3 | 1C | 54 |
| LiNi0.9Mn0.1O2 | Y/W doping | 183.0 | 150.2 | 82.1%/100 | 3.0–4.3 | 1C | 55 |
| LiNi0.83Co0.11Mn0.06O2 | K doping | – | – | 63.8%/200 | 2.8–4.3 | 1C | 56 |
| LiNi0.94Mn0.04Al0.02O2 | Mg/Nb/Zr co-doping | 199.6 | 147.6 | 73.94%/200 | 3–4.5 | 1C | 57 |
| LiNi0.9Mn0.06Al0.04O2 | Na doping | 181.94 | 135.30 | 74.37%/250 | 2.5–4.3 V | 1C | This work |
EIS is used to investigate the kinetic processes for the NMA964 and 2%Na-NMA964 samples before and after 100 cycles, and plotted in Fig. 5h and i. As can be seen, the EIS curves are generally composed of two semicircles in the high and mid-high frequency region, along with a slash in the low-frequency region. The intercept on the real axis indicates solution resistance (Rs), while the high-frequency region reflects the cathode material surface-film impedance (Rcei). The mid-high and low-frequency regions correspond to the charge transfer impedance (Rct) and Warburg impedance (Zw).58,59 The fitting results are given in Table 3. The Rct value of NMA964 increases from 18.90 to 59.60 Ω after 100 cycles, much higher than the Rct value of 2%Na-NMA964 (7.13 to 15.62 Ω). This may be due to the fact that Na-doping inhibits the harmful phase transition and enhances the kinetics of charge transfer between the electrode material and the electrolyte interface.29
| Sample | Cycling | R s (Ω) | R cei (Ω) | R ct (Ω) | D Li+ (cm2 s−1) |
|---|---|---|---|---|---|
| NMA964 | Fresh | 1.82 | 9.25 | 18.90 | 1.01 × 10⁻¹³ |
| 100 cycles | 2.11 | 34.70 | 59.60 | ||
| 2%Na-NMA964 | Fresh | 3.26 | 10.03 | 7.13 | 3.74 × 10⁻¹³ |
| 100 cycles | 3.10 | 25.36 | 15.62 |
Furthermore, to investigate the impact of Na-doping on lithium ion diffusion kinetics, the diffusion coefficients of the lithium ion for NMA964 and 2%Na-NMA964 are calculated based on the low-frequency region of the EIS. The calculation equation is as follows:
| Z′ = Rs + Rct + δω−1/2 | (1.1) |
| DLi+ = R2T2/(2A2n4F4C2δ2) | (1.2) |
In the equation, R represents the gas constant (8.314 J (mol K)−1), A signifies the surface area of the electrode, and T stands for the absolute temperature (298.15 K at 25 °C). F is Faraday's constant (96485 C mol−1). The symbol n denotes the number of electrons transferred in the electrochemical reaction, C represents the lithium-ion concentration in the material phase, ω is the angular frequency in the low-frequency region, and δ is the Warburg coefficient.60,61 The calculated DLi+ value of 2%Na-NMA964 is 3.74 × 10⁻¹³ cm2 s−1, which is much higher than 1.01 × 10⁻¹³ cm2 s−1 for NMA964. This result further demonstrates that Na-doping effectively enhances the insertion and extraction of Li+ by expanding the interlayer spacing.
The XRD pattern of the NMA964 and 2%Na-NMA964 after 250 cycles is shown in Fig. 6a and b. Compared to the 2%Na-NMA964 sample, the split peaks corresponding to 018/110 in the crystal structure of NMA964 nearly vanish, which implies the layer structure disruption. This is consistent with the aforementioned results of electrochemical performance. Secondary particle cracking has been considered as the failure mechanism of the Ni-rich cathode.62Fig. 6c and d reflects the morphologies of NMA964 and 2%Na-NMA964 after 250 cycles at 1C. The NMA964 sample contains several cracks, which may induce electrolytes to penetrate the particles along the crack and lead to side reactions. In contrast, the cycled 2%Na-NMA964 sample secondary microsphere maintains the original morphology, which may relate to inhibition of the lattice expansion and contraction during the H2–H3 phase transition, thanks to the lattice insertion of Na to enhance the structural stability.
 | ||
| Fig. 6 (a) and (b) XRD patterns of NMA964 and 2%Na-NMA964 after 250 cycles at 1C. SEM image for (c) NMA964 and (d) 2%Na-NMA964 after 250 cycles at 1C. | ||
4. Conclusion
In summary, a Na-doped 2%Na-NMA964 sample has been successfully synthesized by using a high-temperature solid-state method. Na-doping could effectively broaden the interlayer spacing due to its large ionic radius, and reduce the Li+/Ni2+ cation mixing degree by occupying the Li+ site. Moreover, as a pillar ion, it can inhibit the migration of Ni2+ to the Li+ layer at the deep delithiated state. As expected, the 2%Na-NMA964 sample has a relatively high initial capacity of 252.98 mA h g−1 at 0.1C within a voltage range of 2.5–4.3 V, and delivers an excellent capacity retention rate of 86.70% after 100 cycles at 0.5C, which is higher than that of the pristine NMA964 sample. The findings may provide an effective approach for exploring high-performance electrode materials for LIBs.Conflicts of interest
The authors declare that they have no known competing financial interests or personal relationships that could have appeared to influence the work reported in this paper.Data availability
The data that support the findings of this study are available upon request from the corresponding author. The data are not publicly available due to restrictions.Acknowledgements
This project was financially supported by the Nature Science Foundation of Qinghai (2023-ZJ-983Q).References
- W.-J. Yu, W. He, C. Wang, F. Liu, L. Zhu, Q. Tian, H. Tong and X. Guo, Confinement of TiO2 quantum dots in graphene nanoribbons for high-performance lithium and sodium ion batteries, J. Alloys Compd., 2022, 898, 162856 CrossRef CAS.
- W.-J. Yu, F. Liu, L. Zhang, Z. Liu, S. Wang and H. Tong, Lithiophilic ZnO confined in microscale carbon cubes as a stable host for lithium metal anodes, Carbon, 2022, 196, 92–101 CrossRef CAS.
- G. Zhang, G. Li, J. Wang, H. Tong, J. Wang, Y. Du, S. Sun and F. Dang, 2D SnSe cathode catalyst featuring an efficient facet-dependent selective Li2O2 growth/decomposition for Li-oxygen batteries, Adv. Energy Mater., 2022, 12, 2103910 CrossRef CAS.
- J. B. Goodenough and K.-S. Park, The Li-ion rechargeable battery: a perspective, J. Am. Chem. Soc., 2013, 135, 1167–1176 CrossRef CAS PubMed.
- N. Nitta, F. Wu, J. T. Lee and G. Yushin, Li-ion battery materials: present and future, Mater. Today, 2015, 18, 252–264 CrossRef CAS.
- B. Huang, L. Cheng, X. Li, Z. Zhao, J. Yang, Y. Li, Y. Pang and G. Cao, Layered cathode materials: precursors, synthesis, microstructure, electrochemical properties, and battery performance, Small, 2022, 18, 2107697 CrossRef CAS PubMed.
- T. Guo, C. Guo, P. Huang, Q. Han, F. Wang, H. Zhang, H. Liu, Y.-C. Cao, Y. Yao and Y. Huang, Rejuvenating LiNi0.5Co0.2Mn0.3O2 cathode directly from battery scraps, eScience, 2023, 3, 100091 CrossRef.
- X. Wang, Y.-L. Ding, Y.-P. Deng and Z. Chen, Ni-rich/Co-poor layered cathode for automotive Li-ion batteries: promises and challenges, Adv. Energy Mater., 2020, 10, 201903864 Search PubMed.
- J. W. Choi and D. Aurbach, Promise and reality of post-lithium-ion batteries with high energy densities, Nat. Rev. Mater., 2016, 1, 1–16 Search PubMed.
- B. Xu, D. Qian, Z. Wang and Y. S. Meng, Recent progress in cathode materials research for advanced lithium ion batteries, Mater. Sci. Eng. R. Rep., 2012, 73, 51–65 CrossRef CAS.
- S. Lee and A. Manthiram, Can cobalt be eliminated from lithium-ion batteries?, ACS Energy Lett., 2022, 7, 3058–3063 CrossRef CAS.
- S. W. D. Gourley, T. Or and Z. Chen, Breaking free from cobalt reliance in lithium-ion batteries, iScience, 2020, 23, 101505 CrossRef CAS PubMed.
- U. Shi, F. Liu, W. Liu, H. Wang, K. Han, C. Yang, J. Wu, J. Meng, C. Niu, C. Han and X. Wang, Cation mixing regulation of cobalt-free high-nickel layered cathodes enables stable and high-rate lithium-ion batteries, Nano Energy, 2024, 123, 109410 CrossRef.
- D. Wang, C. Xin, M. Zhang, J. Bai, J. Zheng, R. Kou, J. Y. P. Ko, A. Huq, G. Zhong, C.-J. Sun, Y. Yang, Z. Chen, Y. Xiao, K. Amine, F. Pan and F. Wang, Intrinsic role of cationic substitution in tuning Li/Ni mixing in high-Ni layered oxides, Chem. Mater., 2019, 31, 2731–2740 CrossRef CAS.
- C. Xu, P. J. Reeves, Q. Jacquet and C. P. Grey, Phase behavior during electrochemical cycling of Ni-rich cathode materials for Li-ion batteries, Adv. Energy Mater., 2021, 11, 2003404 CrossRef CAS.
- J.-Y. Liao, S.-M. Oh and A. Manthiram, Core/double-shell type gradient Ni-rich LiNi0.76Co0.10Mn0.14O2 with high capacity and long cycle life for lithium-ion batteries, ACS Appl. Mater. Interfaces, 2016, 8, 24543–24549 CrossRef CAS PubMed.
- A. Gomez-Martin, F. Reissig, L. Frankenstein, M. Heidbüchel, M. Winter, T. Placke and R. Schmuch, Magnesium substitution in Ni-rich NMC layered cathodes for high-energy lithium ion batteries, Adv. Energy Mater., 2022, 12, 2103045 CrossRef CAS.
- U.-H. Kim, S.-B. Lee, J.-H. Ryu, C. S. Yoon and Y.-K. Sun, Optimization of Ni-rich Li[Ni0.92-xCo0.04Mn0.04Alx]O2 cathodes for high energy density lithium-ion batteries, J. Power Sources, 2023, 564, 232850 CrossRef CAS.
- G.-T. Park, N.-Y. Park, T.-C. Noh, B. Namkoong, H.-H. Ryu, J.-Y. Shin, T. Beierling, C. S. Yoon and Y.-K. Sun, High-performance Ni-rich Li[Ni0.9-xCo0.1Alx]O2 cathodes via multi-stage microstructural tailoring from hydroxide precursor to the lithiated oxide, Energy Environ. Sci., 2021, 14, 5084–5095 RSC.
- X. Ou, T. Liu, W. Zhong, X. Fan, X. Guo, X. Huang, L. Cao, J. Hu, B. Zhang, Y. S. Chu, G. Hu, Z. Lin, M. Dahbi, J. Alani, K. Amine, C. Yang and J. Lu, Enabling high energy lithium metal batteries via single-crystal Ni-rich cathode material co-doping strategy, Nat. Commun., 2022, 13, 2319 CrossRef CAS PubMed.
- H. Yu, Y. Cao, L. Chen, Y. Hu, X. Duan, S. Dai, C. Li and H. Jiang, Surface enrichment and diffusion enabling gradient-doping and coating of Ni-rich cathode toward Li-ion batterie, Nat. Commun., 2021, 12, 4564 CrossRef CAS PubMed.
- Z. Yu, Q. Tong, Y. Cheng, P. Yang, G. Zhao, H. Li, W. An, D. Yan, X. Lu and B. Tian, Enabling 4.6 V LiNi0.6Co0.2Mn0.2O2 cathodes with excellent structural stability: combining surface LiLaO2 self-assembly and subsurface La-pillar engineering, Energy Mater., 2022, 2, 200037 CAS.
- F. Chen, X. Ma, X. Zhu, W. Dai, C. Yao, Z. Chen and C. Liu, Investigation of Li3PO4 coating and Nb5+ doping effect on the crystal structure and electrochemical properties of Ni-rich LiNi0.85Co0.05Mn0.10O2 cathode, Electrochem. Soc., 2021, 168, 090540 CrossRef CAS.
- J.-L. Shi, H. Sheng, X.-H. Meng, X.-D. Zhang, D. Lei, X. Sun, H. Pan, J. Wang, X. Yu, C. Wang, Y. Li and Y.-G. Guo, Size controllable single-crystalline Ni-rich cathodes for high-energy lithium-ion batteries, Natl. Sci. Rev., 2023, 10, 226 CrossRef PubMed.
- D.-H. Lee, M. Avdeev, D.-I. Kim, W. H. Shin, J. Hong and M. Kim, Regulating single-crystal LiNiO2 size and surface coating toward a high-capacity cathode for lithium-ion batteries, ACS Appl. Energy Mater., 2023, 6, 5309–5317 CrossRef CAS.
- J. Wang, X. Lu, Y. Zhang, J. Zhou, J. Wang and S. Xu, Grain size regulation for balancing cycle performance and rate capability of LiNi0.9Co0.055Mn0.045O2 single crystal nickel-rich cathode materials, J. Energy Chem., 2022, 65, 681–687 CrossRef CAS.
- K. Wu, G. Jia, X. Shangguan, G. Yang, Z. Zhu, Z. Peng, Q. Zhuge, F. Li, X. Cui and S. Liu, Improving the electrochemical performance of Ni-rich LiNi0.8Co0.1Mn0.1O2 by enlarging the Li layer spacing, Energy Technol., 2018, 6, 1885–1893 CrossRef CAS.
- Z. Chen, Z. Zhang, P. Liu, S. Wang, W. Zhang and D. Chen, Facile preparation of carbon-LiNi1/3Co1/3Mn1/3O2 with enhanced stability and rate capability for lithium-ion batteries, J. Alloys Compds., 2019, 780, 643–652 CrossRef CAS.
- J. Park, S. Lee and W. Choi, Surface-intensive doping of Na via pH-dependent polymer for Co-free Ni-rich cathodes in Li-ion batteries, Chem. Eng. J., 2024, 488, 150807 CrossRef CAS.
- L. Feng, Y. Liu, L. Wu, W. Qin and Z. Yang, Enhancement on inter-layer stability on Na-doped LiNi0.6Co0.2Mn0.2O2 cathode material, Powder Technol., 2021, 388, 166–175 CrossRef CAS.
- H. Dong, G. Liu, S. Li, S. Deng, Y. Cui, H. Liu, H. Liu and X. Sun, Design of a 3D-porous structure with residual carbon for high-performance Ni-rich cathode materials, ACS Appl. Mater. Interfaces, 2018, 11, 2500–2506 CrossRef PubMed.
- F. Li, Z. Liu, C. Liao, X. Xu, M. Zhu and J. Liu, Gradient boracic polyanion doping-derived surface lattice modulation of high-voltage Ni-rich layered cathodes for high-energy-density Li-ion batteries, ACS Energy Lett., 2023, 8, 4903–4914 CrossRef CAS.
- C.-Y. Hu, J. Guo, Y. Du, H.-H. Xu and Y.-H. He, Effects of synthesis conditions on layered Li[Ni1/3Co1/3Mn1/3]O2 positive-electrode via hydroxide co-precipitation method for lithium-ion batteries, Trans. Nonferr. Metals Soc. China, 2011, 21, 114–120 CrossRef CAS.
- M. Jo, M. Noh, P. Oh, Y. Kim and J. Cho, A new high power LiNi0.81Co0.1Al0.09O2 cathode material for lithium-ion batteries, Adv. Energy Mater., 2014, 4, 1301583 CrossRef.
- Y. Koyama, I. Tanaka, H. Adachi, Y. Makimura and T. Ohzuku, Crystal and electronic structures of superstructural Li1-x[Co1/3Ni1/3Mn1/3]O2 (0 ≤ x ≤ 1), J. Power Sources, 2003, 119, 644–648 CrossRef.
- Z. Liu, A. Yu and J. Y. Lee, Synthesis and characterization of LiNi1-x-yCoxMnyO2 as the cathode materials of secondary lithium batteries, J. Power Sources, 1999, 81, 416–419 CrossRef.
- D. Zhang, Y. Liu, L. Wu, L. Feng, S. Jin, R. Zhang and M. Jin, Effect of Ti ion doping on electrochemical performance of Ni-rich LiNi0.8Co0.1Mn0.1O2 cathode material, Electrochim. Acta., 2019, 328, 135086 CrossRef CAS.
- H. Xie, K. Du, G. Hu, Z. Peng and Y. Cao, The role of sodium in LiNi0.8Co0.15Al0.05O2 cathode material and its electrochemical behaviors, J. Phys. Chem. C, 2016, 120, 3235–3241 CrossRef CAS.
- Y. Shen, X. Yao, J. Zhang, S. Wang, D. Zhang, D. Yin, L. Wang, Y. Zhang, J. Hu, Y. Cheng and X. Li, Sodium doping derived electromagnetic center of lithium layered oxide cathode materials with enhanced lithium storage, Nano Energy, 2022, 94, 106900 CrossRef CAS.
- T. He, L. Chen, Y. Su, Y. Lu, L. Bao, G. Chen, Q. Zhang, S. Chen and F. Wu, The effects of alkali metal ions with different ionic radii substituting in Li sites on the electrochemical properties of Ni-rich cathode materials, J. Power Sources, 2019, 441, 227195 CrossRef CAS.
- L. Wu, X. Tang, X. Chen, Z. Rong, W. Dang, Y. Wang, X. Li, L. Huang and Y. Zhang, Improvement of electrochemical reversibility of the Ni-rich cathode material by gallium doping, J. Power Sources, 2020, 445, 227337 CrossRef CAS.
- Y. Qu, W. Tang, H. Liu, C. Li, L. Zou, Z. Chen, Z. Yang, J. Su and W. Zhang, Threefold modification with dual-cation doping and LiVO3 coating boosts long-term cyclability and rate capability of Li-rich cathode materials for lithium-ion batteries, Ind. Eng. Chem. Res., 2023, 62, 10467–10476 CrossRef CAS.
- Z. Yang, X. Guo, W. Xiang, W. Hua, J. Zhang, F. He, K. Wang, Y. Xiao and B. Zhang, K-doped layered LiNi0.5Co0.2Mn0.3O2 cathode material: towards the superior rate capability and cycling performance, J. Alloys Compd., 2017, 699, 358–365 CrossRef CAS.
- H. Zhu, H. Yu, H. Jiang, Y. Hu, H. Jiang and C. Li, High-efffciency Mo doping stabilized LiNi0.9Co0.1O2 cathode materials for rapid charging and long-life Li-ion batteries, Chem. Eng. Sci., 2020, 217, 115518 CrossRef CAS.
- Y. Lv, S. Huang, S. Lu, W. Ding, X. Yu, G. Liang, J. Zou, F. Kang, J. Zhang and Y. Cao, B2O3/LiBO2 dual-modification layer stabilized Ni-rich cathode for lithium-ion battery, J. Power Sources, 2022, 536, 231510 CrossRef CAS.
- J. Yang, X. Liang, H.-H. Ryu, C. S. Yoon and Y.-K. Sun, Ni-rich layered cathodes for lithium-ion batteries: from challenges to the future, Energy Storage Mater., 2023, 63, 102969 CrossRef.
- J. Zuo, J. Wang, R. Duan, Y. Bai, K. Xu, K. Zhang, J. Wang, K. Zhang, Z. Yang, Z. Yang, M. Li, G. Cao, Q. Jiang, W. Liu, J. Wang, W. Li and X. Li, Grain binding derived reinforced interfacial mechanical behavior of Ni-rich layered cathode materials, Nano Energy, 2024, 121, 109214 CrossRef CAS.
- X. Qu, H. Huang, T. Wan, L. Hu, Z. Yu, Y. Liu, A. Dou, Y. Zhou, M. Su, X. Peng, H.-H. Wu, T. Wu and D. Chu, An integrated surface coating strategy to enhance the electrochemical performance of nickel-rich layered cathodes, Nano Energy, 2022, 32, 2002718 Search PubMed.
- T. Wang, M. Yuan, S. Xie, J. Liu, J. Yan, Z. Li and J. Peng, Synergistic effect of Al-B co-doping to boost the LiNi0.9Co0.05Mn0.05O2 properties in lithium-ion batteries, Ceram. Int., 2022, 48, 20605–20611 CrossRef CAS.
- J. Wang, W. Lin, B. Wu and J. Zhao, Syntheses and electrochemical properties of the Na-doped LiNi0.5Mn1.5O4 cathode materials for lithium-ion batteries, Electrochim. Acta, 2014, 14, 245–253 Search PubMed.
- C. M. Subramaniyam, H. Celio, K. Shiva, H. Gao, J. B. Goodneough, H. K. Liu and S. X. Dou, Long stable cycling of fluorine-doped nickel-rich layered cathodes for lithium batteries, Sustain, Energy Fuels, 2017, 1, 1292–1298 CAS.
- S. Jamil, R. Yu, Q. Wang, M. Fasehullah, Y. Huang, Z. Yang, X. Yang and X. Wang, Enhance cycling stability of nickel-rich layered oxide by tantalum doping, J. Power Sources, 2020, 473, 228597 CrossRef CAS.
- Z. Luo, G. Hu, W. Wang, K. Du, Z. Peng, J. Zeng, L. Li and Y. Cao, Enhancing the electrochemical performance of Co-less Ni-rich LiNi0.925Co0.03Mn0.045O2 cathode material via co-modification with Li2B4O7 coating and B3+ doping, J. Power Sources, 2022, 548, 232092 CrossRef CAS.
- H. Feng, Y. Leng, T. Chen, Y. Sun, C. Hai and Y. Zhou, Stabilizing LiNi0.9Mn0.1O2 structure by Al3+ doping for cobalt-free lithium-ion batteries, J. Alloy Compd., 2023, 960, 170676 CrossRef CAS.
- H. Feng, Y. Xu, Y. Zhou, J. Song, J. Yang and Q. Tan, The Y3+ and W6+ co-doping into Ni-rich Co-free single-crystal cathode LiNi0.9Mn0.1O2 for achieving high electrochemical properties in lithium-ion batteries, J. Alloys Compd., 2024, 976, 173043 CrossRef CAS.
- W. Xiao, J.-L. Wang, Z.-C. Yi, C.-J. Liu, C. Miao, Y. Xin and S.-Q. Nie, Dual modification of LiNi0.83Co0.11Mn0.06O2 cathode materials by K+ doping and Li3PO4 coating for lithium ions batteries, Rare Met., 2024, 43, 3007–3018 CrossRef CAS.
- J. Yan, Z. Yang, H. Kan, Y. Zha, C. Li, Q. Meng, P. Dong and Y. Zhang, Microstructure and electrochemical properties of Mg/Nb/Zr co-doped LiNi0.94Mn0.04Al0.02O2 cathode materials, Ceram. Int., 2024, 50, 24872–24880 CrossRef CAS.
- T. Yang, N. Zhang, Y. Lang and K. Sun, Enhanced rate performance of carbon-coated LiNi0.5Mn1.5O4 cathode material for lithium ion batteries, Electrochim. Acta, 2011, 56, 4058–4064 CrossRef CAS.
- J. Yao, Y. Li, G. Pan, X. Jin, K. Luo and S. Le, Electrochemical property of hierarchical flower-like α-Ni(OH)2 as an anode material for lithium-ion batteries, Solid State Ionics, 2021, 363, 115595 CrossRef CAS.
- L. Li, Z. Chen, Q. Zhang, M. Xu, X. Zhou, H. Zhu and K. Zhang, A hydrolysis-hydrothermal route for the synthesis of ultrathin LiAlO2-inlaid LiNi0.5Co0.2Mn0.3O2 as a high-performance cathode material for lithium ion batteries, J. Mater. Chem. A, 2015, 3, 894–904 RSC.
- X. Li, K. Zhang, M. Wang, Y. Liu, M. Qu, W. Zhao and J. Zheng, Dual functions of zirconium modification on improving the electrochemical performance of Ni-rich LiNi0.8Co0.1Mn0.1O2, Sustainable Energy Fuels, 2018, 2, 413–421 RSC.
- L. Qiao, Q. You, X. Wu, H. Min, X. Liu and H. Yang, Mo doping to modify lattice and morphology of the LiNi0.9Co0.05Mn0.05O2 cathode toward high-efficient lithium-ion storage, ACS Appl. Mater. Interfaces, 2024, 16, 4772–4783 CrossRef CAS PubMed.
Footnote |
| † Xiaoyi Hou and Xi Wu contributed equally to this article. |
| This journal is © the Owner Societies 2025 |