
 Open Access Article
 This Open Access Article is licensed under a Creative Commons Attribution-Non Commercial 3.0 Unported Licence
Towards voltammetric point of care detection of leucovorin†
Pui Hang
Shum
and
Lynn
Dennany
 *
*
WESTChem Department of Pure and Applied Chemistry, University of Strathclyde, Technology and Innovation Centre, 99 George Street, Glasgow, G1 1RD, UK. E-mail: lynn.dennany@strath.ac.uk
First published on 25th March 2024
Abstract
Current healthcare trends have seen an increased emphasis on the move towards personalised precision medicine to tailor treatments to the individual and their response to diseases and disease therapies. This highlighting a transition from traditional “one size fits all” to a more nuanced approach. Despite advancements in fundamental knowledge to facilitate personalised prevision approaches, lack of resources to implement such plans remains one of the largest hurdles to overcome. Monitoring of drug therapies is one key aspect that could aid in the evolution of precision medicine alongside the development of drugs and targeted treatment systems. This contribution illustrates the potential of square wave voltammetry (SWV) as a proof-of-concept for monitoring of circulating blood concentrations of treatment therapies within artificial urine, using leucovorin calcium (LV) as a model cancer therapy drug. A low cost, easy-to-use and portable sensor has been developed and successfully employed for the detection of LV over the linear range 0.5–30 μM which represents the therapeutically relevant concentrations for LV within artificial urine without any prior sample preparation required with a limit of detection of 2.63 μM and initial investigations into saliva and serum as biological matrices. The developed sensor describe herein exhibits a proof-of-concept for the engagement of such electrochemical sensors as point-of-care devices, where the sensors ease of use and removal of time-consuming and complex sample preparation methods will ultimately increase its usability by physicians, widening the avenues where electrochemical sensors could be employed.
1 Introduction
Precision medicine has the potential to have a substantial impact on patients, health care delivery systems and therapy. Personalised or tailored treatments shift the focus toward the individual and their unique response to disease behaviours as well as receptiveness towards a particular drug therapy.1–8 Therefore, these tailored treatments place a greater emphasis upon monitoring an individual's response to a number of key disease or treatment characteristics, including circulating blood concentrations of treatment therapies. Monitoring these may allow clinicians to determine therapeutic dosage in real-time curtailing some of the potential side effects that can be experienced.9There is currently still a gap in the current healthcare system to implement targeted or tailored treatments due to lack of resources and approaches to monitoring these key disease or treatment characteristics at point of care or treatment. Development of point-of-care sensors that would facilitate the real-time monitoring of drug therapies could start to address this current challenge. The development of these sensors could enable the increase in the frequency of patient assessments while increasing the detection of changes in disease and treatment monitoring in a shorter timeframe, allowing clinicians to make decisive changes as required to optimise patient treatments and, hopefully, increase recoveries.
Leucovorin calcium (LV, Fig. 1), a reduced derivative of folic acid, specifically the 5-formly derivative of tetrahydrofolic acid, is a key therapeutic component with diverse applications across various medical treatments.10,11 Its pivotal role is evident in high-dose methotrexate (MTX) therapy for osteosarcoma and low-dose MTX therapy for rheumatoid arthritis patients, where it serves as an antidote to mitigate methotrexate-induced toxicity, commonly referred to as leucovorin “rescue”.12–15 Beyond its role in methotrexate therapy, LV is instrumental in countering toxic side effects of folate antagonists.16,17 Additionally, LV finds application in adjuvant postoperative treatment with 5-fluorouracil (5-FU) for colon and colorectal cancer, significantly reducing the risk of cancer relapse.18–20 The versatile use of LV extends to the treatment of megaloblastic anemias due to folic acid deficiency, particularly when oral therapy is impractical.20 Notably, off-label uses encompass neoadjuvant treatment in bladder cancer, mitigation of methanol toxicity as a cofactor, and the treatment of various cancers such as oesophageal, gastric, and pancreatic, as well as prevention of hematological toxicity in patients with AIDS and management of ectopic pregnancy.21–23 The significance of LV in enhancing chemotherapy efficacy, managing poisonings, and addressing folate deficiencies underscores the critical necessity for precise and rapid detection methodologies within clinical settings.
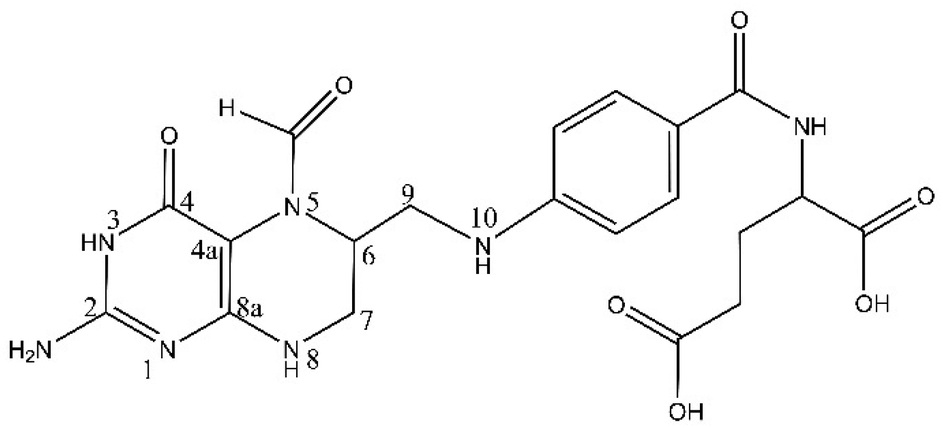 | ||
| Fig. 1 Structure of LV. | ||
Various analytical methodologies have been developed to detect and determine LV in pharmaceutical formulations and biological samples.24–27 These primarily include fluorescence and chromatographic approaches which due to a variety of reasons are not always suitable for portable or point-of-care applications. Efficient clinical management hinges upon accurate and timely LV level measurements, demanding the development and optimization of sensitive and portable diagnostic tools. Addressing this need, this study delves into the realm of electrochemical sensing, exploring the applicability of square wave voltammetry (SWV) as a robust method for LV detection on screen-printed carbon electrodes (SPCEs).
The allure of electrochemical sensing lies in its potential to furnish sensitive, rapid, and cost-effective diagnostic platforms, particularly pertinent in the domain of point-of-care (POC) diagnostics. SWV, a technique under the umbrella of electrochemical methods, offers distinct advantages such as enhanced sensitivity and specificity, making it an attractive candidate for LV detection.28–30 Furthermore, the utilization of SPCEs adds to this method's appeal, given their versatility, ease of fabrication, and cost-effectiveness.
Previous electrochemical studies exploring LV detection have utilized differential pulse voltammetry (DPV)32 and electrochemiluminescence (ECL).2,31,33 However, the DPV study did not explore its detection within complex biological matrices but focus on the electrochemistry analysis using different electrodes. While the ECL approach showcased a wide dynamic detection range and excellent limits of detection, it did exhibit specific limitations, primarily requiring an alkaline environment with a pH of 12 for optimal LV detection, restricting its practical clinical implementation due to pH constraints. SWV presents a versatile and robust alternative, capable of detecting LV at lower concentrations without pH restrictions of the ECL luminophore, surpassing the limitations observed in prior methods. To the best of our knowledge, SWV has not been utilized for determination of LV using SWV.
The pivotal outcome of this study lies in its demonstration of successful LV detection and quantification across a range of clinically relevant concentrations using SWV on SPCEs. The developed sensor, leveraging the amalgamation of SWV and SPCEs, showcases not only promising sensitivity but also remarkable selectivity towards LV. These results underscore the potential integration of this sensor into point-of-care diagnostic devices, promising expedited and accurate LV measurements crucial for optimizing therapeutic interventions and enhancing patient care outcomes. Therefore, the approach described here illustrates the capability of SWV to detect LV at therapeutically relevant concentrations, without being confined by specific pH requirements, holding substantial promise for clinical applications in optimizing therapeutic management and enhancing patient care outcomes.
2 Materials and methods
2.1 Reagents and materials
Leucovorin calcium, uric acid, potassium chloride, magnesium sulfate, calcium chloride, ammonium chloride, potassium oxalate monohydrate, monosodium phosphate, dipotassium phosphate and human pooled serum were purchased from Sigma Aldrich. Tri-sodium citrate dihydrate, creatinine, ammonium chloride, potassium oxalate monohydrate and sodium sulfate were purchased from Thermo Fischer Scientific. Sodium chloride was purchased from VWR. Urea was purchased from GE Healthcare Life Sciences. Artificial saliva (Bioténe® oral balance gel) was commercially purchased and used as received. All chemicals were used as received and all solutions prepared in Milli-Q water (18 MΩ cm−1).2.2 Instrumentation
All electrochemical measurements were performed utilising the PalmSens EmStat Blue potentiostat, controlled by the PSTrace software. Electrochemical measurements were performed using GSI Technologies carbon screen printed electrodes (SPCE) with a 5 mm carbon working electrode, a carbon paste counter electrode and an Ag paste quasi-reference electrode. Cyclic voltammetry (CV) was monitored over the potential range 0 ≤ E ≤ 1.5 V at a scan rate of 100 mV s−1. Square wave voltammetry (SWV) parameters specified pulse amplitude 100 mV and frequency of 40 Hz. The measurements were all undertaken at room temperature.2.3 Electrochemical detection of LV
LV was diluted with 0.1 M NaCl in Milli-Q water to obtain varying concentration ranges (0.5–30 μM). For biological matrix samples, LV was dissolved in 0.1 M NaCl and added directly to the corresponding matrices to obtain simulated biological samples. When not in use all samples were stored at 2–8 °C. Given the very small volumes used within this analysis, pH adjustments were done using either 1 M NaOH or HCl as required.2.4 Preparation of artificial saliva samples
The artificial saliva sample diluent was formulated by blending artificial saliva gel with 0.1 M NaCl in a w/w ratio of 1-to-5. A 10 μM and 60 μM LV artificial saliva sample was then prepared by combining artificial saliva gel, 0.1 M NaCl. All samples were prepared fresh and kept at 4 °C when not in use.2.5 Preparation of artificial urine sample
Artificial urine stock solution was preparing 11.965 mM sodium sulfate (Na2SO4), 1.487 mM uric acid (C5H4N4O3), 2.45 mM tri-sodium citrate dihydrate (Na3C6H5O7·2H2O), 7.791 mM hydroxylmethylimidazolim (C4H7N2O), 21.619 mM potassium chloride (KCl), 39.387 mM sodium chloride (NaCl), 1.663 mM calcium chloride (CaCl2), 23.667 mM ammonium chloride (NH4Cl), 0.19 mM potassium oxalate monohydrate (K2C2O4·7H2O), 4.389 mM magnesium sulfate heptahydrate (MgSO4·7H2O), 18.667 mM sodium dihydrogen phosphate (NaH2PO4·2H2O), and 4.667 mM potassium hydrogen phosphate (K2HPO4·2H2O) in 1000 mL of deionized water outlined in previous study.27To create the artificial urine sample diluent, the artificial urine stock solution was diluted with 0.1 M NaCl in a ratio of 1![[thin space (1/6-em)]](https://www.rsc.org/images/entities/char_2009.gif) :500 (v/v). Standard stock LV solution was subsequently added directly to the appropriate volume of the urine sample diluent to generate simulated biological samples. All samples were freshly prepared and stored at 4 °C when not in use.
:500 (v/v). Standard stock LV solution was subsequently added directly to the appropriate volume of the urine sample diluent to generate simulated biological samples. All samples were freshly prepared and stored at 4 °C when not in use.
3 Results and discussion
3.1 Electrochemical behaviour of LV
The electrochemical behavior of LV on a variety of electrode materials has previously been demonstrated.33 In order to understand the electrochemical behaviour of LV upon the unmodified carbon paste SPCE utilised within this contribution, CV were obtained. The resulting CV, Fig. 2, shows two anodic peaks at ∼0.70 V and 1.26 V, in agreement with previous studies. This dual anodic wave system, described previously, indicates that the oxidation of LV proceeds via a two-step process. This has been shown to involve two electrons and two protons ultimately forming dehydrofolinic acid.33 This proposed mechanism is based upon the oxidation of folic acid, and it is hypothesized that this follows a similar electro-oxidation mechanism.33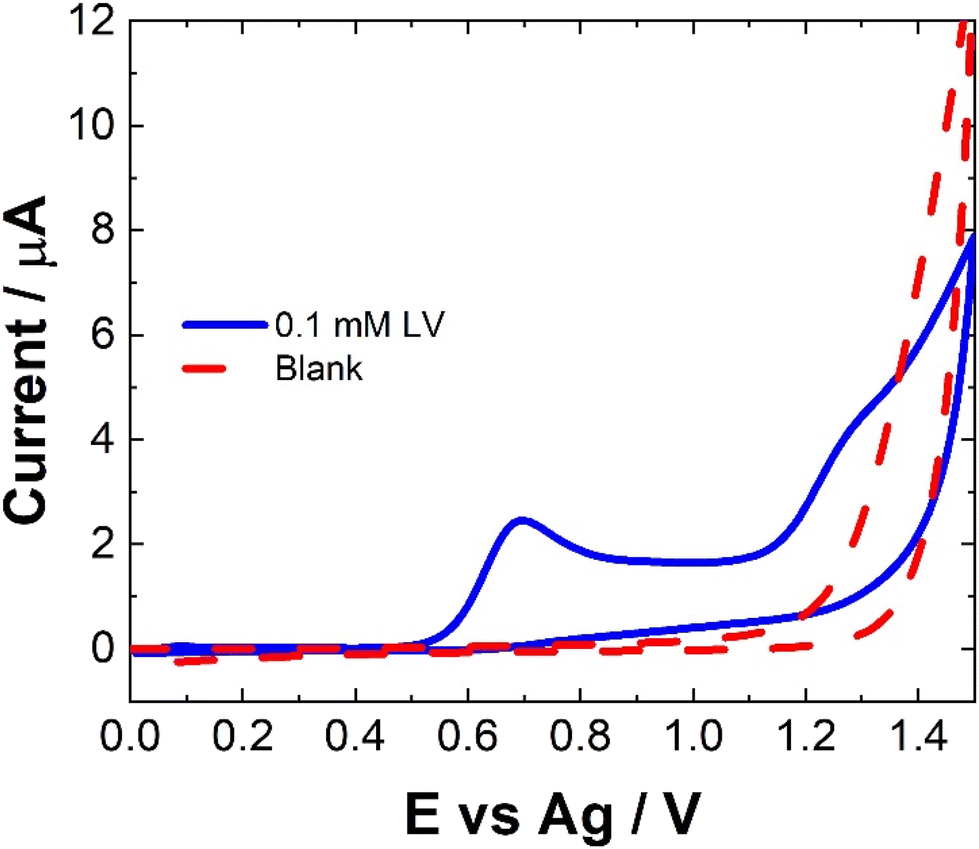 | ||
| Fig. 2 Typical CV of 0.1 mM LV (blue solid line) in 0.1 M NaCl and 0.1 M NaCl (red dashed line) collected from an unmodified SPCE at a scan rate of 100 mV s−1 across a potential range of 0.0 ≤ E ≤ 1.5 V vs. Ag. | ||
For CV, concentrations in excess of the therapeutic dosage typically used for patient treatments where utilized. Therefore, the utilization of SWV was undertaken. Fig. 3 shows a typical SWV of LV, the identified peaks correlate with the features observed in Fig. 2, representing the currents generated in response to the applied potential during the waveform cycle. From the voltammogram, the first peak at ∼0.6 V shows an almost 23-fold increase in change of current compared to the second peak at ∼1.15 V.
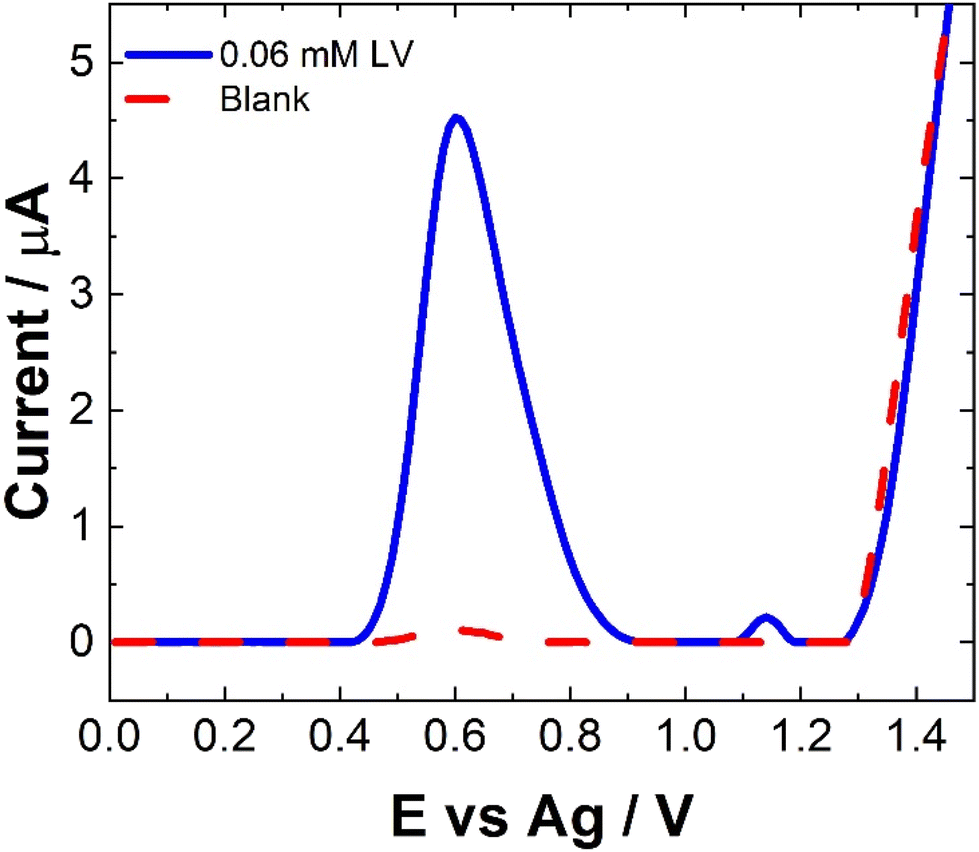 | ||
| Fig. 3 Typical SWV of 0.06 mM LV (blue solid line) in 0.1 M NaCl and 0.1 M NaCl (red dashed line) collected from an unmodified SPCE scanned over the potential range 0 ≤ E ≤ 1.5 V vs. Ag at pulse amplitude of 100 mV and frequency of 40 Hz across a potential range of 0.0 ≤ E ≥ 1.5 V vs. Ag. | ||
3.2 Evaluating the impact of pH on the electrochemical detection
The pH of a matrix can strongly impact the electrochemical behavior of a molecule depending on its pKa and as such is an essential parameter to examine, particularly in relation to complex biological matrices.34,35 The current dependence (ip) of LV on pH was found to be consistent for both CV and SWV as shown in Fig. 4. The pKa values reported for the LV free acid are 3.1, 4.8 and 10.3.36 The first two being attributed to the carboxylic acid moieties and the 10.4 associated with the hydroxyl group at 4 position on the amine functional group. The result of this, is that pH affects the oxidation peaks differently. At lower pH values (ranging from 2 to 5), LV exhibited discernible dual anodic peaks. Notably, the initial peak, ∼0.6 V, increased with increasing pH, registering the lowest at pH 2 and the highest response at pH 5. At lower pH values (<3), a secondary peak was observed. The second oxidation peak showed a peak maximum at pH 9 (see ESI Fig. S1 and S2†).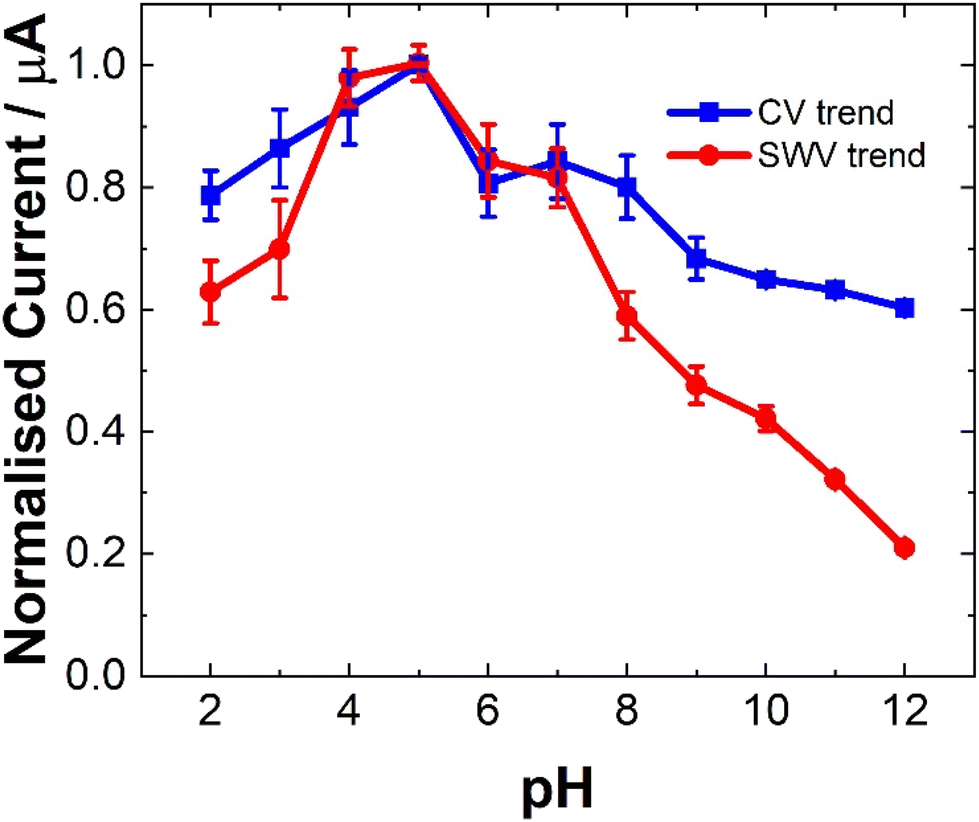 | ||
| Fig. 4 Typical tend for the dependence of current from CV of 0.1 mM LV in 0.1 M NaCl (blue line) and SWV of 0.06 mM LV in 0.1 M NaCl (red line). The current was normalised by background correction and normalised based on the maximum current response for the peak at ∼0.6 V for both CV and SWV for clarity. Error bars represent the standard deviation obtained from triplicate results. | ||
The observation of dual peaks at lower pH, converging into singular peaks at higher pHs, suggests a transition from multi-step electron transfer to a unified single-step process, with pH acting as a key determinant. Additionally, the emergence of minor peaks under altered pH conditions implies varied electrochemical pathways influenced by pH shifts.
The distinctive electrochemical responses of LV across varying pH levels exhibit a fascinating correlation with its pKa values, delineating the pivotal role of protonation equilibria in driving these observations.36 At pH levels below the pKa of 3.1, the presence of discernible dual anodic peaks aligns with LV's predominantly protonated state, signifying a multi-step electron transfer process. Transitioning between pKa values, particularly around 4.8, contributes to the emergence of a tertiary peak and a subsequent shift towards a unified singular peak as LV's protonation states reach equilibrium. Above pKa 4.8, the convergence of peaks corresponds to LV's prevalent deprotonated form, indicating a transition to a single-step electron transfer process.36 The SWV findings further reinforce these trends, highlighting how LV's electrochemical behavior mirrors its protonation states at different pH ranges. This comprehensive understanding underscores the profound influence of protonation equilibria dictated by LV's pKa values on its redox processes across varied pH environments.
However, for analytical purposes, the current maxima for the oxidation at ∼0.6 V is at a pH of 5, showing ∼20% reduction at pH 7.
3.3 Analytical parameters
To maximise sensor performance for both qualitative and semi-quantitative analysis, the analytical parameters for this SWV based sensor were evaluated. As shown, while pH 5 provided the greatest signal, the majority of biological sample matrices have a pH at ∼7, some like urine and sweat can vary. Therefore, to determine the response of the sensor within biological matrices, the response at pH 7 was evaluated within this study.The similarity in signal responses at pH 5 and pH 7 during the calibration curve (see Fig. 5 and 6), despite initial differences noted in the pH test, may be attributed to the varying concentration of leucovorin calcium (LV) used in the two experiments. In the pH test, a relatively high concentration of 0.1 mM LV in 0.1 M NaCl was employed, which could have resulted in pronounced pH-dependent effects on the electrochemical response. However, during the calibration curve, LV concentrations were systematically varied over a much lower range. At these lower concentrations, the electrochemical signal may no longer be significantly influenced by pH variations but rather be dominated by the concentration of LV itself. Therefore, the similarity in signal responses at both pH 5 and pH 7 during the calibration curve suggests that the electrochemical behavior of LV becomes less sensitive to pH changes at lower concentrations, highlighting the importance of considering the concentration range of the analyte when interpreting electrochemical measurements.
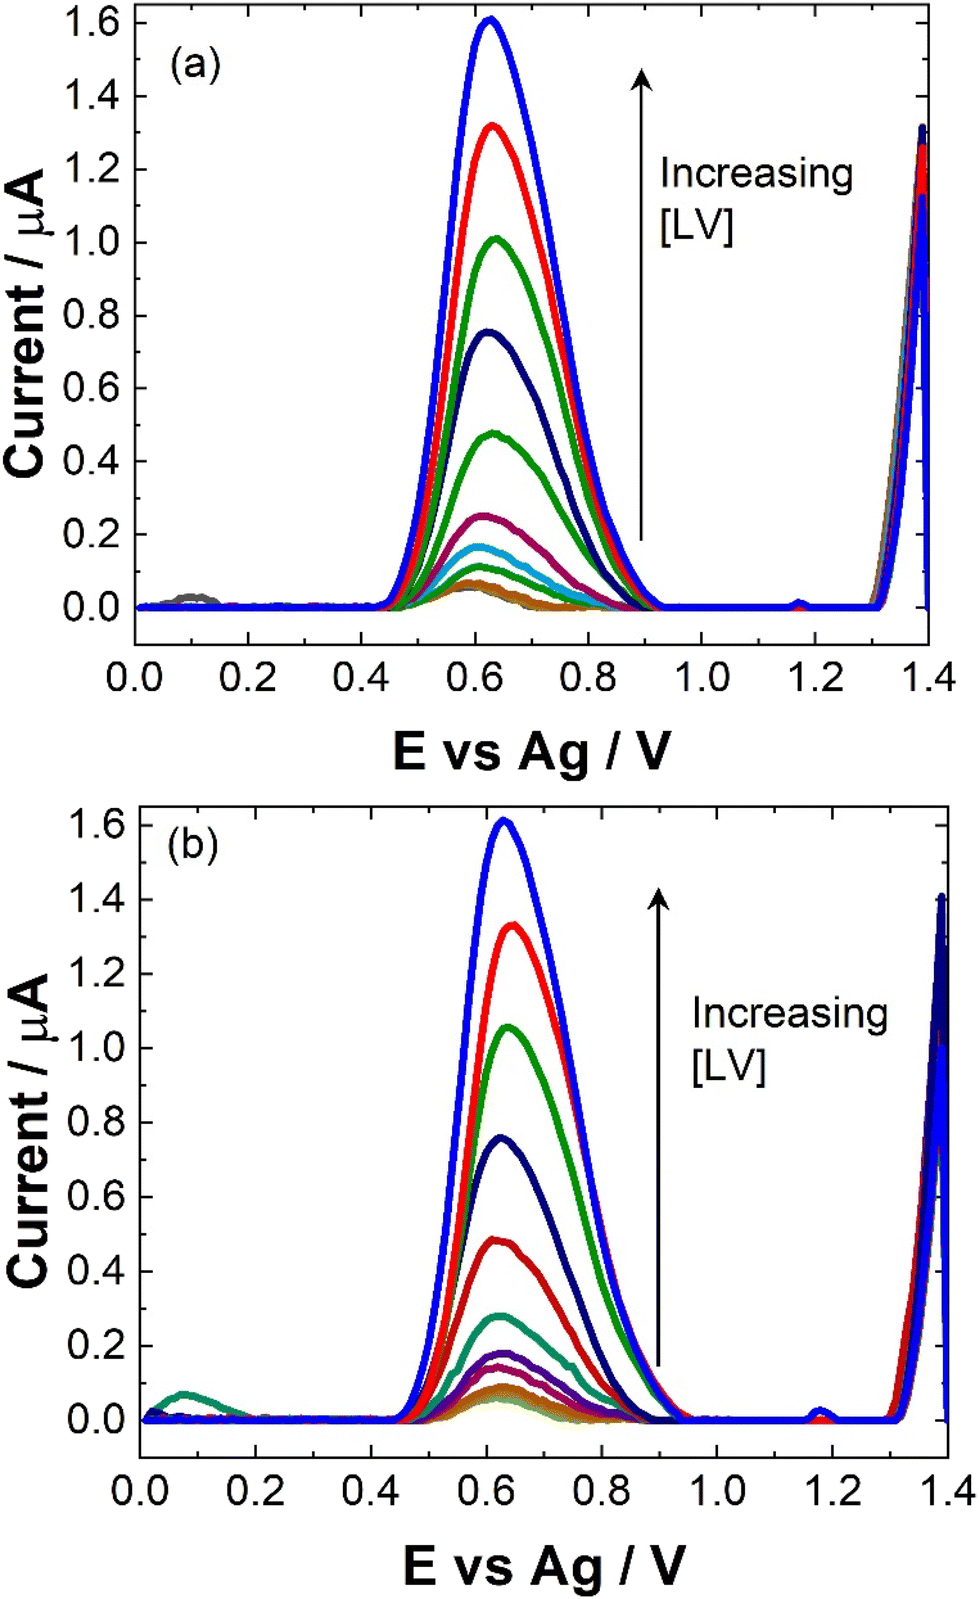 | ||
| Fig. 5 Typical SWV for increasing [LV] in 0.1 M NaCl at (a) pH 7 and (b) pH 5 over the concentration range 0 ≤ [LV] ≤ 30 μM scanned over the potential range 0 ≤ E ≤ 1.4 V vs. Ag at a pulse amplitude of 100 mV and frequency of 40 Hz. | ||
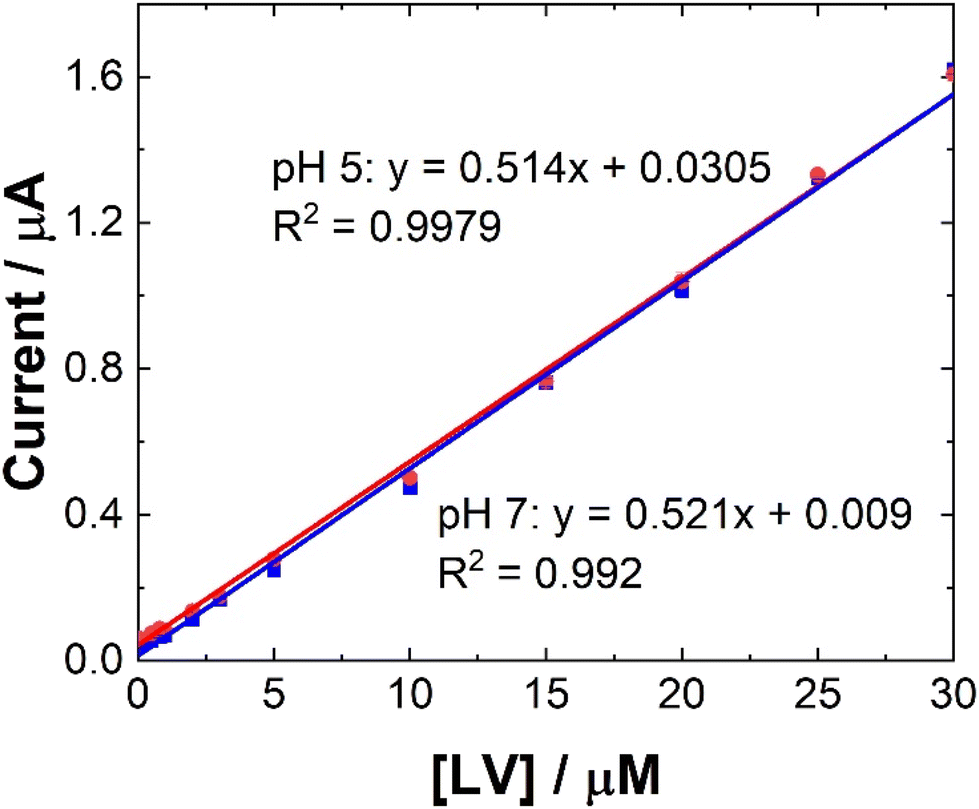 | ||
| Fig. 6 Typical trend of maximum ip at 0.6 V at (blue squares) pH 7 and (red circles) pH 5 for data presented in Fig. 5. Error bars represent the standard deviation obtained from triplicate results. | ||
Linear coefficients (R2) of 0.9979 and 0.992 were obtained for pH 5 and 7 as shown in Table 1 and Fig. 5 and 6. The limit of detection at each pH was calculated using the formula [average SWV of blank + 3.3SD (blank)] and estimated to be 1.48 μM in pH 7 and 163 μM in pH 5. As anticipated, LoD for the biological samples are slightly higher (not recorded for artificial saliva), as shown in Table 1, due to some interference effects. However, there are still within the therapeutically relevant range.
The intra- and inter-day repeatability evaluations also yielded low relative standard deviations (RSD) with an averaged value of 4.26% over the concentration range investigated (see Fig. S3 to S6 and Table S1†).
3.4 Biological analysis
To evaluate the capacity of this method for the monitoring of LV, a range of biological matrices were examined. These included artificial saliva, artificial urine and human pooled serum. These matrices were chosen to demonstrate the feasibility of our sensor for monitoring of drug therapies in a range of biological samples available to clinicians.2 These will have numerous interferences that might impact on the sensitivity of any sensor. We report here for the first time, a method for detecting LV in biological matrices. There is limited information of the detection of LV via electrochemical approaches, therefore, the results of this project were compared to both the electrochemical methods and more standardized chromatographic methods.The evaluation of biological matrices represents a pivotal step in assessing the performance and applicability of the developed sensor in real-world scenarios. By incorporating known concentrations of LV into various biological matrices, including human pooled serum, artificial urine, and saliva, we aim to mimic clinical conditions and evaluate the sensor's sensitivity, accuracy, and specificity in detecting therapeutic LV concentrations within these complex matrices. This approach enables us to validate the sensor's feasibility for use in biological matrices, thereby demonstrating its potential utility for point-of-care monitoring of drug therapies. The results obtained from the spiked samples provide valuable insights into the sensor's performance under physiological conditions, highlighting its robustness and suitability for practical applications in personalised medicine. Moreover, the absence of prior sample preparation requirements underscores the sensor's user-friendly nature and its potential to streamline drug monitoring processes, ultimately benefiting both patients and healthcare providers.
Typical dosages for LV therapies span 50 mg m−2 to a maximum of 500 mg m−2. From these the resulting plasma concentrations of LV are usually observed at ∼24 μM, with a steady-state plasma concentration stabilising at 3.2 μM.38,39
No sample preparation was undertaken on the serum samples, which were used as a precursor to future blood sample analysis and were analysed neat. Neat serum samples were spiked with a range of 10 μM LV concentrations and results were recorded directly on the bare SPCEs. Fig. 7 shows a comparison of the SWV data observed for these spiked sample and the neat serum sample. The addition of LV saw an increase in signal but with very large errors and inconsistencies over different scans and no results were obtained for lower or higher concentrations of LV. This maybe due to issues with electron transfer kinetics in serum. As with previous work, a dilution step was investigated to determine if more accurate results2,30,34 could be obtained, however, while a response was observed there was a reduction in current was observed (see Fig. S7†). There was also no observable linear trend unlike previous work. This was not unexpected given the complexity of the serum sample and the previously observed issues surrounding viscosity and lack of electrolyte mass transport within the serum which would hinder diffusion and migration contributing to the poor mass transport of the sample.2,34 While a signal is observed, further work to improve the sensitivity and the selectivity of this approach would be needed to increase its application to this field of drug therapy monitoring. The potential that LV is interacting in someway with other molecules within the serum to reduce the observed signal would also need to be investigated thoroughly before any type of definite identification could be made. Upon spiking with LV, a secondary peak at ∼0.9 V was also observed. This may in part be due to poor diffusion with some of the LV oxidising at a higher potential or it maybe due to some sort of interaction between an amino acid present in the serum with the LV. This additional peak was also seen in some of the pH studies (Fig. S2†) suggesting that it appear is due to very small shifts in pH within these sample matrices. Future investigations would be required to determine the exact nature of this peak which was observed intermittently within the analysis. Without a clear understanding of the origin of this peak, the feasibility of this approach for serum analysis is limited.
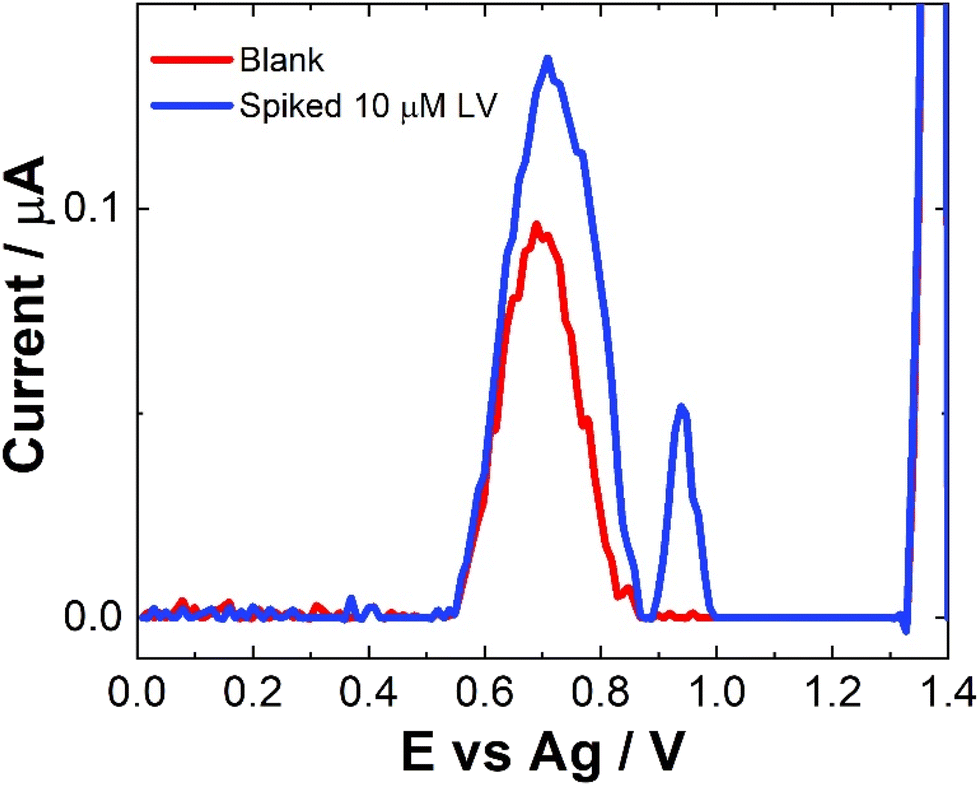 | ||
| Fig. 7 Typical SWV for neat human pooled serum (red line), and neat human pooled serum spiked with 10 μM LV (blue line) scanned over the potential range 0 ≤ E ≤ 1.4 V vs. Ag at a pulse amplitude of 100 mV and frequency of 40 Hz. | ||
Given the poor results, recovery rates for these samples were based upon the model calibration at pH 7. This would also add additional error to the values obtained.
As can be seen from Fig. 8, following spiking of the artificial urine with LV, a clear response is observed at 0.6 V. The % recovery ratio for each sample is shown in Table 2. Unlike the recovery rates calculated for human pooled serum, these were based upon calibration within artificial urine (Fig. 8). Based on these results, it is clear that this is a viable approach for point-of-care monitoring of LV, with an averaged recovery rate of 97.5% across the four different concentrations of LV which were used to spike the artificial urine.
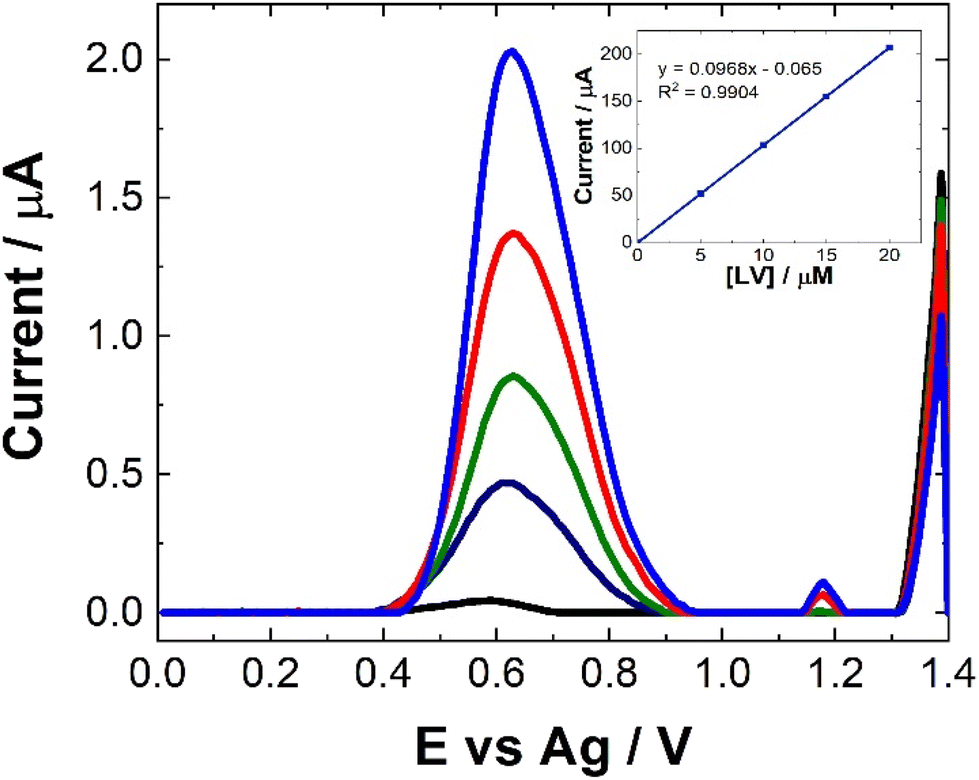 | ||
| Fig. 8 Typical SWV to increasing [LV] (0 ≤ [LV] ≤ 20 μM) in artificial urine at pH 7 over the concentration range 0 ≤ [LV] ≤ 30 μM scammed over the potential range 0 ≤ E ≤ 1.4 V vs. Ag at a pulse amplitude of 100 mV and frequency of 40 Hz. Inset shows the typical trend of maximum current at 0.6 V against [LV]. | ||
| [LV] μM | Human serum % recoverya | Artificial urine % recovery | Artificial saliva % recovery |
|---|---|---|---|
| All values based on averaged results from triplicate independent measurements.a For 1:1 dilution.b For 1:5 dilution. |
|||
| 5 | 48.46 ± 18.72 | 99.88 ± 1.70 | ND |
| 10 | 33.42 ± 4.05 | 88.91 ± 1.02 | 8.20 ± 5.18a, 14.91 ± 4.77b |
| 15 | ND | 96.75 ± 2.54 | ND |
| 20 | ND | 104.42 1.18 | ND |
To demonstrate the practicality of our electrochemical method we used artificial saliva as an exemplar biological matrix. Saliva, while not a common matrix for LV or drug therapy monitoring, is a practical alternative to blood samples as it is less invasive. There are clear advantages for portable or point-of-care analysis including that saliva samples are much easier to obtain in comparison to blood samples and do not require as much sample preparation as is often needed for blood or serum samples. In our initial analysis, the direct detection of LV within artificial saliva was investigated.
Compatibility of the proposed sensor for direct saliva analysis was explored through the use of artificial salvia which contains a number of active enzymes naturally present within human saliva which could pose potential problems for our SWV sensor. Neat saliva did not produce much a SWV response as shown in Fig. 9. This is in contrast to human pooled serum (see Fig. 7). This suggests that the enzymes present in saliva do not cause issues for our SWV or that the natural viscosity of salvia allows for such poor electron transfer kinetics within the matrix that no electrochemical response is observable. When the artificial saliva was spiked with concentrations of LV, there was little discernible difference in the observed response, although there does seem to be a minor decrease in response. Again, this could be attributed to the poorer electron transfer kinetics and/or a potential interaction of the LV with the components of the saliva.30,34 Another possibility is the non-uniform distribution or aggregation of the LV within the artificial saliva. In order to address the issues observed for the SWV response obtained directly from saliva, the matrix was diluted with 0.1 M NaCl. Unexpectedly, this also showed a decrease in the response upon addition of LV. While the poorer electron kinetics within the matrix are an issue, this does not explain the further decrease in response following dilution. Given this, within the current approach this means that saliva does not meet the prerequisites for use as a matrix for [LV] detection or monitoring, giving % recoveries below 15%. Similarly, to the inconsistent nature of the results obtained to human pooled serum and that of artificial saliva, the recovery rates were based upon the model calibration data. The reduction in response could potentially be utilised as a sensing approach but this is outside the scope of this contribution and would require further interrogation.
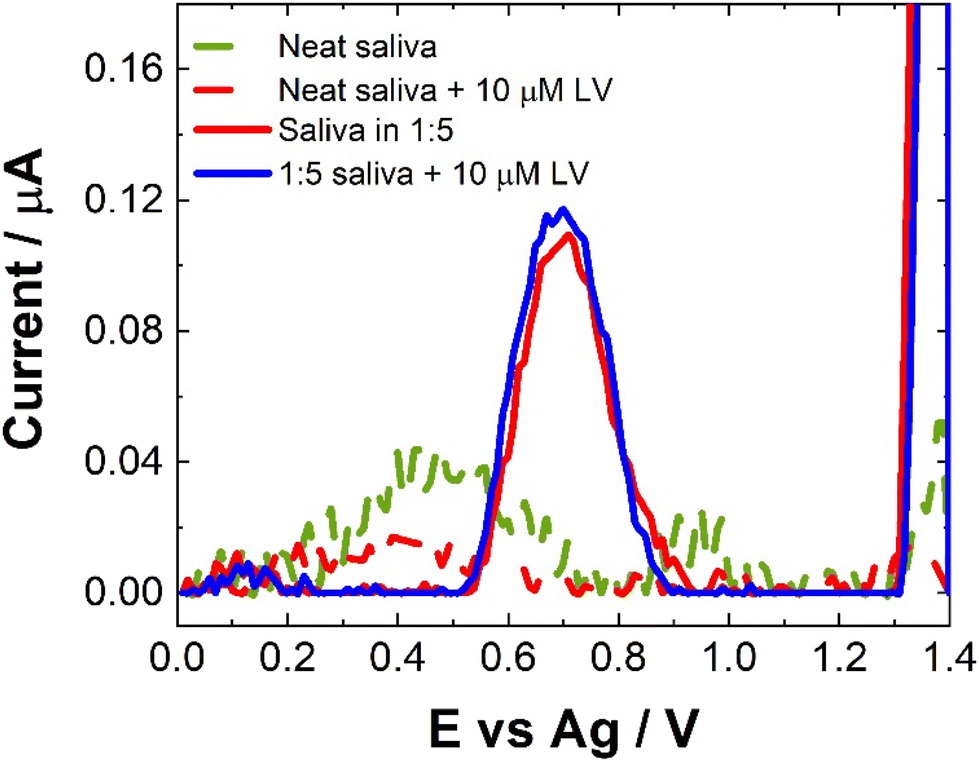 | ||
| Fig. 9 Typical SWV for neat saliva (green dashed), neat saliva spiked with 10 μM LV (red dashed); a 1:1 dilution of saliva (red line) and 1:5 dilution saliva spiked with 10 μM LV (blue line) scanned over the potential range 0 ≤ E ≤ 1.4 V vs. Ag at a pulse amplitude of 100 mV and frequency of 40 Hz. Inset shows the typical trend of maximum current at 0.6 V against [LV]. | ||
4. Conclusions
This contribution demonstrates the use of SWV for the detection of LV in complex biological matrices. This represents a low-cost alternative to current instrumental approaches of analysis with a viable approach to point-of-care detection and monitoring of a therapeutic drug addressing the current need for advancements to achieve the lofty aims of personalised precision medicine. Despite the complex nature of urine, no significant interference effects were observed allowing for quantitative analysis to be achieved at therapeutically relevant concentrations. The notable exception being artificial saliva which clearly did not reach the requirements needed to be utilised as a matrix for point-of-care monitoring of LV. Although, given the quenched effects observed, this could offer an alternative approach to monitoring within this matrix. This will be examined in future investigations. The recovery within serum was also inconsistent which does not make it a viable approach for a clinical setting. We have demonstrated that LV can be detected in both neat artificial urine and have achieved this without the requirement for complex, costly and time-consuming sample extractions procedures. This represents a strong proof-of-concept for the use of SWV for the monitoring of LV. However, further analysis is needed to support successful translation of this approach into the clinical arena. This would require analysis of clinical samples and the impact of commonly consumed substances including other medicines would also need to be investigated. While LV was detectable in human pooled serum, additional work to improve both the linear dynamic range and sensitivities would be needed to enable transition into a clinical setting and indeed, towards detection within blood without the need for sample preparation. Nevertheless, the approach described within this contribution demonstrates an extremely promising avenue towards the development of portable electrochemical sensors which could be used as point-of-care sensors making a significant step towards the ultimate goal of personalised precision medicine.Author contributions
LD was responsible for the conceptualisation and supervision of this work. LD and PHS undertook the methodological approach, investigation, writing review and editing and PHS undertook the laboratory work and experimental data collection.Conflicts of interest
There are no conflicts to declare.Acknowledgements
The authors would like to thank the University of Strathclyde STEM Equals scheme for financially supporting this research (grant EP/S012133/1). All date underpinning this publication are openly available from the University of Strathclyde Knowledge Base at https://doi.org/10.15129/88d980d8-25b0-406a-90dc-1f4593125d2b.References
- S. M. O'Connor, L. Dennany and E. J. O'Reilly, Biosens. Bioelectron., 2023, 149, 108286 Search PubMed
.
- K. Brown and L. Dennany, Sens. Actuators Rep., 2021, 3, 1000065 Search PubMed
- I. R. König, O. Fuchs, G. Hansen, E. von Mutius and M. V. Kopp, Eur. Respir. J., 2017, 50, 1700391 CrossRef
- E. Bloom, Impact of New Personalised Cancer Treatments, Impact of New Personalised Cancer Treatments, 2018.
- G. R. Gameiro, V. Sinkunas, G. R. Liguori and J. O. C. Auler-Júnior, Clinics, 2018, 73, e723–e723 CrossRef PubMed
- G. S. Ginsburg and K. A. Phillips, Precision Medicine: From Science To Value, Health Aff., 2018, 37, 694–701 CrossRef
- M. Brycht, L. Poltorak, S. Baluchová, K. Sipa, P. Borgul, L. Rudnicki and S. Skrzypek, Crit. Rev. Anal. Chem., 2022, 1–92 CrossRef PubMed
- M. Ghalkhani, S. I. Kaya, N. K. Bakirhan, Y. Ozkan and S. A. Ozkan, Crit. Rev. Anal. Chem., 2022, 52(3), 1–92 CrossRef PubMed
- Z. Li, J. Zou and X. Chen, Adv. Mater., 2023, 35(21), 2209529 CrossRef CAS PubMed
-
Y. D. Gristan and L. Moosavi, in StatPearls, StatPearls Publishing Copyright © 2023, StatPearls Publishing LLC., Treasure Island (FL), 2023 Search PubMed
-
V. S. Hegde and S. Nagalli, in StatPearls, StatPearls Publishing Copyright © 2023, StatPearls Publishing LLC., Treasure Island (FL), 2023 Search PubMed
-
A. S. LaCasce, UpToDate Waltham, 2014 Search PubMed
- J. B. Shiroky, C. Neville, J. M. Esdaile, D. Choquette, M. Zummer, M. Hazeltine, V. Bykerk, M. Kanji, A. St-Pierre and L. Robidoux and,
et al.
, Arthritis Rheum., 1993, 36, 795–803 CrossRef CAS PubMed
- M. Levitt, M. B. Mosher, R. C. DeConti, L. R. Farber, R. T. Skeel, J. C. Marsh, M. S. Mitchell, R. J. Papac, E. D. Thomas and J. R. Bertino, Cancer Res., 1973, 33, 1729–1734 CAS
- C. D. Flombaum and P. A. Meyers, J. Clin. Oncol., 1999, 17, 1589–1589 CrossRef CAS
- T. Cercós-Fortea, V. G. Casabó, A. Nácher, E. Cejudo-Ferragud, A. Polache and M. Merino, Int. J. Pharmacol., 1997, 155, 109–119 CrossRef
- Y. Finkelstein, S. Zevin, J. Heyd, Y. Bentur, Y. Zigelman and M. Hersch, NeuroTox, 2004, 25, 407–410 CrossRef PubMed
- H. T. Arkenau, A. Bermann, K. Rettig, G. Strohmeyer and R. Porschen, Ann. Oncol., 2003, 14, 395–399 CrossRef CAS PubMed
- D. Machover, Cancer, 1997, 80, 1179–1187 CrossRef CAS
- H. Mishima, M. Ikenaga, T. Tsujinaka, M. Yasui, M. Kashiwazaki, M. Miyazaki, M. Hirao, K. Fujitani and S. Nakamori, Gan to Kagaku Ryoho, 2006, 33, 911–914 CAS
- D. G. Barceloux, G. R. Bond, E. P. Krenzelok, H. Cooper and J. A. Vale, J. Toxicol., Clin. Toxicol., 2002, 40, 415–446 CrossRef CAS
- S. E. Al-Batran, J. T. Hartmann, S. Probst, H. Schmalenberg, S. Hollerbach, R. Hofheinz, V. Rethwisch, G. Seipelt, N. Homann, G. Wilhelm, G. Schuch, J. Stoehlmacher, H. G. Derigs, S. Hegewisch-Becker, J. Grossmann, C. Pauligk, A. Atmaca, C. Bokemeyer, A. Knuth and E. Jäger, J. Clin. Oncol., 2008, 26, 1435–1442 CrossRef CAS PubMed
- T. Conroy, F. Desseigne, M. Ychou, O. Bouché, R. Guimbaud, Y. Bécouarn, A. Adenis, J. L. Raoul, S. Gourgou-Bourgade, C. de la Fouchardière, J. Bennouna, J. B. Bachet, F. Khemissa-Akouz, D. Péré-Vergé, C. Delbaldo, E. Assenat, B. Chauffert, P. Michel, C. Montoto-Grillot and M. Ducreux, N. Engl. J. Med., 2011, 364, 1817–1825 CrossRef CAS PubMed
- I. Durán Merás, A. Espinosa Mansilla, F. Salinas López and M. Rodríguez Gómez, Anal. Bioanal. Chem., 2002, 373, 251–258 CrossRef PubMed
- N. K. Dubey, Biomed. Chromatogr., 2022, 36, e5299 CrossRef CAS PubMed
- K. Liu, X. Dai, D. Zhong, P. Deng, J. Ma and X. Chen, J. Chromatogr. B: Anal. Technol. Biomed. Life Sci., 2009, 877, 902–910 CrossRef CAS
- I. Duran Merás, A. Espinosa Mansilla, F. Salinas López and M. Rodríguez Gómez, J. Pharm. Biomed. Anal., 2002, 27, 81–92 CrossRef PubMed
- C. McLean, K. Brown, J. Windmill and L. Dennany, J. Electroanal. Chem., 2022, 921, 116649 CrossRef CAS
- C. McLean, B. Tiller, R. Mansour, K. Brown, J. Windmill and L. Dennany, J. Electroanal. Chem., 2022, 909, 116149 CrossRef CAS
- A. Ameen, K. Brown and L. Dennany, J. Electroanal. Chem., 2022, 909, 116141 CrossRef CAS
- R. Šelešovská, L. Bandžuchová, T. Navrátil and J. Chýlková, Electrochim. Acta, 2012, 60, 375–383 CrossRef
- R. Šelešovská, B. Kränková, M. Štěpánková, P. Martinková, L. Janíková, J. Chýlková and M. Vojs, J. Electroanal. Chem., 2018, 821, 2–9 CrossRef
- R. Šelešovská, B. Kränková, M. Štěpánková, P. Martinková, L. Janíková, J. Chýlková and T. Navrátil, Monatsh. Chemie, 2018, 149, 1701–1708 CrossRef
- E. Dokuzparmak, K. Brown and L. Dennany, Analyst, 2021, 146, 3336–3345 RSC
- K. Brown, C. Jacquet, J. Biscay, P. Allan and L. Dennany, Analyst, 2020, 145, 4295–4304 RSC
-
L. O. Pont, A. P. K. Cheung and P. Lim, in Analytical Profiles of Drug Substances, ed. K. Florey, Academic Press, 1979, vol. 8, pp. 315–350 Search PubMed
- N. K. Dubey, Biomed. Chromatogr., 2022, 36(4), e5299 CrossRef CAS PubMed
- F. Trave, Y. Rustum, N. Petrelli, L. Herrera, A. Mittelman, C. Frank and P. Creaven, J. Clin. Oncol., 1988, 6, 1184–1191 CrossRef CAS PubMed
- R. L. Schilsky, K. E. Choi, E. E. Vokes, A. Guaspari, C. Guarnieri, S. Whaling and M. Ann Liebner, Cancer, 1989, 63, 1018–1021 CrossRef CAS
-
V. S. Hegde and S. L. Nagalli, [Updated 2023 Jul 3], in StatPearls [Internet], StatPearls Publishing, Treasure Island (FL), 2024. Available from: https://www.ncbi.nlm.nih.gov/books/NBK553114/ Search PubMed
Footnote |
| † Electronic supplementary information (ESI) available. See DOI: https://doi.org/10.1039/d4an00227j |
| This journal is © The Royal Society of Chemistry 2024 |