 Open Access Article
Anti-counterfeiting holographic liquid crystal gels with color and pattern control†
Kyung Min
Lee
 *ab,
Victor Yu.
Reshetnyak
 cd,
Cedric P.
Ambulo
ab,
Zachary M.
Marsh
ab,
Michael E.
McConney
 a and
Nicholas P.
Godman
*a
aAir Force Research Laboratory, Materials and Manufacturing Directorate, Wright-Patterson AFB, OH 45433, USA
bAzimuth Corporation, 2970 Presidential Dr #200, Fairborn, OH 45324, USA
cPhysics Faculty, Taras Shevchenko National University of Kyiv, 64 Volodymyrs'ka Street, Kyiv 01601, Ukraine
dSchool of Physics and Astronomy, University of Leeds, Leeds LS2 9JT, UK
First published on 16th March 2023
Abstract
Reflective gratings based on holographically patterned liquid crystals exhibit electrically switchable color due to changes in the periodic refractive index of the material. Previous work has shown switching behavior between reflective and transparent states or between transparent and scattering states. Here, we report for the first time a novel anti-counterfeiting material for optical security and encryption using holographic polymer stabilized liquid crystal gels (H-PSLC gels) with a relatively small polymer concentration (5–20 wt%). The discrete reflection color of H-PSLC is induced by applying an alternating current (AC) electric field, and the position of the AC field induced reflection notch can be tuned by the subsequent application of a direct current (DC) field. The holographic notch of the H-PSLC exhibits a large reversible red-shift (Δλ ≈ 200 nm) with high reflection efficiency (60–80%). The dynamic red-shift of the holographic reflection corresponds to gradients in the holographic pitch caused by the deformation of the polymer network under a DC field. Simultaneous photopatterning and holographic photopolymerization produce an initially transparent LC gel that can electrically induce a variety of reflective colors, images, and diffraction patterns. The electrically controllable color, image and pattern of H-PSLC gels can be used in anti-counterfeiting materials for optical security and encryption.
Introduction
Liquid crystal (LC) holographic gratings are used in a variety of optical applications including security, cryptography, data storage, optical filters, and displays.1–3 The holographic grating is photopatterned into a mixture of LC, monomer, and initiator by the interference of two coherent laser beams that form a spatially modulated change in the refractive index in the mixture of monomer and liquid crystal. Two types of holographically patterned liquid crystal grating have been reported in the literature: transmission and reflection gratings. In a transmission grating, two coherent laser beams are transmitted through the sample over the same sample area. For a reflection grating, two beams are exposed to the opposite sample planes, creating a layer structure parallel to the sample surface. The layered liquid crystal gratings have been reported as POLICRYPS (Polymer Liquid Crystal Polymer Slices)4–7 or holographic polymer dispersed liquid crystals (H-PDLCs)8–30 with a polymer concentration of 40–85 wt%.The application of an electric field to a holographically patterned LC grating induces a switching response, but the initial state (scattering or transparent) depends on the sample preparation conditions. Under the so-called “normal mode” operating conditions, application of an alternating current (AC) electric field induces a switching from the initial scattering state to the homeotropic transparent state.31–33 In this case, the diffraction efficiency decreases with increasing field strength. In the other mode of operation, reverse mode, the initial transparent state becomes the scattering state and diffraction efficiency increases as the AC field increases.31,34,35
The reflection grating has a layer of grating parallel to the substrate, which is written by the exposure of two linearly polarized light on both sides of the LC mixture. Exposure of two linearly polarized beams creates alternating constructive (dark) and destructive (bright) beam profiles through the thickness of the cell. In bright areas, monomers polymerize faster than in dark areas, creating polymer-rich area. Non-uniform irradiation leads to alternating polymer-rich and polymer-poor layers with periodicity related to the illumination wavelength. The holographic pitch exhibiting various reflection colors can be controlled by the incident angle of the recording beam to the LC mixture. The polymer stabilized liquid crystal reflection gratings have been prepared using an argon-ion UV laser with a wavelength of 363.8 nm7–10 or a visible laser with a wavelength range of 440–532 nm11–17 exposed to a sample in optical contact with the prism using index-matching fluid (Fig. 1a). Conventional H-PDLC reflection gratings with a polymer concentration of 40–85% show electrical switching between opaque and transparent states.11–20 Two different H-PSLCs with a total polymer concentration of 17% (14% liquid crystal monomer and 3% triacrylate monomer)36–38 capable of switching between transparent and reflective states has been previously reported by Kato37 and Bunning.38 Kato and colleagues described an H-PSLC system where the application of an AC electric field reorients the positive Δε LC in the polymer-poor (LC-rich) layer along the direction of the electric field, but not the LCs in the polymer-rich layer due to the high anchoring strength of the stabilizing polymer. This results in a refractive index mismatch between the non-reoriented polymer-rich layer and the reoriented polymer-poor layer, and the repeating layered structure creates a selective reflection with up to 40% reflection efficiency. Bunning and colleagues reported a photo-triggered reversible switching response of azobenzene containing H-PSLC samples.38 Exposure of UV light induces trans-to-cis isomerization of azobenzene molecules and leads to a refractive index mismatch between the layers. The holographic notch induced by UV light relaxes back to its initial transparent state upon exposure to 532 nm wavelength light or in dark conditions.
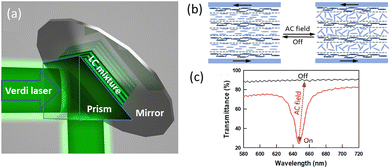 | ||
| Fig. 1 (a) Schematic illustration of a holographic reflection grating using a single beam right-angle prism. (b) Schematic illustration and (c) switching response in H-PSLC by applying an AC field (150 V at 1 kHz). The reflective grating sample was prepared from a mixture containing 20 wt% C3M and E7 in a 15 μm thick homogeneous cell.39 | ||
Our recent study reported on the thermally reversible transparent to reflective switching response of H-PSLC reflection gratings with a polymer concentration of 6–20 wt% (Fig. 1b and c).39 The initial notch position was controlled by the incidence angle of the recording beam relative to the sample and was induced by heating or AC field application. Reflection efficiency (5–60%) of the gratings were dependent on the polymer concentration and recording beam intensity.
Previous H-PDLC and H-PSLC reflection gratings primarily display the switching response between scattering and transparent states, but further control of the holographic notch has not yet been reported. Here, we present additional controls over the optical response of H-PSLC gels. Application of an AC field induces a reflection notch of the H-PSLC sample in its initial transparent state, and the holographic notch can be shifted to a longer wavelength by increasing the DC electric field. This means that the holographic reflection color of H-PSLC gel can be controlled by the applied DC field strength. In addition to color control, simultaneous photopatterning and holographic photopolymerization using a photomask produce holographic LC gels that can electrically induce a variety of reflective colors, images, and diffraction patterns by proper adjustment of the AC and DC fields. Proper use of AC and DC fields reveals hidden colors, images, and patterns of H-PSLC gels.
Experimental section
Preparation of planar cells
Alignment cells were prepared from ITO-coated glass slides (Colorado Concepts). The glass substrates were cleansed in acetone and methanol, and treated with air plasma. The cleansed substrates were spin-coated with a polyimide solution (PI2551, HD Microsystems) and baked at 200 °C for 1 h. The alignment layers were rubbed with a cloth, and the cell was constructed to ensure a planar alignment condition. The cell gap was controlled by mixing 20 μm thick glass rod spacers into an optical adhesive (Norland Optical Adhesive, NOA65).Preparation of holographically patterned polymer stabilized LC (H-PSLC) reflection gratings
Samples were prepared by mixing 0.5–1 wt% photoinitiator Rose Bengal (RB, Sigma-Aldrich), 1–2.5 wt% co-initiator N-phenyl glycine (NPG, Sigma-Aldrich), 5–20 wt% liquid crystal monomer (C3M, C6M, or C11M, Synthon Chemicals), and positive Δε nematic liquid crystal E7 (TNI ∼ 58 °C, Δε ∼ 13.8, Δn ∼ 0.2253 at λ = 589 nm, Merck) or 5CB (TNI ∼ 35.3 °C, Δε ∼ 10, Δn ∼ 0.178 at λ = 589 nm, TCI America). The glass cell was filled with the LC mixture and attached to the right-angle prism with index matching liquid. A single beam prism-coupled method was used for writing reflection gratings using a 532 nm wavelength continuous wave (CW) Verdi laser (Coherent) with various laser powers ranged from 60 to 500 mW cm−2 for the exposure time of 5 min.15,16,37 The notch positions of the reflection gratings were controlled by changing the incident beam angle of the Verdi laser. Various photomasks were placed on the prism to pattern the samples during the reflection grating. All materials were used as received without any purification.Experimental setup and measurements
Optical characterization was carried out using an ocean optics spectrophotometer and a Cary UV-vis-IR spectrometer. For electrical switching, a square wave signal at 1 kHz operating from 0 to 200 V RMS was applied, and changes in reflection efficiency were monitored. For electrical red tuning of the reflection notch, direct current (DC) electric voltage was applied. The signal generator was used to independently program the AC field with DC offset.Results and discussion
The switching response of H-PSLC samples can be affected by the dielectric coefficient (Δε), viscosity and chemical structure of the positive Δε LC, the type and structure of the polymer network, and ion density of the mixture. Reflection grating samples were prepared using a LC mixture exposed to a Verdi laser by a single prism method and show a reversible switching response by applying an AC electric field (Fig. 1).15,16,37 The LC reflection grating samples were prepared from a mixture containing 0.5–1 wt% photoinitiator Rose Bengal (RB, Sigma-Aldrich), 1–2 wt% co-initiator N-phenyl glycine (NPG, Sigma-Aldrich), 5–20 wt% liquid crystal monomer C3M (Synthon Chemicals), and LC E7 (Merck) or 4′-n-pentyl-4-cyanobiphenyl (5CB, Sigma-Aldrich). The chemical structures of these materials are shown in Fig. S1 (ESI†). Researchers have previously reported the switching response of H-PSLCs between transparent and reflective states,36–39 but further control of the holographic reflection notch has not yet been investigated. The monomer C3M contains three methylene units in the flexible spacer and was chosen as a starting point of investigation due to its prevalence in LC research. The H-PSLC reflection grating sample is initially transparent because the polymer-rich and polymer-poor layers have similar refractive indices (Fig. 2-i). Increasing the AC electric field reorients the positive Δε liquid crystals in the polymer-poor (or LC-rich) layers along the direction of the electric field. The LCs in the polymer-rich layers remain unchanged due to strong polymer stabilization. At low AC voltages (100 V at 1 kHz), a small reflection notch appears at ∼580 nm (Fig. 2-ii). When the AC voltage is increased to 150 V, the green reflection color is fully developed at ∼565 nm (Fig. 2-iii). The appearance of a green reflection color is due to the refractive index mismatch between these layers. The reversible switching from transparent (Fig. 2-i) to green reflection (Fig. 2-iii) is shown in Videos S1 and S2 (ESI†). The reflection is set at a specific wavelength during the holographic patterning and the reflection color is controlled by the angle of incidence of the green laser. However, there are no reports of electrically tuning the reflection band (i.e., reflection color) of H-PSLC samples.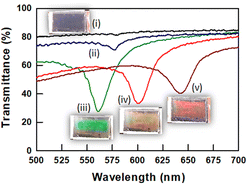 | ||
| Fig. 2 Transmission spectra and photographs of reconfigurable holographic reflection notch of H-PSLC: (i) an optically transparent state prior to application of an electric field, reversible switching from transparent initial state to reflective state by application of (ii) 100 V and (iii) 150 V at 1 kHz AC voltages, red tuning with increasing DC voltage from 0 V to (iv) 50 V DC and (v) 100 V DC while the AC field is continuously applied (see Videos S1 and S2, ESI†) The signal generator was used to independently program the AC field with DC offset. The sample was prepared from the LC mixture containing 0.5 wt% RB, 1 wt% NPG, 15 wt% C3M and 83.5 wt% 5CB. | ||
The H-PSLC samples prepared herein are comprised of an LC mixture similar to that of polymer stabilized cholesteric liquid crystals (PSCLC), albeit without the addition of a chiral dopant. PSCLC samples display a selective reflection determined by the pitch spacing of LCs that are self-assembled within a helical, 1-D photonic crystal. The dynamic, electro-optical (EO) response of PSCLCs is well documented in the literature, and red tuning behavior is related to the deformation of the polymer network in the CLC medium.40–44 PSCLC networks deform under an applied DC field due contain small amount of cationic impurities trapped within the polymer matrix. A CLC with gradient pitch is formed across the cell as the polymer network migrates toward the negative electrode with increasing voltage.40,42,44,45 It is expected that a similar mechanism will apply to H-PSLCs fabricated from the same composition as PSCLCs.
Continuously applying an AC field (150 V at 1 kHz) to the H-PSLC sample described above forms the initial green reflection band. The addition of a DC field shifts the holographic notch from green (565 nm, 0 V DC) to yellow-orange (600 nm, 50 V DC) to red (650 nm, 100 V DC), as shown in Fig. 2-iv and v. Removal of the AC field at any given DC voltage reverts the sample back to a transparent state, and the sample remains transparent regardless of further alterations to the DC field. Reapplication of the AC voltage results in a new reflective state corresponding to the applied DC field strength. Proper adjustment of the AC and DC fields can directly induce green, yellow-orange, or red reflective colors from the transparent state of H-PSLC samples.
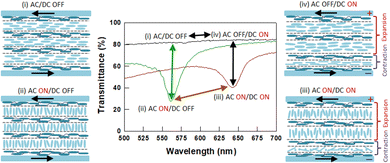
The potential mechanism and reconfigurable behavior of H-PSLC by the combination of AC and DC fields is summarized in Fig. 3. The initial H-PSLC sample is optically transparent due to similar refractive index between the polymer-rich and polymer-poor layers (Fig. 3-i). Application of an AC field induces rotation of the positive Δε LCs in the weakly stabilized polymer-poor layer, whereas the LCs in the strongly stabilized polymer-rich layer remain unchanged. The reorientation of the LC along the direction of the applied AC field causes a refractive index difference between the polymer-poor and polymer-rich layers, resulting in a holographic reflection band (Fig. 3-ii). Increasing the DC field while the AC field is still applied shifts the reflection band to a longer wavelength (red tuning), as shown in Fig. 3-iii. The position of the reflection band can be adjusted by the applied DC field strength. It is well known that liquid crystals contain a small amount of ionic impurities (initiators, catalysts, salts, moisture) that remain from synthesis and purification processes. During holographic photopolymerization, positive ions present in the LC mixture can become trapped in the polymer network. When the DC field is increased, the positive ions trapped in the polymer network migrate, causing the polymer network to deform.40,42,44 This ion-mediated electromechanical mechanism is described in Scheme S1 (ESI†). Increasing the DC voltage deforms the weakly stabilized polymer-poor layer towards the negative electrode side, while the rigid polymer-rich layer remains unchanged. The deformation of the polymer-poor layer induces pitch expansion and contraction near the positive and negative electrodes, respectively. The degree of deformation of the polymer network varies across the cell thickness, resulting in a non-linear pitch gradient. This pitch variation across the cell thickness causes the holographic pitch change and non-linear pitch gradient (Fig. 3-iii) that shifts the holographic notch to longer wavelengths. The DC field strength controls the degree of polymer deformation and the position of the holographic notch. The colored H-PSLC sample becomes transparent when the AC field and DC field are removed (Fig. 3-i) or the AC field is removed (Fig. 3-iv). Applying only a DC field without applying an AC field still deforms the softer polymer network in the polymer-poor region, but the LC in the polymer-poor regions returns back to its initial planar orientation, resulting in the same refractive indexes between the polymer-poor and polymer-rich layers. The combination of AC and DC fields can control and hide the reflection color of the H-PSLC sample, which has not been reported previously.
Modeling efforts were also performed to better understand the mechanism by which the red tuning of the holographic reflection occurs. The reflection of the H-PSLC grating is determined by the dielectric tensor of the LC at the incident wavelength, the refractive index of LC polymer, and the refractive index of the glass substrates confining the LC reflection grating. A polymer refractive index of 1.72 and refractive index of the glass substrate of 1.5 were used, which are close to the extraordinary refractive index of 5CB (∼1.71) and the ordinary refractive index of 5CB (∼1.53), respectively. The LC dielectric tensor is given by
| εLCij(r) = ε⊥δij + εaninj, |
![[thin space (1/6-em)]](https://www.rsc.org/images/entities/char_2009.gif) θ(z, U), 0, cos
θ(z, U), 0, cos![[thin space (1/6-em)]](https://www.rsc.org/images/entities/char_2009.gif) θ(z, U)), wherein U is the applied voltage. To determine the LC director spatial profile n(z, U) the coupled Euler–Lagrange equation is solved for the LC director angle θ(z, U) and the Poisson equation is solved for the electric potential Φ(z, U). Since the thickness of polymer poor areas is small compared to the incident light wavelength, the director angle of the polymer poor areas are averaged according to
θ(z, U)), wherein U is the applied voltage. To determine the LC director spatial profile n(z, U) the coupled Euler–Lagrange equation is solved for the LC director angle θ(z, U) and the Poisson equation is solved for the electric potential Φ(z, U). Since the thickness of polymer poor areas is small compared to the incident light wavelength, the director angle of the polymer poor areas are averaged according towhere dLC is the thickness of polymer poor (e.g. LC rich) layer. The averaged components of the LC dielectric tensor become:
εLCxx,av = ε⊥ + εa![[thin space (1/6-em)]](https://www.rsc.org/images/entities/char_2009.gif) sin2 sin2![[thin space (1/6-em)]](https://www.rsc.org/images/entities/char_2009.gif) θav, εLCzz,av = ε⊥ + εa θav, εLCzz,av = ε⊥ + εa![[thin space (1/6-em)]](https://www.rsc.org/images/entities/char_2009.gif) cos2 cos2![[thin space (1/6-em)]](https://www.rsc.org/images/entities/char_2009.gif) θav, εLCxz,av = εLCzx,av = εa θav, εLCxz,av = εLCzx,av = εa![[thin space (1/6-em)]](https://www.rsc.org/images/entities/char_2009.gif) sin sin![[thin space (1/6-em)]](https://www.rsc.org/images/entities/char_2009.gif) θav θav![[thin space (1/6-em)]](https://www.rsc.org/images/entities/char_2009.gif) cos cos![[thin space (1/6-em)]](https://www.rsc.org/images/entities/char_2009.gif) θav θav |
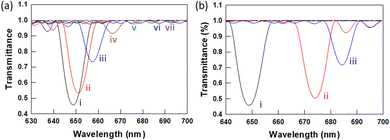
To get insight on how reorientation of the LC director in the polymer poor layers affects the H-PSLC reflectance and transmittance, the values of the averaged director angle is varied (av = 0°, 15°, 30°, 45°, 60°, 75°, 90°). The averaged director angle of 90° corresponds to the transparent state, and 0° corresponds to complete reorientation of the LCs (e.g. reflective state). Fig. 4 shows the modelled transmittance data for linearly polarized light incident onto a holographic grating comprised of 37 polymer poor layers and 38 polymer rich layers with a total thickness of 15 μm. When the sample is subject to both AC and DC electric field, we speculate that the response is twofold. The response of the samples are predicated on two major assumptions when the AC and DC voltages are applied: (1) the LC director direction changes which alters the effective refractive index of the polymer poor layers (Fig. 4a) and (2) the effective thickness of the polymer-poor regions of the grating is changing (Fig. 4b). Determining the average LC director angle, the effective refractive index, and the thickness of the polymer-poor layers under the applied DC is rather complicated due to the LC reorientation and the electric potential redistribution within the grating. To illustrate how the transmittance spectra can be modified upon changes in both the average LC director angle and the thickness of the polymer-poor area under simultaneously applied DC and AC voltages, we calculated the transmittance of H-PSLC grating for three combinations of parameters. Fig. 4b shows the transmittance of the H-PSLC grating when changing the thickness of the LC-rich region with increasing DC voltages, which is qualitatively consistent with the experimental data in Fig. 2. Based on this data, we conclude that the increase in the DC field deforms the polymer network in the polymer-poor layer, while the polymer network in the polymer-rich layer remains almost unchanged. As the DC field increases further, the polymer network in the polymer poor layer continues to deform, which further shifts the reflection notch to longer wavelengths.
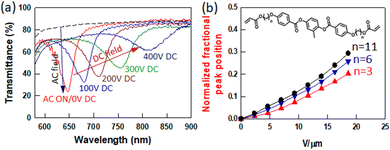
The flexible spacer length of LCMs is known to affect the viscoelastic deformation of the polymer network in PSCLCs.46 To study the effect of the flexible spacer length on the dynamic red tuning of the holographic notch and the viscoelastic deformation of the polymer network, two H-PSLC samples were fabricated with longer flexible spacer length: C6M (six methylene units) and C11M (eleven methylene unit). The chemical structures are shown in Fig. S1 (ESI†). The EO response of H-PSLC grating prepared using the more flexible monomer C6M is shown in Fig. 5a. As expected, the prepared grating sample is initially transparent due to the similar refractive indices between the polymer-rich and the polymer poor layers. The introduction of an AC field (150 V at 1 kHz) induces a red reflection (645 nm). As DC voltage is applied and successively increased from 0 V to 400 V DC (∼20 V μm−1), the holographic notch shifts to longer wavelengths (645 nm to 830 nm). Removal of the DC reverts to reflection band to the original wavelength. Similar EO behavior was observed in samples fabricated with C11M (data not shown here).
Both C6M and C11M samples display a large red-shift in the reflection notch with increasing DC voltage, and the tuning range of these samples is summarized in Fig. 5b and Fig. S2 (ESI†). The three samples show reversible switching and large red-shift of the holographic reflection notch (180–200 nm). Interestingly, the H-PSLC sample with a longer flexible spacer (C11M) exhibits a larger tuning range in the same DC field. The polymer network of the C11M samples can be deformed to a greater extent than the C3M and C6M samples under the same conditions. The increased spacer length results in higher molecular weight between crosslinks and lower crosslink density of the polymer network.
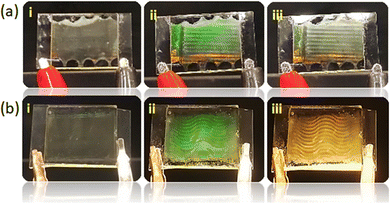
To show the enhanced utility of holographic patterning, H-PSLC samples were patterned using various photomasks. The LC mixture was photopolymerized under conditions to create a green reflection grating, but two different photomasks were used to create straight and wavy line patterns in the H-PSLC (Fig. 6). Areas exposed through the photomask form the holographically patterned layered structure, but the masked areas remain unpolymerized. Both samples are initially transparent (Fig. 6a-i and b-i), and a straight or wavy line pattern with green reflection color appears when an AC field (100 V at 1 kHz) is applied (Fig. 6a-ii and b-ii). The patterned green reflective color can be further tuned by applying a DC field (50 V) which changes the reflective color from green to red or yellow (Fig. 6a-iii and b-iii).
Recently, Zhao and colleagues reported the cooperative thermal response behavior of a polymer dispersed liquid crystal (PDLC) transmission grating using a fluorescent aggregation induced emission luminogen (AIEgen) that shows two different images when exposed to two light sources.47,48 This sample with two different images can be a good anti-counterfeiting material. Compared to the work of Zhao and colleagues, current H-PSLC samples can initially hide images and colors, and external stimuli induce images with various reflective colors by the combination of electric fields. This color and image control makes H-PSLC samples an excellent anti-counterfeiting material.
Zheng et al. recently reported tunable color-based anti-counterfeiting and light encryption of several cholesteric liquid crystal systems.49–51 Light-induced dynamic helical transformation of chiral photo-switches in cholesteric liquid crystals can control the color tuning, erasing, reversibility, multistability and viewing angle dependence of pre-recorded patterns. These properties lead to digitally controllable, selectable and extractable multistable reflection states that can be used for anti-counterfeiting or encryption.49 Frequency-responsive heliconical LCs have been demonstrated to show reversible modulation of the photonic bandgap over a wide spectral range by delicately combining frequency-dependent thermal effects, field-induced dielectric torque, and elastic equilibrium.50 They also demonstrated that programmed micro-patterned heliconical structures prepared by local polymer stabilization can be used for anti-counterfeiting applications by controlling the applied electric field to exhibit high color saturation and full color range, including visible light.51
In Fig. 7, a H-PSLC sample was patterned under the reflection grating condition with a variable line grating photomask (Thorlabs). Fig. S3 (ESI†) shows photographs of a line-grating target (Thorlabs) and patterned reflection gratings under cross-polarizers. The patterned sample is initially transparent (Fig. 7-i) and when an AC field (100 V at 1 kHz) is applied (or when the sample is heated), a line-grating pattern (Fig. 7-ii) with a green reflective color appears. Various diffraction patterns along the line grating reflection sample are observed upon exposure of a He–Ne red laser, as shown in Fig. 7-v–vii. When a 15 V DC voltage is applied while applying an AC field, the green reflection color becomes red with the line grating (Fig. 7-iii), while the diffraction pattern remains the same (Fig. 7-viii). When a DC voltage is applied, the color changes from green to red, but the diffraction pattern does not change. This indicates that the line pattern remains unchanged.
 | ||
| Fig. 7 Patterned H-PSLC reflection grating sample using a variable line grating target (Thorlabs). The sample is at (i and iv) 0 V, (ii and v–vii) 100 V at 1 kHz, (iii and viii) 15 V DC while applying an AC field. (v–vii) Different positions at the line grating sample. See Video S3 in the ESI.† The sample was prepared from the LC mixture containing 0.5 wt% RB, 1 wt% NPG, 15 wt% C6M and 83.5 wt% 5CB. The sample size is 2.5 cm × 3.3 cm and the active area is 2 cm × 3.3 cm. | ||
Conclusions
In this study, we report for the first time the reconfigurable optical properties of holographic Bragg reflection colors, images, and diffraction patterns in H-PSLC gels with relative low polymer concentrations. The initially transparent sample exhibits reversible wavelength selective reflectivity by tuning the AC electric field strength, which can be further tuned, such as by increasing the DC electric field to shift the holographic notch to a longer wavelength. In addition, proper use of AC and DC fields allows control of the reflection color and diffraction pattern of the holographically patterned LC gels prepared using various photomasks. These reconfigurable optical properties of holographic LC gels may open new directions for use in several applications requiring optical security and encryption.Author contributions
Early conceptualization of the studies: K. M. L., M. E. M. and N. P. G.; investigation: K. M. L. and V. Y. R.; writing and original draft preparation: K. M. L.; writing, review and editing: V. Y. R., C. P. A., Z. M. M., M. E. M., K. M. L. and N. P. G.Conflicts of interest
There are no conflicts to declare.Acknowledgements
The authors acknowledge funding from the Materials and Manufacturing Directorate of the Air Force Research Laboratory under contract #FA8650-16-D-5404.References
- R. L. Sutherland, T. J. Bunning, L. V. Natarajan, V. P. Tondiglia, S. A. Siwecki and S. Chandra, SPIE Proc., 2001, 4463, 1 CrossRef CAS.
- K. Tanaka, K. Kato, S. Tsuru and S. Sakai, J. Soc. Inf. Display, 1994, 2, 37–40 CrossRef.
- L. H. Domash, G. P. Crawford, A. C. Ashmead, R. T. Smith, M. M. Popovich and J. Storey, SPIE Proc., 2000, 4107, 46 CrossRef CAS.
- L. De Sio, N. Tabiryan and T. J. Bunning, Opt. Express, 2015, 23, 32696 CrossRef CAS PubMed.
- R. Caputo, L. De Sio, A. Veltri, C. Umeton and A. V. Sukhov, Opt. Lett., 2004, 29, 1261–1263 CrossRef PubMed.
- L. De Sio, S. Ferjani, G. Strangi, C. Umeton and R. Bartolino, Soft Matter, 2011, 7, 3739–3743 RSC.
- L. De Sio and N. Tabiryan, J. Polym. Sci., Polym. Phys., 2014, 52, 158–162 CrossRef.
- T. J. Bunning, L. V. Natarajan, R. L. Sutherland and V. P. Tondiglia, Annu. Rev. Mater. Sci., 2000, 30, 83 CrossRef CAS.
- Handbook of Advanced Electronic and Photonic Materials and Devices, ed. R. L. Sutherland, L. V. Natarajan, V. P. Tondiglia and T. J. Bunning, Academic Press, San Diego, 2000 Search PubMed.
- C. C. Bowley, P. A. Kossyrev, G. P. Crawford and S. Faris, Appl. Phys. Lett., 2001, 79, 9 CrossRef CAS.
- L. V. Natarajan, C. K. Shepherd, D. M. Brandelik, R. L. Sutherland, S. Chandra, V. P. Tondiglia, D. Tomlin and T. J. Bunning, Chem. Mater., 2003, 15, 2477–2484 CrossRef CAS.
- T. J. Bunning, L. V. Natarajan, V. P. Tondiglia, R. L. Sutherland, D. L. Veziet and W. W. Adams, Polymer, 1996, 37, 3147–3150 CrossRef CAS.
- S. A. Holmstrom, L. V. Natarajan, V. P. Tondiglia, R. L. Sutherland and T. J. Bunning, Appl. Phys. Lett., 2004, 85, 1949–1951 CrossRef CAS.
- G. S. He, T.-C. Lin, V. K. S. Hsiao, A. N. Cartwright, P. N. Prasad, L. V. Natarajan, V. P. Tondiglia, R. Jakubiak, R. A. Vaia and T. J. Bunning, Appl. Phys. Lett., 2003, 83, 2733–2735 CrossRef CAS.
- L. V. Natarajan, D. P. Brown, J. M. Wofford, V. P. Tondiglia, R. L. Sutherland, P. F. Lloyd and T. J. Bunning, Polymer, 2006, 47, 4411–4420 CrossRef CAS.
- K. Liu, H. Xu, H. Hu, Q. Gan and A. N. Cartwright, Adv. Mater., 2012, 24, 1604–1609 CrossRef CAS PubMed.
- J. D. Busbee, A. T. Juhl, L. V. Natarajan, V. P. Tondiglia, T. J. Bunning, R. V. Vaia and P. V. Braun, Adv. Mater., 2009, 21, 3659–3662 CrossRef CAS.
- J. Klosterman, L. V. Natarajan, V. P. Tondiglia, R. L. Sutherland, T. J. White, C. A. Guymon and T. J. Bunning, Polymer, 2004, 45, 7213–7218 CrossRef CAS.
- V. P. Tondiglia, L. V. Natarajan, R. L. Sutherland, D. Tomlin and T. J. Bunning, Adv. Mater., 2002, 14, 187–191 CrossRef CAS.
- R. L. Sutherland, V. P. Tondiglia, L. V. Natarajan and T. J. Bunning, Appl. Phys. Lett., 2001, 79, 1420–1422 CrossRef CAS.
- K. K. Vardanyan, J. Qi, J. N. Eakin, M. De Sarkar and G. P. Crawford, Appl. Phys. Lett., 2002, 81, 4736–4738 CrossRef CAS.
- M. Jazbinšek, I. Drevensek-Olenik, M. Zgonik, A. K. Fontecchio and G. P. Crawford, J. Appl. Phys., 2001, 90, 3831–3837 CrossRef.
- D. E. Lucchetta, L. Criante and F. Simoni, J. Appl. Phys., 2003, 93, 9669–9674 CrossRef CAS.
- Y. Hu, X. Hao, L. Xu, X. Xie, B. Xiong, Z. Hu, H. Sun, G.-Q. Yin, X. Li, H. Peng and H.-B. Yang, J. Am. Chem. Soc., 2020, 142, 6285–6294 CrossRef CAS PubMed.
- H. Peng, L. Yu, G. Chen, Z. Xue, Y. Liao, J. Zhu, X. Xie, I. I. Smalyukh and Y. Wei, ACS Appl. Mater. Interfaces, 2019, 11, 8612–8624 CrossRef CAS PubMed.
- S. Fenoll, F. Brocal, J. D. Segura, M. Ortuño, A. Beléndez and I. Pascual, Polymers, 2019, 11, 321 CrossRef PubMed.
- R. Castagna, A. Di Donato, O. Francescangeli and D. E. Lucchetta, Chemosensors, 2022, 10, 356 CrossRef.
- F. Ahmad, M. Jamil and Y. J. Jeon, Int. J. Polym. Anal. Charact., 2017, 22, 659–668 CrossRef CAS.
- Y. Liu, J. Zheng, T. Shen, K. Wang and S. Zhuang, Liq. Cryst., 2019, 46, 1852–1860 CrossRef CAS.
- W.-C. Luo, Y.-D. Xu, G.-X. Yu, S.-S. Li, H.-Y. Li and L.-J. Chen, Opt. Express, 2020, 28, 17307–17319 CrossRef PubMed.
- D.-K. Yang, C.-C. Chien and J. W. Donna, Appl. Phys. Lett., 1992, 60, 3102–3104 CrossRef CAS.
- F. Zhang and D.-K. Yang, SID Int. Symp. Dig. Tech. Pap., 2002, 33, 469–471 Search PubMed.
- Y. H. Lin, H. Ren, Y.-H. Fan, Y.-H. Wu and S.-T. Wu, J. Appl. Phys., 2005, 98, 043112 CrossRef.
- H. Ren and S.-T. Wu, J. Appl. Phys., 2002, 92, 797–800 CrossRef CAS.
- Y. Yin, W. Li, H. Cao, J. Guo, B. Li, S. He, C. Ouyang, M. Cao, H. Huang and H. Yang, J. Appl. Polym. Sci., 2009, 111, 1353–1357 CrossRef CAS.
- L. De Sio, P. F. Lloyd, N. V. Tabiryan and T. J. Bunning, ACS Appl. Mater. Interfaces, 2018, 10, 13107–13112 CrossRef CAS PubMed.
- K. Kato, T. Hisaki and M. Date, Jpn. J. Appl. Phys., 1999, 38, 805–808 CrossRef CAS.
- A. M. Urbas, V. P. Tondiglia, L. V. Natarajan, R. L. Sutherland, H. Yu, J.-H. Li and T. J. Bunning, J. Am. Chem. Soc., 2004, 126, 13580–13581 CrossRef CAS PubMed.
- K. M. Lee, V. P. Tondiglia, N. P. Godman, T. J. White, T. J. Bunning and M. E. McConney, ACS Photonics, 2020, 7, 1978–1982 CrossRef CAS.
- K. M. Lee, V. P. Tondiglia, T. Lee, I. I. Smalyukh and T. J. White, J. Mater. Chem. C, 2015, 3, 8788–8793 RSC.
- V. P. Tondiglia, L. V. Natarajan, C. A. Bailey, M. E. McConney, K. M. Lee, T. J. Bunning, R. Zola, H. Nemati, D.-K. Yang and T. J. White, Opt. Mater. Express, 2014, 4, 1465–1472 CrossRef CAS.
- H. Nemati, S. Liu, R. S. Zola, V. P. Tondiglia, K. M. Lee, T. J. White, T. J. Bunning and D.-K. Yang, Soft Matter, 2015, 11, 1208–1213 RSC.
- K. M. Lee, E. P. Crenshaw, M. Rumi, T. J. White, T. J. Bunning and M. E. McConney, Materials, 2020, 13, 746 CrossRef CAS PubMed.
- M. E. McConney, V. P. Tondiglia, L. V. Natarajan, K. M. Lee, T. J. White and T. J. Bunning, Adv. Opt. Mater., 2013, 1, 417–421 CrossRef.
- H. Nemati, S. Liu, A. Moheghi, V. P. Tondiglia, K. M. Lee, T. J. Bunning and D.-K. Yang, J. Mol. Liq., 2018, 267, 120–126 CrossRef CAS.
- K. M. Lee, V. P. Tondiglia, M. Rumi and T. J. White, J. Polym. Sci., Polym. Phys., 2018, 56, 1087–1093 CrossRef CAS.
- Y. Zhao, X. Zhao, M.-D. Li, Z. Li, H. Peng and X. Xie, Angew. Chem., Int. Ed., 2020, 59, 10066–10072 CrossRef CAS PubMed.
- Y. Zhao, H. Peng, X. Zhou, Z. Li and X. Xie, Adv. Sci., 2022, 9, 2105903 CrossRef PubMed.
- Z. Zheng, H. Hu, Z. Zhang, B. Liu, M. Li, D.-H. Qu, H. Tian, W.-H. Zhu and B. L. Feringa, Nat. Photonics, 2022, 16, 226–234 CrossRef CAS.
- B. Liu, C.-L. Yuan, H.-L. Hu, H. Wang, Y. W. Zhu, P.-Z. Sun, Z.-Y. Li, Z.-G. Zheng and Q. Li, Nat. Commun., 2022, 13, 2712 CrossRef CAS PubMed.
- B. Liu, C.-L. Yuan, H.-L. Hu, H. Wang, Y.-W. Zhu, P.-Z. Sun, Z.-Y. Li, Z.-G. Zheng and Q. Li, J. Mater. Chem. C, 2022, 10, 16924 RSC.
Footnote |
| † Electronic supplementary information (ESI) available. See DOI: https://doi.org/10.1039/d3ma00041a |
| This journal is © The Royal Society of Chemistry 2023 |

