
 Open Access Article
 This Open Access Article is licensed under a Creative Commons Attribution-Non Commercial 3.0 Unported Licence
A fluorescent sensor to detect lead leakage from perovskite solar cells†
Lorenzo
Pancini
,
Riccardo
Montecucco
,
Valentina
Larini
,
Alessandra
Benassi
,
Diego
Mirani
,
Giovanni
Pica
 ,
Michele
De Bastiani
,
Filippo
Doria
* and
Giulia
Grancini
*
,
Michele
De Bastiani
,
Filippo
Doria
* and
Giulia
Grancini
*
Department of Chemistry & INSTM Università di Pavia, Via T. Taramelli 14, Pavia 27100, Italy. E-mail: filippo.doria@unipv.it; giulia.grancini@unipv.it
First published on 18th May 2023
Abstract
Hybrid perovskites have been considered a hot material in the semiconductor industry; included as an active layer in advanced devices, from light emitting applications to solar cells, where they lead as a new strategic solution, they promise to be the next generation high impact class of materials. However, the presence – in most cases – of lead in their matrix, or lead byproducts as a consequence of material degradation, such as PbI2, is currently hindering their massive deployment. Here, we develop a fluorescent organic sensor (FS) based on the Pb-selective BODIPY fluorophore that emits when the analyte – lead in this case – is detected. We carried out a fluorimetric analysis to quantify the trace concentration of Pb2+ released from lead-based perovskite solar cells, exploring different material compositions. In particular, we immersed the devices in rainwater, to simulate the behavior of the devices under atmospheric conditions when the sealing is damaged. The sensor is studied in a phosphate buffer solution (PBS) at pH 4.5 to simulate the pH of acidic rain, and the results obtained are compared with ICP-OES measurements. We found that with fluorometric analysis, lead concentration could be calculated with a detection limit as low as 5 μg l−1, in agreement with ICP-OES analysis. In addition, we investigated the possibility of using the sensor on a solid substrate for direct visualization to determine the presence of Pb. This can constitute the base for the development of a Pb-based label that can switch on if lead is detected, alerting any possible leakage.
1. Introduction
Perovskite solar cells (PSCs) are an emerging photovoltaic technology and show great promise to disrupt the solar cell market. Indeed, in less than ten years, PSCs have achieved record power conversion efficiencies (PCE) of 25.7%1 close to those of the most efficient crystalline silicon technologies.2 These remarkable achievements are due to the unique optoelectronic properties of PSCs, such as the defect tolerance, steep absorption coefficient,3 long diffusion length,4 and tunable bandgap.5 Nowadays, the most efficient formulation of PSCs always includes lead as the B-site divalent-cation6 in the ABX3 structure7 (Fig. 1(a)).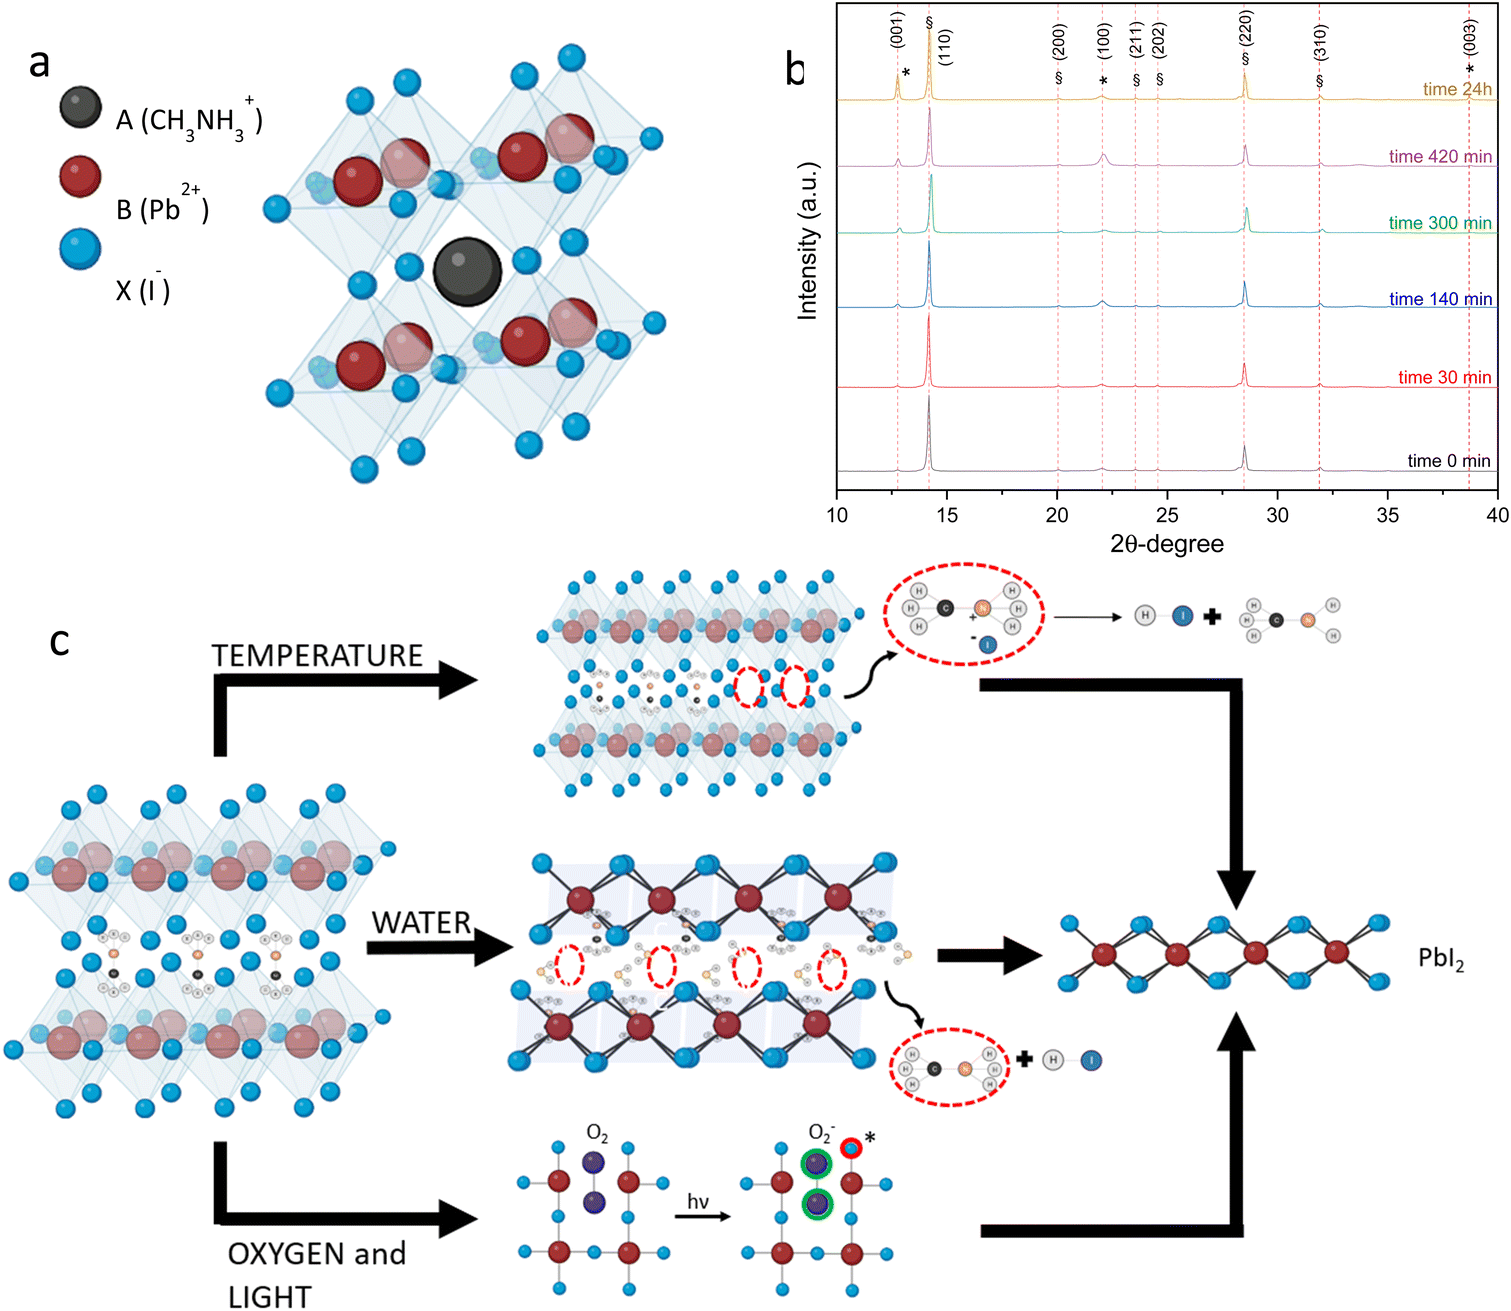 | ||
| Fig. 1 Generic crystal structure of an organic–inorganic hybrid perovskite where A is the organic cation, B is the inorganic cation and X is the anion, usually halogen (a); XRD patterns of the MAPbI3 perovskite stored under high humidity conditions (RH 75%), at different times (b); a schematic representation of the different degradation pathways and byproducts released by the MAPbI3 perovskite (c). | ||
Despite their excellent properties these devices suffer from poor stability under environmental conditions: hybrid perovskites tend to degrade in the presence of heat8 and moisture9 and upon exposure to light and oxygen10 releasing several byproducts including PbI2. High humidity conditions promote the formation of the hydrated complex with the perovskite causing structural deformation and the release of PbI2,11 as shown in the XRD diffraction pattern in Fig. 1(b), obtained by recording the XRD measurements of the MAPbI3 perovskite at different times and under RH 75% conditions. The XRD pattern after 24 hours shows the degradation of the perovskite: the peaks related to PbI2 are assigned to the (001), (100) and (003) planes at angles 12.76°, 22.07° and 38.69°, respectively. The diffraction peaks at 14.20°, 20.04°, 23.56°, 24.58°, 28.52° and 31.95° related to MAPbI3 correspond to the planes (110), (200), (211), (202), (220) and (310). In addition, the organic cation can further degrade, causing the release of additional byproducts including HI and methylamine,12 as shown in eqn (1).
| (CH3NH3)4PbI6·2H2O → PbI2 + 4CH3NH2 + 4HI + 2H2O | (1) |
Perovskite solar cells are unstable even under prolonged thermal stress. At 40 °C, which is the typical temperature reached by solar modules under the operating conditions, the perovskite is subjected to the degradation pathway that leads to the initial precursors according to eqn (2). By increasing the temperature, the decomposition of the organic cation also occurs with the release of volatile compounds.13
| CH3NH3PbI3 CH3NH3I + PbI2 | (2) |
Moreover, exposure to light and oxygen are other key factors in the stability of perovskites. Molecular oxygen can be adsorbed and then reversibly diffused through the iodide vacancies. Upon photoexcitation, perovskite reacts with the superoxide species O2−, which initiates an acid–base reaction with the MA+ cation through deprotonation, forming water molecules, iodine, lead iodide, and methylamine gas,14 as shown in eqn (3).
| 4CH3NH3PbI3* + O2− 4PbI2 + 2H2O + 4CH3NH2 + 2I2 | (3) |
Most of the byproducts generated by these different degradation pathways (summarized in Fig. 1(c)) are remarkably dangerous, due to lead toxicity in an aqueous environment and towards living organisms.15
For this reason, several attempts have been made to replace the Pb cation. Among these attempts, double perovskites based on Ag and Bi16 were identified as possible candidates, but unfortunately, their maximum photovoltaic performances of 4.3% are not sufficiently high. Replacing Pb with Sn is possible and the theoretical PCE limit for Sn-based PSCs is 30%;17 the main issue with tin-based perovskite cells is instability due to the tendency of Sn2+ to oxidize to Sn4+. However, tin is used to fabricate Sn–Pb based perovskites, in which lead is partially replaced. This allows the production of more high-performance and tunable band gap devices.18 In addition to single junction perovskite cells, hybrid Sn–Pb perovskites have found great application as low-band gap perovskite sub-cells for tandem devices.19–21 Therefore, it is very likely that PSCs will seek their early commercialization with Pb-based formulation. This translates into higher manufacturing costs due to the extra caution required for the production process and waste management. Moreover, it will be necessary to secure any potential environmental contamination from the perovskite modules once degraded outdoors. The lead once released as a by-product from the perovskite modules presents a serious hazard.22 Lead, being a heavy metal, can contaminate the soil and then can be bioaccumulated by plants, becoming a threat to other living organisms. In addition, lead in the form of PbI2 is much more easily adsorbed by plants23 than all other sources of lead in the soil. For human beings, the main hazard of lead poisoning is related to its ability to penetrate soft tissues and replace the metal cations in our bodies by interfering with major enzyme functions. Exposure to high concentrations of the lead causes anemia, increased blood pressure, neurodegenerative diseases,24 and even death.25
Motivated by these reasons, we developed a chemical sensor, selective for Pb2+, that is able to detect the presence of Pb2+ in liquids with a limit of detection (LOD) of 5.23 μg l−1. The sensor has intrinsic fluorescence quenched by the process of photoinduced electron transfer (PET) in which the lone pair of nitrogen atoms are involved. In the presence of the lead cation, complexation occurs with the nitrogen of the aromatic core and side chains. This complexation prevents PET and allows the relative enhancement of the photoluminescence, as investigated in ref. 26 but is never applied to the detection of Pb-leaks caused by PSCs. In recent years various techniques have been developed for the detection of lead analytes. Guo et al. have developed an amino-functionalized Ni(II)-based metal–organic framework (MOF)27 capable of selectively detecting trace amounts of Pb2+ through square wave anodic stripping voltammetry (SWASV) analysis. Marawani et al. have synthesized carboxyl-functionalized multiwall carbon nanotubes (f-MWCNTs)28 capable of selectively detecting lead in an aqueous solution through ICP-OES analysis with an uptake capacity of 72.12 mg g−1 and a detection limit of 0.25 ng l−1. Another work, based on the ICP-OES technique, was reported by Smirnova et al.29 The total lead concentration was measured through a pre-concentration process in a two-phase aqueous system of tetrabutylammonium bromide (TBAB)–H2O–(NH4)2SO4 and extraction with 4-(2-pyridylazo)-resorcinol. The extract was captured with an oleophilic collector and analyzed with ICP-OES, showing a LOD of 0.2 μg l−1. Song et al. reported in their recent work an analytical method based on HPLC-ICP-MS instrument capable of detecting Pb2+ traces in different aqueous sources: drinking water, river water, pond water, and tap water.30 The LOD of the developed method is 0.004 ηg L−1, well below the legal limits, and with a linear range between 0.1 and 100 ηg L−1. Another approach for lead detection is the study conducted by Yu et al. in which lignin-functionalized Au NPs (L-Au NPs) are used.31 The color change of L-Au NPs from red to purple indicates the presence of Pb2+ ions. This technique allows for the detection of Pb even at low concentrations (LOD of 1.8 μM) in a linear range of 0.1–1 mM. Finally, Aamir et al. reported a cesium-based perovskite sensor capable of selectively detecting Pb2+.32 In the presence of the cations Cr3+, Co2+, Cd2+, Fe2+, Mn2+, and Zn2+, the photoluminescence response of the CsCuCl3 perovskite in the presence of Pb2+ remains almost unchanged. Furthermore, they observed that the linear range goes from 0.1 μM to 1.5 μM, demonstrating that it can be used as a turn-on sensor for detecting Pb2+.
The sensors reported in the literature are valid alternatives to the FS proposed in this work. However, the main advantages of our sensor are the low cost and velocity of the fluorescence technique, the ability to detect and quantify Pb, and the small amount of time required for the sample preparation and measurement. Techniques based on ICP have better LOD and sensitivity, but the high cost of equipment and the need for sample pre-treatment makes them less suitable for practical applications where quick detection is required. A CsCuCl3-based perovskite is a very interesting inorganic sensor; however, the PL response of the sensor with Pb2+ may vary depending on the presence of Hg2+. Finally, the colorimetric technique based on NPs has a linear range of 0.1–1 mM, which is too high compared to international standards. Additionally, the sensor's absorption signal varies over time due to NP aggregation.
Here, we investigate the detection properties of FS by dissolving PSCs of different compositions in ambient acid rain to mimic the leakage of a degraded module. We investigated the possibility of detecting Pb in the concentration range of 0 to 2.3 μM (476 μg l−1) considering that the legal limits of Pb concentration for potable water are 10 μg l−1 according to World Health Organization (WHO) guidelines, 15 μg l−1 per the United States Environmental Protection Agency (USEPA)33 and 10 μg l−1 per European Union (EU) Drink Water Directive (DWD).34 We compared our results with measurements by ICP-OES to confirm the analytical data. The use of the organic sensor makes it possible to estimate [Pb2+] with accuracy by fluorimetric analysis, which has a significantly lower cost than the normal techniques used for metal detection such as ICP-OES and AAS. Lastly, we engineered our sensor in the solid-state, as a proof of concept for an early application.
2. Experimental section materials/methods
2.1 Materials
2.2 PSC fabrication
![[thin space (1/6-em)]](https://www.rsc.org/images/entities/char_2009.gif) :15 (v:v) mixture of titanium(IV) diisopropoxide bis(acetylacetonate) and IPA at 450 °C, followed by an annealing at 450 °C for 1 h. Then, the mesoporous TiO2 (m-TiO2) was spin-coated from a 1:8 (m/v) mixture of 30NR-D titania paste and ethanol on top of the c-TiO2. The spin coating program was 5000 rpm, 20 s, 2000 rpm. The substrates were then annealed at 500 °C for 20 minutes. The 0.85 CsPbI3 perovskite precursor solution was prepared by dissolving stoichiometric CsI, PbI2 and DMAI with a 1:1:1 molar ratio in a solvent mixture (DMF/DMSO = 4/1 vol:vol). Then, the CsPbI3 active layer was spin-coated on top of the FTO/c-TiO2/m-TiO2 substrates (3000 rpm, 30 s, 1000 rpm). The substrates were subsequently annealed at 210 °C for 5 minutes. A layer of hole transport material (HTM) was spin-coated on top of the annealed films, which consisted of 78 mg of spiro-OMeTAD, 31 uL of 4-tertbutylpyridine, 19 μL of bis(trifluoromethane) sulfonamide lithium salt (Li-TFSI) (517 mg mL−1 in acetonitrile) and 14 μL of FK209 Co3+ salt (376 mg mL−1 in acetonitrile). The spin-coating program was 4000 rpm, 40 s, 2000 rpm. Finally, a 80 nm thick Au layer was deposited by thermal evaporation.
:15 (v:v) mixture of titanium(IV) diisopropoxide bis(acetylacetonate) and IPA at 450 °C, followed by an annealing at 450 °C for 1 h. Then, the mesoporous TiO2 (m-TiO2) was spin-coated from a 1:8 (m/v) mixture of 30NR-D titania paste and ethanol on top of the c-TiO2. The spin coating program was 5000 rpm, 20 s, 2000 rpm. The substrates were then annealed at 500 °C for 20 minutes. The 0.85 CsPbI3 perovskite precursor solution was prepared by dissolving stoichiometric CsI, PbI2 and DMAI with a 1:1:1 molar ratio in a solvent mixture (DMF/DMSO = 4/1 vol:vol). Then, the CsPbI3 active layer was spin-coated on top of the FTO/c-TiO2/m-TiO2 substrates (3000 rpm, 30 s, 1000 rpm). The substrates were subsequently annealed at 210 °C for 5 minutes. A layer of hole transport material (HTM) was spin-coated on top of the annealed films, which consisted of 78 mg of spiro-OMeTAD, 31 uL of 4-tertbutylpyridine, 19 μL of bis(trifluoromethane) sulfonamide lithium salt (Li-TFSI) (517 mg mL−1 in acetonitrile) and 14 μL of FK209 Co3+ salt (376 mg mL−1 in acetonitrile). The spin-coating program was 4000 rpm, 40 s, 2000 rpm. Finally, a 80 nm thick Au layer was deposited by thermal evaporation.
2.3 Methods
XRD patterns were measured on a Brucker D2 X-Ray diffractometer with a copper X-ray tube (λ = 1.5418 Å, 300 W, 30 kV) as an X-ray generator and a Lynxeye (1D mode) detector. The measurements were conducted using a 2 theta range of 10°–40°, a step size of 0.04°, and a rate of 1 step per s. Fluorescence spectra were recorded with an Agilent Cary Eclipse spectrofluorometer, at a scan rate of 600 nm min−1, in a 495–600 nm interval, manual voltage 550 V, with a bandwidth of excitation and emission slits at 5 nm for FS in the liquid phase and 2.5 nm for the solid phase. 1H- and 13C-NMR spectra were recorded on a Bruker Avance 400 MHz and a Bruker Avance 200 MHz. Purification of compounds 2 and 3 was carried out with Biotage Isolera ONE Flash Chromatography MPLC System. Purification of compound 5 was performed via Preparative HPLC purification on an Agilent Technologies 1260 Infinity preparative HPLC system using a Waters XSelect CSH Phenyl-Hexyl column (5 μm, 150 × 30 mm). The characterization of compound 5 was effectuated via Analytical HPLC analysis on an Agilent SERIES 1260 system on an XBridge® BEH C18 column (2.5 μm, 4.6 × 50 mm) and the mass spectra were recorded on a Thermo Finnigan (San Jose, CA, USA) UPLC system using a BEH Acquity UPLC column (1.7 μm, 2.1 × 50 mm2) coupled with an LCQ ADV MAX ion-trap mass spectrometer (ESI† ion source). pH measurements were performed using a Crison Medidor PH BASIC 20 pH-Meter. ICP measurements were performed using a iCAP 7400 ICP-OES.2.4 Spectroscopy analysis
To construct the calibration line, fluorescence measurements were carried out in the presence of increasing concentrations of PbI2. Each analysis was made in triplicate and the calibration line was obtained from the average of the three different sets of experiments. The sensor stock solution was diluted in a final volume of 3 mL of 0.1 M PBS, at pH 4.5, to achieve a final concentration of 5.5 μM. An aqueous stock solution of PbI2 153 μM was prepared with 10% HCl to facilitate dissolution of the salt. Sixteen solutions of FS 5.5 μM in PBS were prepared, with increasing concentrations of PbI2, and the fluorescence spectrum was recorded for each addition. The experimental set was repeated three times with three different stock solutions of FS. PbI2 detection of the standards solution was performed by calculating the Pb2+ concentration using the calibration line equation. For this analysis, we employed the same experimental conditions used to build the calibration line. To record fluorescence, 5 μL of a PbI2 solution of known concentration was added to the FS solution in PBS. Each measurement was repeated three times. The same procedure was used to record the [PbI2] of samples derived from PSCs. For fluorescence measurements on a solid substrate, 5 μL of PbI2 5.5 mM stock solution were deposited on paper, and following FS adsorption, 2 μL of PbI2 (HCl 10%) 760 μM solution was added. The experiment was carried out 3 times.2.5 FS Synthesis
:3, v/v) as an eluent, using a 100 g Biotage Sfar Silica D Cartridge with a 50 mL min−1 flow. The final product was recrystallized in 40 mL of ethanol to obtain 11.6 g (final yield 63%) of compound 2 as a white solid. 1H NMR- (CDCl3, 300 MHz) δ 7.01–7.07 (m, 2H), 6.92–6.98 (m, 2H), 4.30 (s, 8H), 4.11 (q, J = 7.0 Hz, 8H), 1.19 (t, J = 7.0 Hz, 1H).
:3, v/v) as an eluent to obtain 0.335 g (final yield 35%) of compound 3 as a yellow solid. 1H NMR- (CDCl3, 300 MHz) δ 9.81 (s, 1 H), 7.59 (s, 1H), 7.48 (d, J = 8 Hz, 1H), 7.10 (d, J = 8 Hz, 1H), 4.42 (s, 4H), 4.28 (s, 4H), 4.04–4.16 (m, 8H), 1.19 (t, J = 8 Hz,12H).
:3, v/v) as the eluent and dried to obtain 162.0 mg (18%) of compound 3 as an orange oil. 1H NMR- (CDCl3, 300 MHz) δ 7.13 (d, J = 8 Hz, 1H), 6.93 (s, 1H), 6.84 (d, J = 8 Hz, 1H), δ 5.95 (s, 2H), δ 4.35 (s, 4H), 4.29 (s, 4H), 4.02–4.17 (m, 8H), 2.55 (s, 6H), 1.40 (s, 6H), 1.16–1.27 (m, 12H).
3. Results and discussion
The fluorescent sensor (FS) was synthesized drawing from the synthetic protocol described by Lyu et al., suitably optimized to adjust reaction times and improve purification steps in order to achieve higher yields.The synthesis involves four steps (Scheme 1): in step A compound 1 is alkylated with ethyl bromoacetate to obtain compound 2 (final yield = 63%): the reaction time was increased from 7 h to 16 h, and the final product was purified through direct column chromatography (MPLC) using cyclohexane/ethyl acetate (7:3, v/v) as the eluent. Step B relies on the Vilsmeyer formylation reaction (yield = 35%) to introduce BODIPY chromophores by in situ condensation of compound 3 with 2, 4-dimethylpyrrole and insertion of BF3–OEt2 (yield = 18%). In steps B and C the products were purified by direct phase chromatography using cyclohexane/ethyl acetate (7:3, v/v) as the eluent. The final ester ammonolysis reaction of compound 4 with diethanolamine afforded the FS, which was purified by reverse-phase preparative HPLC with a final yield of 83%.
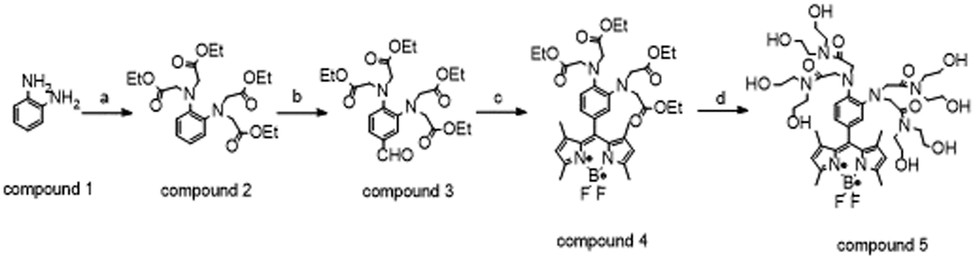 | ||
| Scheme 1 (a) ethyl bromoacetate, KI, DIPEA, CH3CN, reflux under Ar, 16 h, rt; (b) POCl3, DMF, dry pyridine, reflux under Ar, rt, 1 h and warmed up to 75 °C, 45 min; (c) (1) 2,4-dimethylpyrrole-TFA, DCM, reflux under Ar, 14 h, rt; (2) DDQ, reflux under Ar, 4 h, rt; (3) NEt3, BF3·OEt2, reflux under Ar, 2 h, rt; (d) diethanolamine, CH3CN, reflux under Ar, 24 h, rt. | ||
To verify the fluorescence enhancement of the sensor in the presence of Pb2+, the quantum yields of the sensor and the sensor-Pb complex were calculated under the operating conditions ([FS] = 5.5 μM; PBS 0.1 M, pH = 4.5). Fluorescein in a 0.1 M NaOH solution was used as the standard, and it was observed that the Φsensor = 0.0104 ± 0.0002 and Φcomplex = 0.5370 ± 0.0025 values had increased compared to the work of Liu et al., in which the quantum yields had been measured at pH 7.2. Furthermore, the influence of pH on the stoichiometry of the complex was investigated and a Job plot was constructed. Under neutral aqueous conditions with a pH of 7.2, the stoichiometry of the complex is FS:Pb2+ 1:2; however, under acidic pH conditions, the stoichiometry is FS:Pb2+ 1:1 (SI2, ESI†) due to the protonation of the nitrogen atoms in the side chains that do not have a lone pair available to complex the metal cation.
Finally, the possible competition of cations used in perovskite solar cells with Pb2+ and the influence of the counterion on lead complexation were investigated. The presence of other cations in solution does not change the sensor response, with two exceptions. The first is Ti4+ due to the fact that the salt used, titanium diisopropoxide bis(acetylacetonate), is commercially available in a 75% isopropanol solution. This can affect the pH of the sample and, therefore, reduce the sensor response. As for the counterion, the same response was observed for 2 equivalents of PbI2 and PbBr2, while the lower response for PbCl2 was attributed to the salt's poor solubility in aqueous solution (SI3, ESI†). In order to prove the sensor efficiency in lead detection, several fluorescence analyses were performed. Initially, we used FS to create a calibration curve by fluorimetric titration. Since FS is sensitive to pH variations, all experiments were conducted in 0.1 M phosphate buffer solution (PBS) at pH 4.5 to mimic acidic rain conditions and to keep the experimental conditions constant. The calibration line, obtained from three replicates, shows the fluorescence response of the sensor as a function of Pb2+ concentration in the range of 0–2.3 μM. The sensor was employed in large excess [5.5 μM] over the analyte concentration to achieve the best possible linearity in the range of interest, which includes the legal limits for lead in drinking water. Fig. 2 shows the enhancement in fluorescence as the lead concentration increases. This confirms that complexation blocks the PET process by preventing chromophore quenching. The line fit with an R2 = 0.9992 confirms the high linearity of the response and good reproducibility of the measurement. To confirm the sensitivity and accuracy of the calibration line, three aqueous standard solutions of PbI2 were prepared and samples concentrations were measured by fluorimetric analysis. Each analysis was performed in triplicate and, as reported in Table 1, there was a good correlation between the standard effective concentration of PbI2 and the value recorded through fluorescence analysis.
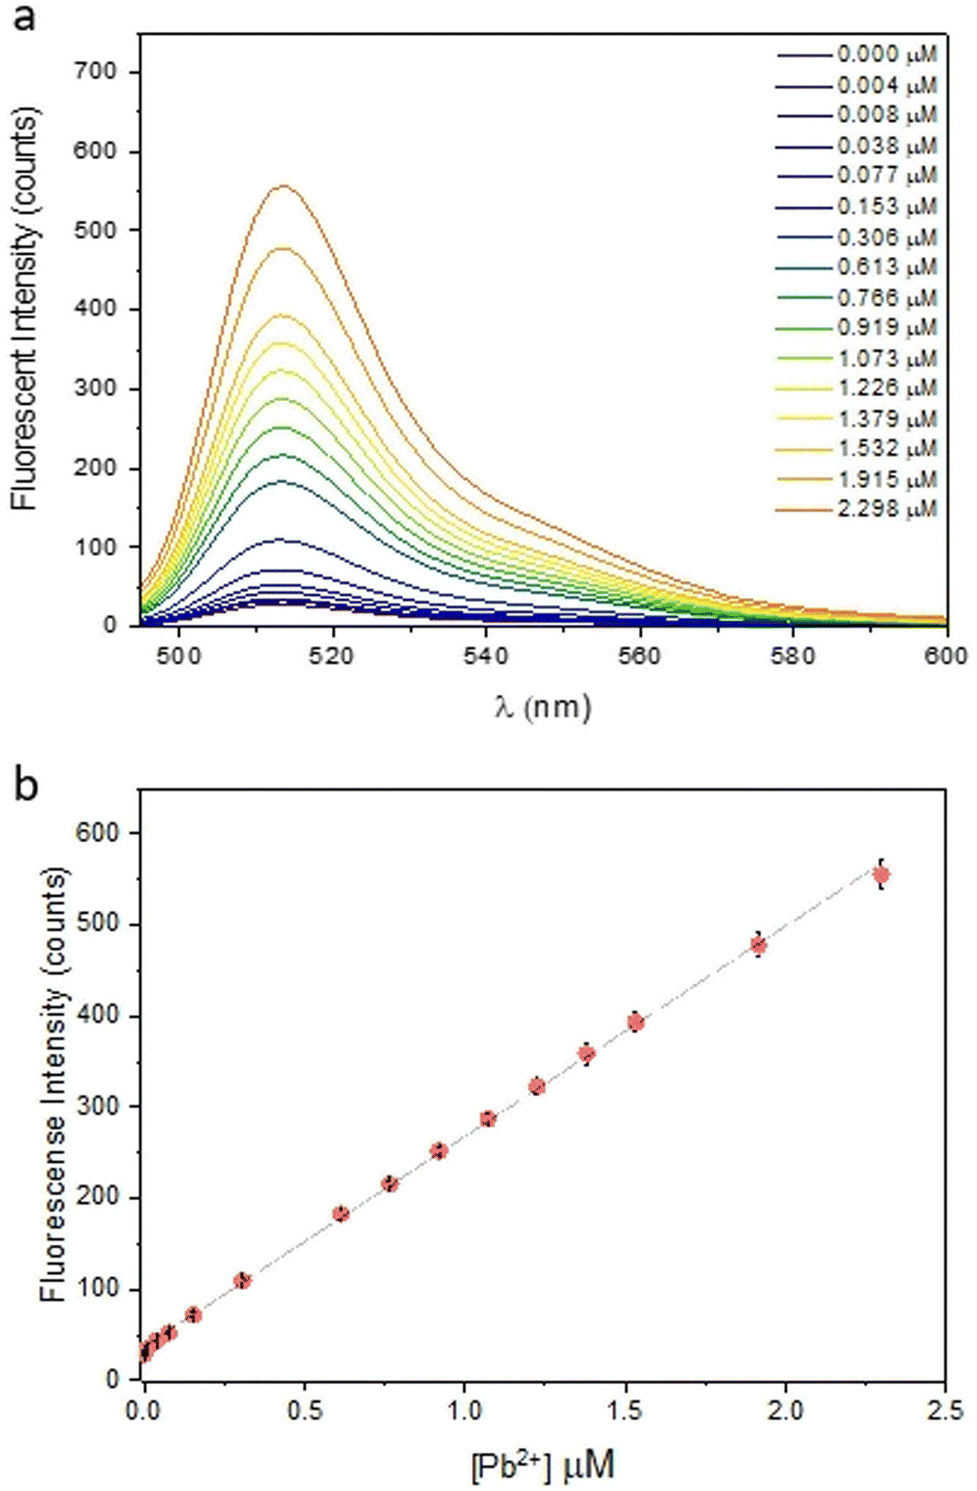 | ||
| Fig. 2 (a) Fluorescence emission spectra (λex = 470 nm) of FS (5.5 μM) in PBS buffer (0.1 M) pH 4.5 with different concentration of Pb2+ (0–2.3 μM); (b) fluorescent intensity at 512 nm as a function of [Pb2+]. | ||
| Effective conc. (mg L−1) | Experimental conc. (mg L−1) | Err.% | |
|---|---|---|---|
| Std 1 | 279.00 | 278.24 ± 3.18 | 0.27 |
| Std 2 | 166.60 | 167.36 ± 3.55 | 0.45 |
| Std 3 | 350.60 | 349.78 ± 2.25 | 0.23 |
Finally, we tested our sensor to detect real perovskite byproducts, by immersing perovskite solar devices in rainwater.
For the experiment, we have employed two cells with different compositions: one organic–inorganic hybrid FA0.8MA0.2PbI3 and one fully inorganic CsPbI3, to evaluate the sensor behavior in the presence of organic and inorganic cations (Fig. 3(a)).
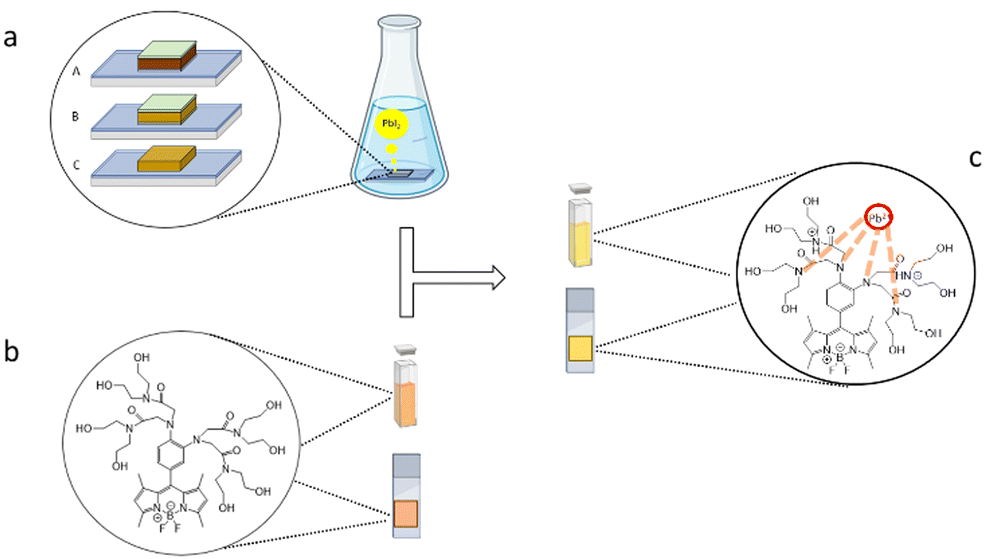 | ||
| Fig. 3 schematic representation of Pb2+ release mechanism from PSCs: (A) CsPbI3; (B) PSCs of FA0.8MA0.2PbI3; (C) FA0.8MA0.2PbI3 perovskite film (a); sensor in liquid phase and supported on solid substrate for fluorimetric measurements (b); and sensor complexation and fluorescence enhancement (c). | ||
To validate the results from the degraded cells, we also prepared a stand-alone perovskite film of FA0.8MA0.2PbI3 (therefore, without transport layers or gold terminal) to assess the presence of interferents arising from the layers of the cell.
The results of our analysis for both the solar cells and the stand-alone film are cross-checked with the elemental quantification obtained by ICP-OES and presented in Table 2. The experiments confirmed the release of PbI2 from all three different samples, with the maximum value of 1617.68 μg l−1, detected for the FAMA perovskite film, while lower values were observed for the samples derived from the cells. The reduced standard deviations also confirm good experimental reproducibility. We found a good agreement between ICP and fluorescence analysis for the CsPbI3 PSC cell, while for the FA0.8MA0.2PbI3 cell a slight overestimation of [PbI2] was observed, despite very similar results recorded with the two different analytical techniques.
| ICP μg l−1 | Fluor. μg l−1 | Err. % | |
|---|---|---|---|
| CsPbI3 PSC | 620.00 | 610.37 ± 2.02 | 1.55 |
| FA0.8MA0.2PbI3 PSC | 326.00 | 384.77 ± 2.48 | 18.03 |
| FA0.8MA0.2PbI3 perovskite film | 1633.00 | 1617.68 ± 7.74 | 0.94 |
In addition, we have investigated the behavior of FS when supported by a solid substrate (Fig. 3(c)). To this aim, 5 μL of 5.5 mM FS sensor stock solution was deposited on paper and the fluorescence spectrum was recorded. Then, 2 μL of PbI2 760 μM standard solution was added to check the fluorescence enhancement. In Table 3 we showed that in all samples the fluorescence intensity increases between 31% and 59%, confirming that FS can also act as an on–off sensor on a solid support and not only in solution.
| F.I. sensor | F.I. sensor + Pb2+ | F.I. enhancement | |
|---|---|---|---|
| Sample 1 | 253.93 | 331.71 | 30.63% |
| Sample 2 | 242.33 | 344.70 | 42.24% |
| Sample 3 | 214.52 | 341.00 | 58.96% |
4. Conclusions
In this work, we explored the possibility of detecting and quantifying Pb2+ released from PSCs promoted by rain. The calibration curve was calculated at pH 4.5, in the range of [Pb2+] including the legal limits imposed by the world's leading organizations on heavy metal contamination in drinking water. The concentrations of PbI2 released from the PSC cells were then quantified, and the results obtained for the CsPbI3 cell and the perovskite were in agreement with ICP data, while an error % of 18% was found for the PSC FA0.8MA0.2PbI3. In addition, the possibility of using the FS as an on–off sensor supported by a solid phase was investigated. The fluorescence enhancement observed for the samples confirmed this possible new application. The results obtained are encouraging and the sensor may be applied in the industrial field as a control for lead release in PSC fabrication processes. In the future, it will be necessary to verify the behavior of the sensor with PSCs of different architectures and processes. The further possible application involves the field of photovoltaic panels, with the possibility of verifying through simple fluorimetric experiments water pollution near photovoltaic installations.Conflicts of interest
There are no conflicts to declare.Acknowledgements
The authors acknowledge prof. Antonella Profumo for the ICP-OES analysis, the “HY-NANO” project that received funding from the European Research Council (ERC) Starting Grant 2018 under the European Union's Horizon 2020 research and innovation program (grant agreement no. 802862) and the Fondazione Cariplo conomia Circolare 2021 Project “Green flexible hybrid perovskite solar module for the market: from smart lead manipulation to recycling” (FLHYPER,no 20201067), funded under the “Circular Economy-2020”call. R. M. and G. G. acknowledge the PhD Fellowship from Eni S.p.A. The authors acknowledge the support from the Ministero dell’Università e della Ricerca (MUR) and the University of Pavia through the program “Dipartimenti di Eccellenza 2023–2027”.Notes and references
- Y. Yao, M. Wang, Q. Cai and D. Wei, Nanoscale, 2022, 14, 7203–7210 RSC.
- K. Yoshikawa, H. Kawasaki, W. Yoshida, T. Irie, K. Konishi, K. Nakano, T. Uto, D. Adachi, M. Kanematsu, H. Uzu and K. Yamamoto, Nat. Energy, 2017, 2, 1–8 Search PubMed.
- S. De Wolf, J. Holovsky, S.-J. Moon, P. Löper, B. Niesen, M. Ledinsky, F.-J. Haug, J.-H. Yum and C. Ballif, J. Phys. Chem. Lett., 2014, 5, 1035–1039 CrossRef CAS PubMed.
- S. D. Stranks, G. E. Eperon, G. Grancini, C. Menelaou, M. J. P. Alcocer, T. Leijtens, L. M. Herz, A. Petrozza and H. J. Snaith, Science, 2013, 342, 341–344 CrossRef CAS PubMed.
- V. D’Innocenzo, A. R. Srimath Kandada, M. De Bastiani, M. Gandini and A. Petrozza, J. Am. Chem. Soc., 2014, 136, 17730–17733 CrossRef PubMed.
- Y. Zhao, F. Ma, Z. Qu, S. Yu, T. Shen, H.-X. Deng, X. Chu, X. Peng, Y. Yuan, X. Zhang and J. You, Science, 2022, 377, 531–534 CrossRef CAS PubMed.
- R. Azmi, E. Ugur, A. Seitkhan, F. Aljamaan, A. S. Subbiah, J. Liu, G. T. Harrison, M. I. Nugraha, M. K. Eswaran, M. Babics, Y. Chen, F. Xu, T. G. Allen, A. ur Rehman, C.-L. Wang, T. D. Anthopoulos, U. Schwingenschlögl, M. De Bastiani, E. Aydin and S. De Wolf, Science, 2022, 376, 73–77 CrossRef CAS PubMed.
- G. Divitini, S. Cacovich, F. Matteocci, L. Cinà, A. Di Carlo and C. Ducati, Nat. Energy, 2016, 1, 1–6 Search PubMed.
- S. Kundu and T. L. Kelly, EcoMat, 2020, 2, e12025 CrossRef CAS.
- N. Aristidou, C. Eames, I. Sanchez-Molina, X. Bu, J. Kosco, M. S. Islam and S. A. Haque, Nat. Commun., 2017, 8, 15218 CrossRef PubMed.
- T. Leijtens, G. E. Eperon, N. K. Noel, S. N. Habisreutinger, A. Petrozza and H. J. Snaith, Adv. Energy Mater., 2015, 5, 1500963 CrossRef.
- J. Yang, B. D. Siempelkamp, D. Liu and T. L. Kelly, ACS Nano, 2015, 9, 1955–1963 CrossRef CAS PubMed.
- L. Shi, M. P. Bucknall, T. L. Young, M. Zhang, L. Hu, J. Bing, D. S. Lee, J. Kim, T. Wu, N. Takamure, D. R. McKenzie, S. Huang, M. A. Green and A. W. Y. Ho-Baillie, Science, 2020, 368, eaba2412 CrossRef CAS PubMed.
- G. Schileo and G. Grancini, J. Phys. Energy, 2020, 2, 021005 CrossRef CAS.
- A. L. Wani, A. Ara and J. A. Usmani, Interdiscip. Toxicol., 2015, 8, 55–64 CrossRef CAS PubMed.
- I. Turkevych, S. Kazaoui, E. Ito, T. Urano, K. Yamada, H. Tomiyasu, H. Yamagishi, M. Kondo and S. Aramaki, ChemSusChem, 2017, 10, 3754–3759 CrossRef CAS PubMed.
- A. Aftab and Md. I. Ahmad, Sol. Energy, 2021, 216, 26–47 CrossRef CAS.
- J. Cao and F. Yan, Energy Environ. Sci., 2021, 14, 1286–1325 RSC.
- R. Lin, K. Xiao, Z. Qin, Q. Han, C. Zhang, M. Wei, M. I. Saidaminov, Y. Gao, J. Xu, M. Xiao, A. Li, J. Zhu, E. H. Sargent and H. Tan, Nat. Energy, 2019, 4, 864–873 CrossRef CAS.
- K. Xiao, R. Lin, Q. Han, Y. Hou, Z. Qin, H. T. Nguyen, J. Wen, M. Wei, V. Yeddu, M. I. Saidaminov, Y. Gao, X. Luo, Y. Wang, H. Gao, C. Zhang, J. Xu, J. Zhu, E. H. Sargent and H. Tan, Nat. Energy, 2020, 5, 870–880 CrossRef CAS.
- R. Lin, J. Xu, M. Wei, Y. Wang, Z. Qin, Z. Liu, J. Wu, K. Xiao, B. Chen, S. M. Park, G. Chen, H. R. Atapattu, K. R. Graham, J. Xu, J. Zhu, L. Li, C. Zhang, E. H. Sargent and H. Tan, Nature, 2022, 603, 73–78 CrossRef CAS PubMed.
- C. Ponti, G. Nasti, D. Di Girolamo, I. Cantone, F. A. Alharthi and A. Abate, Trends Ecol. Evol., 2022, 37, 281–283 CrossRef CAS PubMed.
- J. Li, H.-L. Cao, W.-B. Jiao, Q. Wang, M. Wei, I. Cantone, J. Lü and A. Abate, Nat. Commun., 2020, 11, 310 CrossRef CAS PubMed.
- K. Dedecker and G. Grancini, Adv. Energy Mater., 2020, 10, 2001471 CrossRef CAS.
- Y. G. Yoo, J. Park, H. N. Umh, S. Y. Lee, S. Bae, Y. H. Kim, S. E. Jerng, Y. Kim and J. Yi, J. Ind. Eng. Chem., 2019, 70, 453–461 CrossRef CAS.
- J. Liu, K. Wu, S. Li, T. Song, Y. Han and X. Li, Dalton Trans., 2013, 42, 3854–3859 RSC.
- H. Guo, Z. Zheng, Y. Zhang, H. Lin and Q. Xu, Sens. Actuators, B, 2017, 248, 430–436 CrossRef CAS.
- H. M. Marwani, J. Ahmed and M. M. Rahman, Sensors, 2022, 22, 8976 CrossRef CAS PubMed.
- S. V. Smirnova, D. V. Ilin and I. V. Pletnev, Talanta, 2021, 221, 121485 CrossRef CAS PubMed.
- Y. Song, F. Guo, P. Zeng, J. Liu, Y. Wang and H. Cheng, Anal. Chim. Acta, 2022, 1212, 339935 CrossRef CAS PubMed.
- Y. Yu, S. S. Naik, Y. Oh, J. Theerthagiri, S. J. Lee and M. Y. Choi, J. Hazard. Mater., 2021, 420, 126585 CrossRef CAS PubMed.
- M. Aamir, M. Sher, M. Azad Malik, J. Akhtar and N. Revaprasadu, New J. Chem., 2016, 40, 9719–9724 RSC.
- C. Tsaridou and A. J. Karabelas, Water, 2021, 13, 2918 CrossRef CAS.
- EUR-Lex – 32020L2184 – EN – EUR-Lex, https://eur-lex.europa.eu/eli/dir/2020/2184/oj, (accessed August 11, 2022).
Footnote |
| † Electronic supplementary information (ESI) available. See DOI: https://doi.org/10.1039/d3ma00068k |
| This journal is © The Royal Society of Chemistry 2023 |