
 Open Access Article
 This Open Access Article is licensed under a Creative Commons Attribution-Non Commercial 3.0 Unported Licence
Non-invasive sensing of transepithelial barrier function and tissue differentiation in organs-on-chips using impedance spectroscopy†
Marinke W.
van der Helm‡
a,
Olivier Y. F.
Henry‡
 b,
Amir
Bein
b,
Tiama
Hamkins-Indik
b,
Michael J.
Cronce
b,
William D.
Leineweber
b,
Mathieu
Odijk
a,
Andries D.
van der Meer
c,
Jan C. T.
Eijkel
a,
Donald E.
Ingber
bde,
Albert
van den Berg
a and
Loes I.
Segerink
*a
b,
Amir
Bein
b,
Tiama
Hamkins-Indik
b,
Michael J.
Cronce
b,
William D.
Leineweber
b,
Mathieu
Odijk
a,
Andries D.
van der Meer
c,
Jan C. T.
Eijkel
a,
Donald E.
Ingber
bde,
Albert
van den Berg
a and
Loes I.
Segerink
*a
aBIOS Lab on a Chip group, MESA+ Institute for Nanotechnology, MIRA Institute for Biomedical Technology and Technical Medicine and Max Planck Center for Complex Fluid Dynamics, University of Twente, P. O. Box 217, 7500 AE Enschede, The Netherlands. E-mail: l.i.segerink@utwente.nl
bWyss Institute for Biologically Inspired Engineering at Harvard University, CLSB Bldg. 5th floor, 3 Blackfan Circle, Boston, MA 02115, USA. E-mail: olivier.henry@wyss.harvard.edu
cApplied Stem Cell Technology, MIRA Institute for Biomedical Technology and Technical Medicine, University of Twente, P. O. Box 217, 7500 AE Enschede, The Netherlands
dVascular Biology Program and Department of Surgery, Boston Children's Hospital and Harvard Medical School, Boston, MA 02115, USA
eHarvard John A. Paulson School of Engineering and Applied Sciences, Harvard University, Cambridge, MA 02138, USA
First published on 11th January 2019
Abstract
Here, we describe methods for combining impedance spectroscopy measurements with electrical simulation to reveal transepithelial barrier function and tissue structure of human intestinal epithelium cultured inside an organ-on-chip microfluidic culture device. When performing impedance spectroscopy measurements, electrical simulation enabled normalization of cell layer resistance of epithelium cultured statically in a gut-on-a-chip, which enabled determination of transepithelial electrical resistance (TEER) values that can be compared across device platforms. During culture under dynamic flow, the formation of intestinal villi was accompanied by characteristic changes in impedance spectra both measured experimentally and verified with simulation, and we demonstrate that changes in cell layer capacitance may serve as measures of villi differentiation. This method for combining impedance spectroscopy with simulation can be adapted to better monitor cell layer characteristics within any organ-on-chip in vitro and to enable direct quantitative TEER comparisons between organ-on-chip platforms which should help to advance research on organ function.
Introduction
Organs-on-chips are microfluidic devices in which living cells are cultured and subjected to engineered conditions that replicate key aspects of the microenvironment of a real human organ or tissue.1,2 These in vitro cell culture models are designed to be more physiologically relevant than conventional in vitro models and are therefore expected to be of great value for drug development, disease modelling and precision medicine. Of special interest are barrier-forming tissues, such as intestinal epithelium, lung epithelium and blood–brain barrier endothelium, which are of vital importance for protection and proper functioning of the associated organs.3 Barrier tissues are studied widely for drug delivery applications and understanding their pathological states in relation to various diseases.3 Examples of barrier tissues in organs-on-chips include previously described models of the lung alveolus,4 lung small airway,5 intestinal epithelium6,7 and blood–brain barrier.8,9Generally, epithelial or endothelial layers are cultured on a porous extracellular matrix-coated membrane suspended between two microfluidic channels, representing the luminal and abluminal compartments. Transepithelial or transendothelial electrical resistance (TEER) measurements are a non-invasive and label-free technique that has been used to examine the barrier properties of these types of functional tissues.3,10,11 The ability for fast and continuous measurements stands in contrast to other methods used to assess barrier function that rely on permeability measurements of tracer molecules, which generally require longer protocols and analysis times. However, the information retrieved from commonly conducted single-frequency TEER measurements is limited and often influenced by non-biological parameters.9 In this article, we show that by combining impedance spectroscopy measurements with electrical simulation, it is possible to both carry out TEER measurements that may be compared between devices, and to assess the differentiation state of human intestinal epithelium cultured within an organ-on-chip device.
Impedance spectroscopy has been used to measure the commonly reported electrical resistance of a cell layer, which results from paracellular and transcellular ionic transport, without the need for measuring blanks.11,12 It also has been shown that electrical simulation may be used to normalize the cell layer resistance to TEER in order to enable comparison of barrier measurements between devices.7,10,11,13–15 In addition, these measurements yield the cell layer capacitance, arising from the electrically insulating lipid bilayer membranes separating the extracellular and intracellular conducting media.3,10,12,15,16 As the capacitance is dependent on the total area and the composition of the cell membranes, it can indicate an increase in surface area of the cell layer associated with the appearance of 3D villi-like structures within intestinal epithelium that occurs when cultured under dynamic fluid flow on-chip.12,16 Although impedance spectroscopy has been used previously in organs-on-chips,5,8,9,17–20 this method is the first to exploit the data of the entire frequency domain to assess tissue barrier function and differentiation. The presented methods can be adapted for use with any organ-on-chip device and measurement protocol in order to directly quantify changes in tissue barrier function and tissue differentiation in real-time.
Materials and methods
Chip fabrication
For the four-electrodes configuration, polycarbonate (PC) substrates of 1 mm thickness were first cut to 25 mm by 45 mm with a press cutter and used to form the top and bottom parts of the microfluidic chips. The PC substrates were sonicated in isopropanol for 5 minutes and blow dried in a stream of compressed air. Cleaned substrates were subsequently exposed to an oxygen plasma (20 SCCM, 100 W, 2 min; Diener ATTO low pressure Plasma system) and put in direct contact with a paper shadow mask5 that defined the electrode geometries. Thin metal layers of titanium (3 nm, 0.2 nm s−1), gold (20 nm, 0.1 nm s−1) and titanium (1 nm, 0.2 nm s−1) were sequentially deposited onto the substrates by e-beam evaporation (Denton Vacuum LLC, USA), which resulted in semi-transparent electrodes.The six-electrodes configuration was achieved by standard subtractive metal patterning. PC substrates 1 mm in thickness were cut into 4′′ wafers, cleaned and plasma activated as above and finally coated with titanium (100 nm) and gold (300 nm). The resulting metalized PC wafers were subsequently coated with a 500 nm layer of positive photoresist (Shipley S1805 (Marlborough, USA), 30 s 500 rpm, 60 s 3000 rpm) and baked at 115 °C for 1 minute. The electrode patterns were defined via UV exposure (50 mJ cm−2) through a photomask (Cad/Art Services, USA) bearing the electrode design (CleWin, Phoenix Software, the Netherlands). The exposed photoresist was developed in CD-26 (Shipley, USA) with gentle shaking for 75 seconds, rinsed in water and blow dried in a stream of compressed air. The revealed gold was finally etched by immersing the wafers for 120 seconds in GE-1848 (Transene Company Inc., USA), rinsed with water and the revealed Ti etched in Buffer Oxide Etchant 1![[thin space (1/6-em)]](https://www.rsc.org/images/entities/char_2009.gif) :5 for 90 seconds (Transene Company Inc., USA), thoroughly washed with water and dried in a stream of compressed air. The remaining electrode pattern was finally deprotected from the patterned S1805 by sonication in isopropanol for 10 minutes.
:5 for 90 seconds (Transene Company Inc., USA), thoroughly washed with water and dried in a stream of compressed air. The remaining electrode pattern was finally deprotected from the patterned S1805 by sonication in isopropanol for 10 minutes.
The final organ-on-a-chip consisted of a top channel with a height of 1 mm and a bottom channel of 0.2 mm height. Poly(dimethylsiloxane) (PDMS) channel layers were laser cut from PDMS (Sylgard® 184, Dow Corning Corp., USA) films spin coated onto acrylic discs (1 mm: 2 spin coating cycles at 200 rpm for 60 s – cured at 60 °C; 0.2 mm: 1 spin coating cycle 200 rpm for 120 s – cured at 60 °C). Cured PDMS layers were covered with low-tack tape (3 M, Scotch®Magic tape) prior to laser cutting the desired channel geometries. Bonding of the PDMS layers to the patterned PC substrates were achieved using silane chemistry.5 All parts were first activated in an oxygen plasma (15 SCCM, 100 W, 30 s). PC substrates and PDMS layers were immediately immersed for 20 minutes in aqueous solutions of 1% (v/v) (3-glycidyloxypropyl) trimethoxysilane (Sigma, St. Louis, MO) and 5% (v/v) (3-aminopropyl) triethoxysilane (Sigma, St. Louis, MO) respectively. All parts were subsequently rinsed in double distilled water and dried in a stream of compressed air. PC top and bottom substrates were aligned and pressed against the 1 mm and 0.2 mm thick laser cut PDMS layers respectively and kept in an oven overnight at 60 °C. Finally, the resulting PC/PDMS parts and a permeable PDMS membrane (50 μm thick with 7 μm diameter pores in a hexagonal pattern with 40 μm center-to-center spacing) were activated in an oxygen plasma (15 SCCM, 100 W, 30 s) before being aligned and bonded together as previously described5 to result in the device presented in Fig. 1a–c.
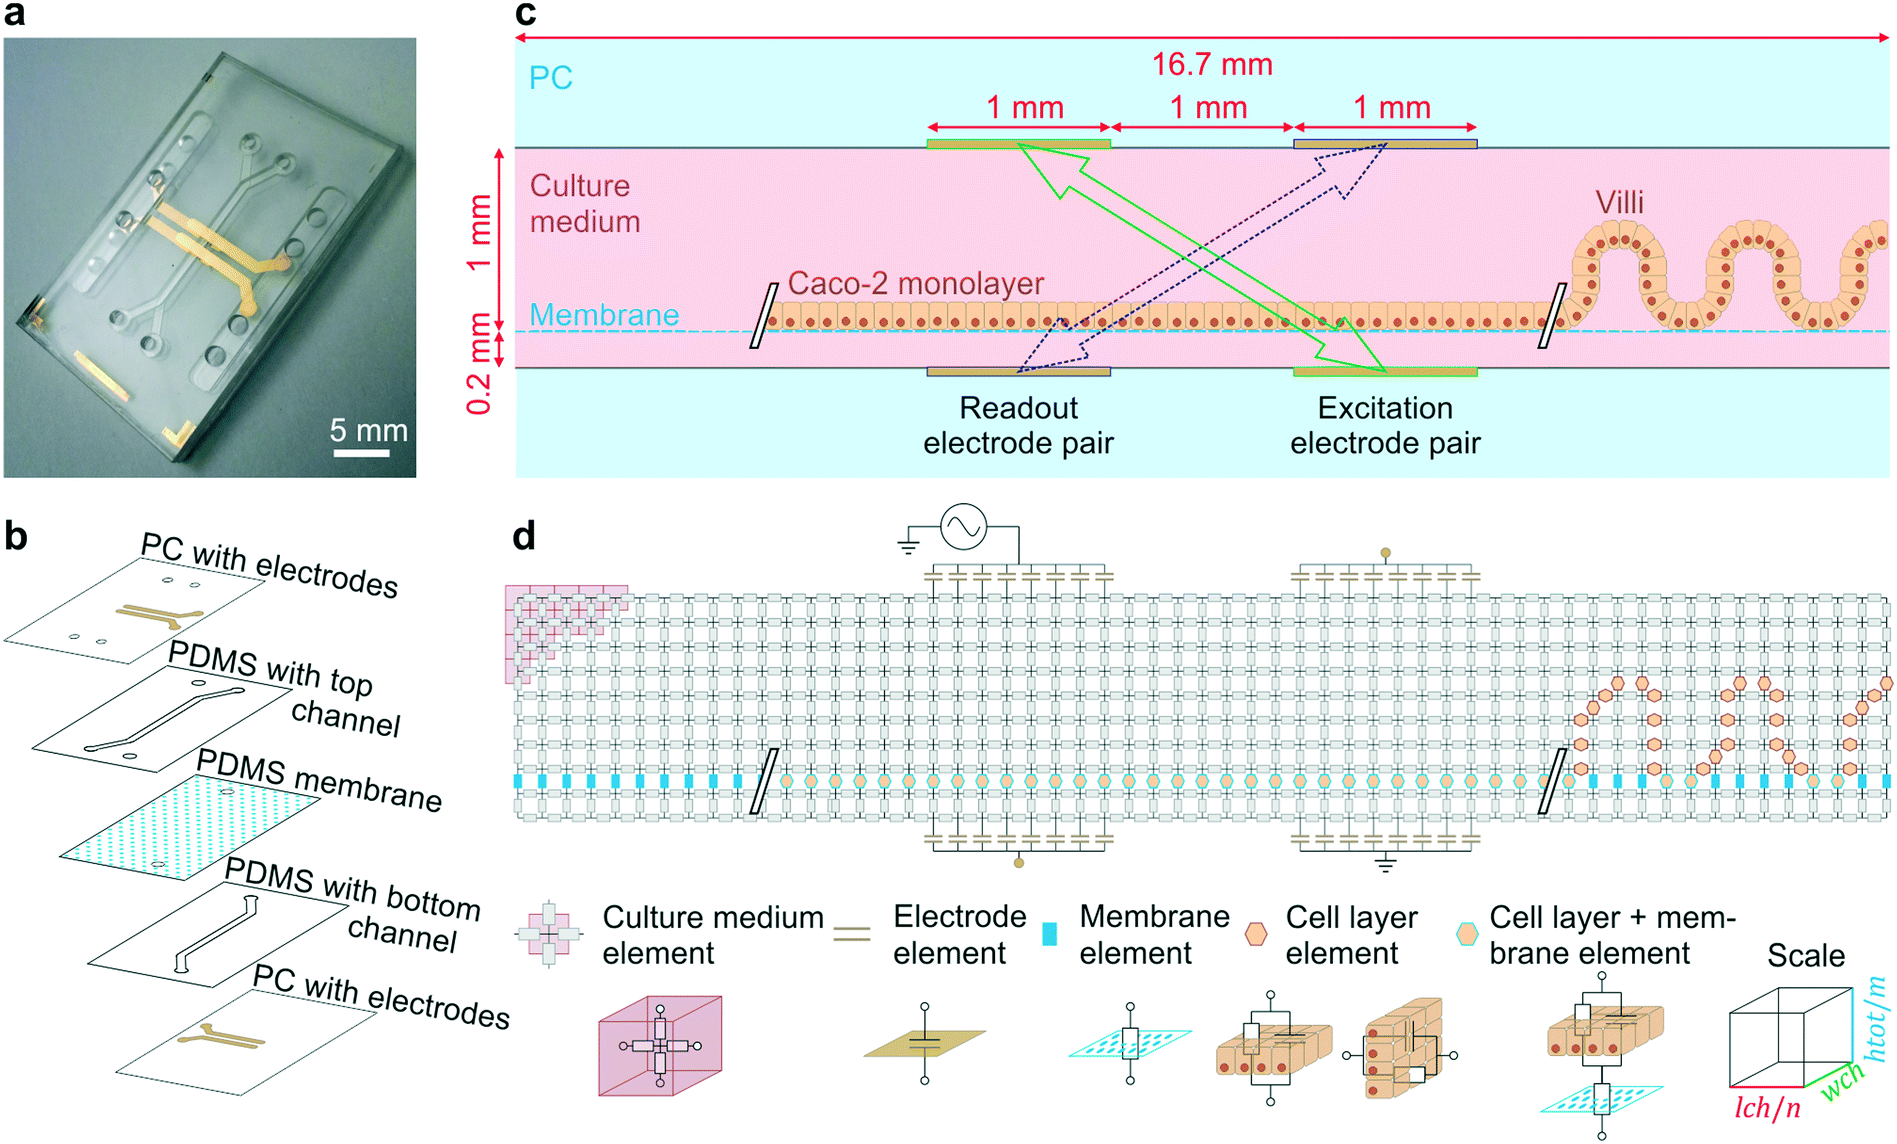 | ||
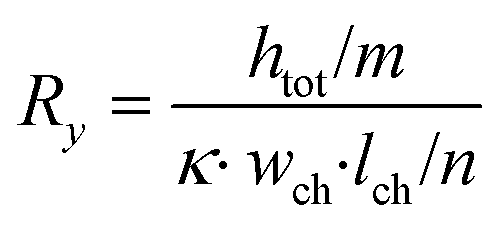
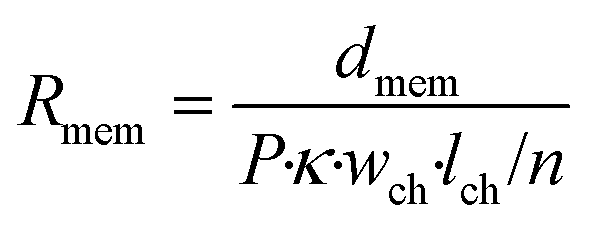
| Fig. 1 Gut-on-a-chip design, operation principles and the equivalent electrical circuit used for simulations. (a) Photograph of the microfluidic gut-on-a-chip device (scalebar is 5 mm) adapted from ref. 5 with permission of The Royal Society of Chemistry. (b) Exploded view of the chip, showing two PDMS parts with laser-cut channels (1 mm wide) separated by a porous PDMS membrane, sandwiched between two PC substrates with integrated semi-transparent gold electrodes. (c) Side view of the main channel showing that the intestinal epithelial cells are cultured on the membrane as a flat monolayer (when cultured statically) or in villus structure (when cultured under flow). During impedance spectroscopy, a current is applied between the excitation electrodes (green, solid arrow) and through the bare membrane, flat monolayer or villi, while the resulting potential difference between the readout electrodes is measured (purple, dashed arrow). (d) Conversion of the side view to an electrical circuit of m by n nodes connected by resistive and/or capacitive elements representing the culture medium, porous membrane, cell layer and electrodes. | ||
The fabrication as reported for the four-electrode chip of Fig. 1a was adapted slightly to fabricate the six-electrode chip of Fig. 5a: the shadow mask determining the electrode geometries was changed as well as the thickness of the top PDMS layer (0.8 mm).
Chip preparation and cell seeding
The human adenocarcinoma cell line Caco-2 (Caco-2 BBE, Harvard Digestive Disease Center) was maintained and passaged in Dulbecco's Modified Eagle Medium (DMEM; Gibco, Grand Island, NY) supplemented with 10% fetal bovine serum (FBS; Gibco), 100 U mL−1 penicillin, and 100 μg mL−1 streptomycin (Gibco). Before seeding Caco-2 cells in the chips, the channels were pre-treated with 1% (v/v) (3-aminopropyl) trimethoxysilane (Sigma, St. Louis, MO) in phosphate-buffered saline (PBS; Gibco), flushed with PBS and ethanol, and then coated with rat-tail collagen type I (30 μg mL−1; Gibco) and Matrigel (100 μg mL−1; BD Biosciences, Bedford, MA). Caco-2 were seeded at a concentration of 2 × 10⁶ cells per mL and were allowed to attach overnight. When chips were cultured statically, medium was refreshed once per day by flushing with a pipette; when chips were cultured under flow, the inlets of both top channel and bottom channel were connected to a syringe pump (Harvard Apparatus, USA) and medium was perfused at 30 μl per hour, resulting in a shear stress of 41 μPa on the gut epithelium.21Impedance spectroscopy measurements
Impedance spectroscopy measurements were carried out daily using an Autolab PGStat12 (Metrohm Autlab B.V., the Netherlands) over a period of 12 days. Electrochemical impedance spectroscopy in galvanostatic mode using a four-terminal setup was used to excite the cell culture with an alternating current (AC) current of 10 μA at 50 frequencies in the range of 100–10 Hz and to record the potential difference between the readout electrodes. Microfluidic chips were transferred one at a time from the incubator onto an aluminum plate kept at 37 °C to reduce the effect of temperature drift during measurement. Measurements were taken immediately after transfer. Only approximately 2 minutes were necessary to acquire a full impedance spectrum thus limiting the potential effect of pH changes in the media on the measurements while exposing the chip to ambient pCO2.A schematic of the measurement is presented in Fig. 1c, in which the excitation and readout electrode pairs are indicated. The excitation electrode in the top PC layer was connected to the counter electrode of the Autolab probe (PGSTAT 128 N, Metrohom Inc, USA) and the bottom excitation electrode to the working electrode. The readout electrodes were connected to the reference electrode (top) and the sensing electrode (bottom).
Confocal microscopy and image analysis
To study villi formation in time, a subset of chips was fixed and stained on day 3, 6, 8, 10 and 12, followed by confocal microscopy. Image processing was performed with Imaris (Bitplane, USA) to convert the confocal Z-stack to reconstructed 3D surfaces and top-view height maps. Statistics were extracted from the reconstructed 3D surfaces using the open source image processing package Fiji. For the staining, the chips were fixed with 4% paraformalydehyde (PFA) for 15 minutes, after which the channels were washed out 3× with 100 μL PBS. Next, 100 μL of Triton X-100 was added to each channel to permeabilize the cells for 10 minutes, then the cells were again washed 3× with PBS. Then, 100 μL staining solution (2 μg mL−1 HCS CellMask™ Stain) was added to each channel for 30 minutes. Finally, the cells were washed 3× and stored in PBS until imaging.Electrical simulations
Model elements
The microfluidic chip is modelled as a 2D electrical network comprised of four types of elements (see Fig. 1d). Firstly, a culture medium element describes the resistance of a confined volume of culture medium inside the microfluidic channel. As current travels in all directions through the medium-filled channels with isotropic resistance, there are nodes where current can enter and exit both on the horizontal and vertical planes of the cubic volume. Its resistance is calculated using the following equations: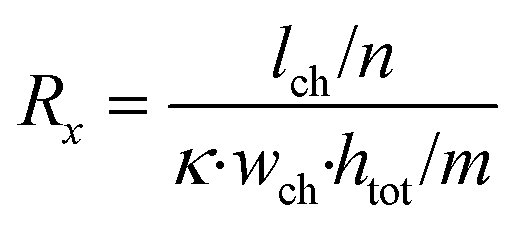 | (1) |
 | (2) |
In these equations, Rx is the total horizontal resistance of a medium element (Ω), Ry is the total vertical resistance of a medium element (Ω), lch is the modelled channel length (m), wch is the channel width (m), htot is the channel height (m), κ is the specific conductivity of culture medium (S m−1), m is the number of nodes along the channel height and n is the number of nodes along the channel length. The values used for these parameters are listed in Table 1.
| Parameter | Value | Description |
|---|---|---|
| w ch | 1 mm | Width of channel |
| h ch,t | 1 mm | Height of top channel |
| h ch,b | 0.2 mm | Height of bottom channel |
| l ch | 16.7 mm | Length of overlapping channels |
| κ | 1.67 S m−1 | Specific conductivity of culture medium7 |
| d mem | 50 μm | Thickness of membrane |
| P | 2.1% | Porosity of membrane |
| C cell | 4 μF cm−2 | Approximated cell membrane capacitance22 |
| C dl | 20 μF cm−2 | Typical value for double layer capacitance at gold electrodes23 |
| l el | 1 mm | Length of the electrodes in the channel |
| d el | 1 mm | Distance between two coplanar electrodes |
| i in | 10 μA | Input current, applied between the excitation electrodes |
| f | 10–100 kHz | Frequency range of applied sinusoidal current |
| TEER | 0–1000 Ω cm2 | Range of possible TEER values of monolayer of Caco-2 cells7 |
Secondly, a membrane element describes the properties of the culture medium inside the pores of a confined piece of the membrane, acting as parallel anisotropic conductors with a vertical orientation. As current can only pass in vertical direction, this element has only two vertically oriented nodes and its resistance can be calculated as follows:
 | (3) |
In this equation, Rmem is the resistance of the piece of membrane (Ω), dmem is the membrane thickness (m) and P is the membrane porosity (%), defined as the ratio between the volume of open space and the total membrane volume. By using the porosity rather than modelling individual pores, we assume that the membrane is uniform. As the volume of this element depends on the membrane thickness instead of on the number of elements m, it may represent a different volume than the culture medium element, giving rise to an adaptive mesh.
Thirdly, the cell layer element is modelled as a circuit of a resistor, representing ionic transport through the cell layer, in parallel with a capacitor, representing the cell membrane capacitance. As we neglect the contribution of longitudinal current through the cell layer, this element has either two vertically or two horizontally oriented nodes and has an anisotropic impedance, depending on the approximated orientation of the cell layer. The impedance of a defined area of the cell layer is:
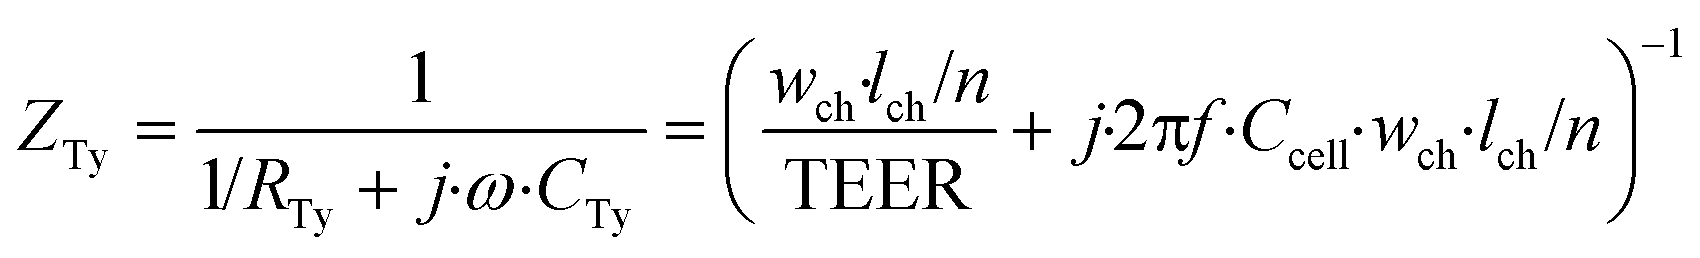 | (4) |
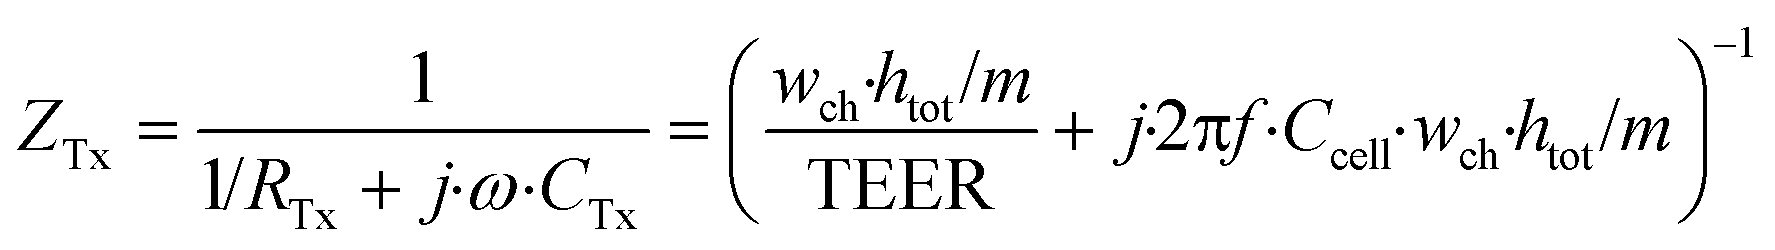 | (5) |
In these equations, ZTy is the impedance of a vertical cell layer element (Ω), RTy is the resistance of the cell layer element (Ω) derived from the input TEER (Ω cm2) divided by the area of the cell layer element (cm2); CTy is the capacitance of the cell layer element (F) derived from the typical cell membrane capacitance Ccell (F cm−2) multiplied by the area of the cell layer element (cm2); j is the imaginary unit ( ), ω = 2πf is the angular frequency of the applied sinusoidal current (rad s−1), which is calculated from the input frequencies f (Hz) of the AC signal applied to the excitation electrodes. The impedance of a horizontal cell layer element, ZTx, is calculated in a similar way. When a cell layer is cultured directly on top of the membrane, their combined impedance is the sum of the cell layer impedance and the membrane resistance in series:
| ZT+mem = ZTy + Rmem |
As the gut epithelium inside microfluidic chips can form villi,6,24 this is also included in the model. This is achieved by replacing the vertical and horizontal culture medium elements that are in the location of the sinusoidally modelled villi with cell layer elements.
Lastly, the electrode element describes the double layer capacitance at the interface of the electrode and culture medium for a specified area. Its impedance is:
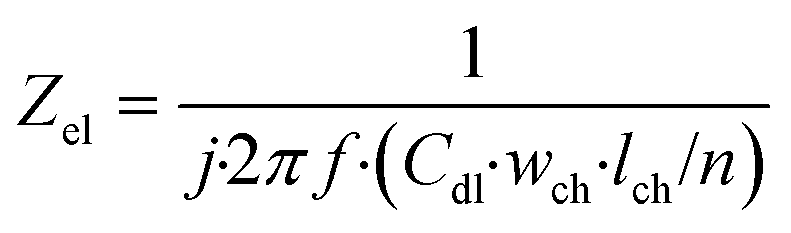 | (7) |
In this equation, Zel is the electrode element impedance (Ω) and Cdl is the typical double layer capacitance of the gold electrode in contact with culture medium (F cm−2).
Simulation of potential and sensitivity distributions
Identically to the experimental setup, an input current is applied to the node corresponding to one of the excitation electrodes while the node of the other excitation electrode is connected to ground. The readout electrode pair can have a floating potential but no current. Then, using Kirchhoff's current law and Ohm's law, a system of linear equations is derived for the network of nodes connected by the model elements described in the previous section. Using this system of equations, the known input current and the impedances of the model elements, the potential in each node is calculated. This method is explained in detail in Theory S1.† Briefly, a matrix of m by n equidistant nodes is formed with the electrical conductance properties of either electrode, culture medium, cell layer or membrane at the corresponding positions in the chip. The applied boundary conditions are identical to the experimentally used input current and frequency. The potential distribution is calculated from the conductance matrix and the applied current following a published method7 optimized for sparse matrices to reduce memory load. The result is a vector containing the potentials in each node, which is visualized to provide insight in the developed electric field inside the chip. Subsequently, using this potential vector and the impedance between the nodes, the current distribution through the cell layer is calculated. This is the current density vector J1 described in Theory S2,† as the area through which current passes is defined by the area of the cell layer element. According to the reciprocity theorem, J2 is obtained by applying the excitation current to the readout electrodes. Using these two current density vectors and the input current iin the sensitivity distribution through the cell layer is calculated. Lastly, it is normalized by multiplying it with the squared number of cell layer elements n. With this sensitivity distribution Sn, insight is provided into the contributions of each part of the cell layer to the total measured resistance. | (8) |
From the potential difference between the readout electrodes, the impedance is calculated analogously to the experimentally measured impedance. This output impedance is checked for convergence as described in Fig. S3† to arrive at a stable solution. The model was designed and implemented in Matlab R2016b (The MathWorks, Inc.).
Simulation of galvanostatic impedance spectroscopy
To mimic impedance spectroscopy measurements in the gut-on-a-chip, the input current magnitude iin and frequency were taken equal to the experimental values (see Table 1). The measured impedance is derived from the simulation by taking the potential difference between the two readout electrodes and dividing it by the input current. After simulation for multiple frequencies, the resulting impedances are collected in an impedance spectrum. The cell layer resistance Rcell is derived from a spectrum by subtracting the minimum impedance magnitude (at 100 kHz) from the maximum impedance magnitude (at 10 Hz) (both Ω):| Rcell = |Zmax| − |Zmin| |
The cell layer capacitance is derived by finding the frequency at which the impedance magnitude is half of the maximum impedance magnitude (logarithmically interpolated). This frequency fRC (Hz) is inversely proportional to the RC time constant τ (s). Thus, the capacitance can be derived by:
 | (10) |
This method for determining the cell layer resistance and capacitance relies on the assumption that the shape of the impedance spectrum corresponds to the equivalent circuit of a resistor and capacitor in parallel (cell layer), in series with another resistor (culture medium and membrane). It is also used for extracting the cell layer resistance and capacitance from experimental data.
Results and discussion
On-chip reconstitution of human intestinal epithelium in a gut-on-a-chip
We began these studies by creating a human gut-on-a-chip using a PDMS microfluidic device with two parallel channels and integrated semi-transparent gold electrodes (Fig. 1a), as previously described.5 Briefly, the integration of electrodes was conveniently realized using direct metal patterning of polycarbonate (PC) substrates via a shadow mask, thereby avoiding cumbersome photolithographic steps typically used in microfabrication. Two PDMS layers (1 mm and 200 μm thickness) with laser-cut channels (1 mm width) were bonded to the two patterned PC substrates using silane chemistry. These two parts were bonded together using oxygen plasma with a porous PDMS membrane (50 μm thick, 7 μm pores), as schematically illustrated in Fig. 1b.The porous membrane separating the two channels was coated with rat-tail collagen type 1 (30 μg mL−1) and Matrigel (100 μg mL−1). Then, human Caco-2 intestinal epithelial cells were cultured on top of the membrane for up to 12 days, either statically (changing the medium once a day) or dynamically under continuous flow (30 μl h−1; corresponding to shear stress of 41 μPa or 4.1 × 10⁻⁴ dyne per cm2 (ref. 21)).6,24 The semi-transparent electrodes comprised of 20 nm thin gold layers allowed inspection of the cells cultured on the membrane on either side of the electrodes when viewed from above (Fig. S1†).
Impedance spectroscopy measurements in the gut-on-a-chip
We then carried out studies in which we recorded impedance spectra daily within gut-on-a-chip devices lined by cultured intestinal epithelial cells. This conveniently enabled the continuous monitoring of cell layer formation and maturation in situ. For these galvanostatic impedance spectroscopy measurements, AC excitation signals were applied between the excitation electrodes at 50 frequencies between 10 Hz and 100 kHz, while the resulting potential differences between the readout electrodes were recorded (Fig. 1c). The impedance spectra of the static and dynamic cultures (Fig. 2a and b) exhibited characteristic forms expected for cell layers based on past studies.10,25 We were then able to derive the cell layer resistance and capacitance directly from these spectra (Fig. 2c and d). Using this approach, we were able to distinguish the contributions of the cell layer to the total measured resistance independently from the contributions of the rest of the chip due to their different resistive behaviour at different frequencies. Importantly, this effectively eliminates the need for measuring blank chips as controls, which offers a major advantage over conventional single-frequency TEER measurements.11,12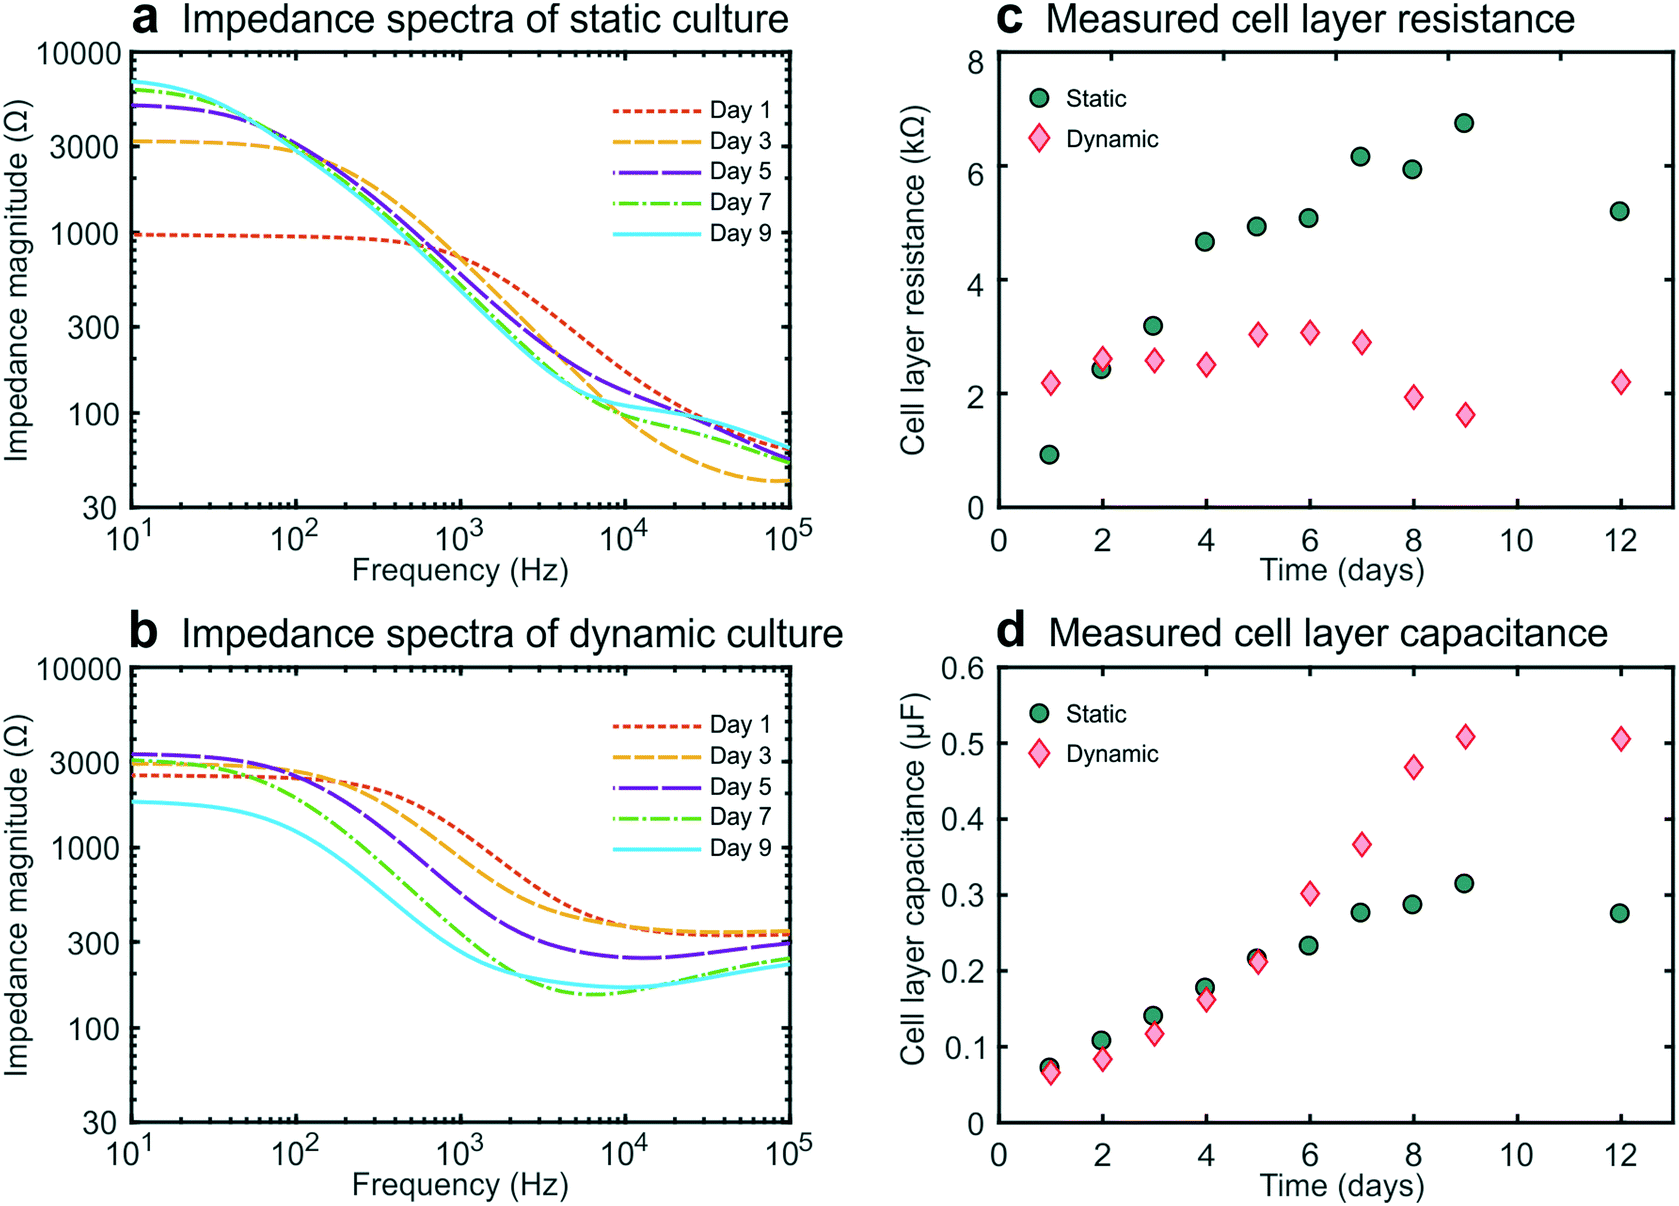 | ||
| Fig. 2 Experimental data obtained during the 12 day culture period of human intestinal epithelial cells inside two microfluidic devices. Impedance spectra showing the development of an intestinal epithelial barrier cultured under static (a) or dynamic flow (b) conditions from day 1 to 9. The negative slopes between 100 Hz and 10 kHz result from the cell layer capacitance, while the plateaus at low frequencies (left, <100 Hz) correspond to the total resistance of the chip and cell layer and the plateaus at high frequencies (right, >10 kHz) correspond to the resistance of the chip alone. (c) Epithelial resistance versus culture time. The resistance of the statically cultured cell layer increased in time up to a plateau, while the resistance of the cell layer cultured under flow decreased after day 7. (d). Epithelial capacitance versus culture time. The capacitance of the static epithelium reached a plateau after day 8, while the capacitance of the epithelium cultured under dynamic flow conditions continued to increase at later times. | ||
Moreover, even though precautions were taken (e.g., to minimize temperature fluctuations), we detected variability in the chip resistance (excluding the contribution of the cell layer) measured within cell-lined devices, as seen in the experimental spectra (around 100 kHz), yet this did not affect our measurement of the cell layer resistance in these devices. This further illustrates the advantage of impedance spectroscopy over single-frequency TEER measurements, where any variability in blank resistance directly influences the determination of the cell layer resistance. Furthermore, the contributions from contacts and lead wires were effectively reduced, and the influence of the double layer capacitance at the electrode-culture medium interface was eliminated by employing a four-terminal measurement approach,3,10,13 which thereby results in measurements that are more sensitive to the electrical properties of the cell layer.26
During static culture, the cell layer resistance increased in time (Fig. 2c) as is expected from tight junction formation and barrier maturation within the planar cell layer. The epithelial capacitance increased up to day 8 and then reached a plateau (Fig. 2d), indicating that the cell layer undergoes minimal net change in terms of total surface area or composition after this time.12,16 In contrast, during dynamic culture under flow, the epithelial resistance did not form a tissue exhibiting an equally high resistance, averaging 3000 ohms at day 6, which compare favourably with TEER measurements reported previously for a fully differentiated human small airway epithelium known to form tight barrier5 and that of human umbilical cord vascular endothelium (approx. 200 ohms) which does not.20 These value are slightly lower than those observed by Kim et al.6 who used a similar microfluidic design but applied higher shear stress as well as cyclic strain to introduce intestinal peristalsis-like motions.
Furthermore, the impedance decreased after day 7 while the cell layer capacitance increased. This coincided with the formation of 3D intestinal villi within the epithelium, as observed by differential interference contrast (DIC) microscopy (Fig. S21). Thus, this characteristic decrease in resistance and increase in capacitance measured using this method provide a way to monitor villus differentiation of the intestinal epithelium non-invasively in real-time (i.e., without the need for microscopy). Note that we assume that the influence of the resistance of the cell-substrate contact27 is negligible for our membrane in combination with the cells used, since we do not have very leaky cell layers.15 However, for some other cell layers in combination with membrane this can play a role and caution needs to be taken when interpreting the TEER results. Although villus differentiation can be monitored with electrical impedance measurements, it is not clear how disease states, drug compound effects or other changes to the cells, will affect the measurements. To investigate the effect of this, additional techniques that employ dyes of varying molecular weights are typically used to assess barrier integrity and might provide additional information on the culture quality and epithelial density.
Electrical simulations of on-chip impedance spectroscopy
We then added electrical simulation protocols to enable us to convert the raw spectroscopy data (Fig. 2) to normalized TEER values that can be compared to measurements previously reported for other culture models. For electrical simulation, the volume inside the chip was divided into small volumes, termed “model elements”, which are electrically connected and have the electrical properties (e.g., resistance or capacitance) of the material they are comprised of. The entire chip is represented by model elements with electrical properties corresponding to culture medium (resistor), electrodes (capacitor3,10), porous membrane (resistor) or cell layer (resistor parallel to capacitor3,10,12,16) (Fig. 1d and Table 1). The chip design allowed for the 3D chip volume to be reduced to a 2D network of horizontally and vertically connected resistors and capacitors to decrease computation time; a network of 2000 by 144 nodes was sufficient to arrive at convergence (Fig. S3†).To model galvanostatic impedance spectroscopy, a system of equations was derived from this electrical network using Kirchhoff's current law and Ohm's law. For boundary conditions analogous to the experimental measurements, an AC excitation current was applied between the excitation electrodes. Following a published method7 (explained in detail in Theory S1†), the system of equations was solved, which resulted in the potential distribution inside the chip as well as the potential difference between the readout electrodes and the associated complex impedance of the modelled chip. By iterating at different AC input current frequencies, simulated impedance spectra were obtained.
Normalizing cell layer resistance to TEER
To model the development of a statically cultured cell layer, a set of electrical simulations with input TEERs increasing from 0 Ω cm2 (no cell layer) to 1000 Ω cm2 (fully developed cell layer) were performed, while keeping all other parameters constant. The resulting impedance spectra (Fig. 3d) resembled the experimental spectra (Fig. 2a) and were characterized by an increase in measured cell layer resistance. By modelling the potential distributions at three different input TEER values and three different frequencies (Fig. 3a), we gained further insight into the measurements. As there are no equipotential planes above and below the cell layer, the potential difference between the readout electrodes is smaller than the potential difference between the excitation electrodes, resulting in an underestimated impedance of the chip. In addition, the potential distribution depends on both the input TEER and frequency, even resulting in changed electrode polarities of the read-out electrodes at low input TEER (top) and high frequency (bottom; see also Fig. S4†), as has been seen before in four-terminal impedance spectroscopy.28 Furthermore, because of these non-uniform potential distributions, the cell layer also contributes non-uniformly to the measured epithelial resistance. This is evident in the normalized sensitivity distributions through the epithelium (Fig. 3b and c), calculated using the current distributions derived from the potential distributions. Past studies have suggested that electrical simulation and modelling (while designing a chip) should be used to generate a uniform current density.11 Electrical simulation has been applied to long microfluidic channels with two electrodes outside of the culture area, and these studies revealed a non-uniform current distribution in the membrane.7 TEER measurements also have been simulated in both Transwell cultures and microfluidic chips with several integrated electrode configurations and a four-terminal measurement setup; the resulting sensitivity distribution has been used to determine the contribution of various parts of the cell culture to the total measured resistance.13 Additionally, both of these models have been used to correct the measured cell layer resistance in order to arrive at a TEER that can be compared across devices.7,13 Here we expanded the use of electrical simulation to visualize the sensitivity distributions for our four-terminal impedance spectroscopy measurements, as well as to both model the influence of villi formation on impedance spectra in the gut-on-a-chip and to assess their effect on the TEER measurements.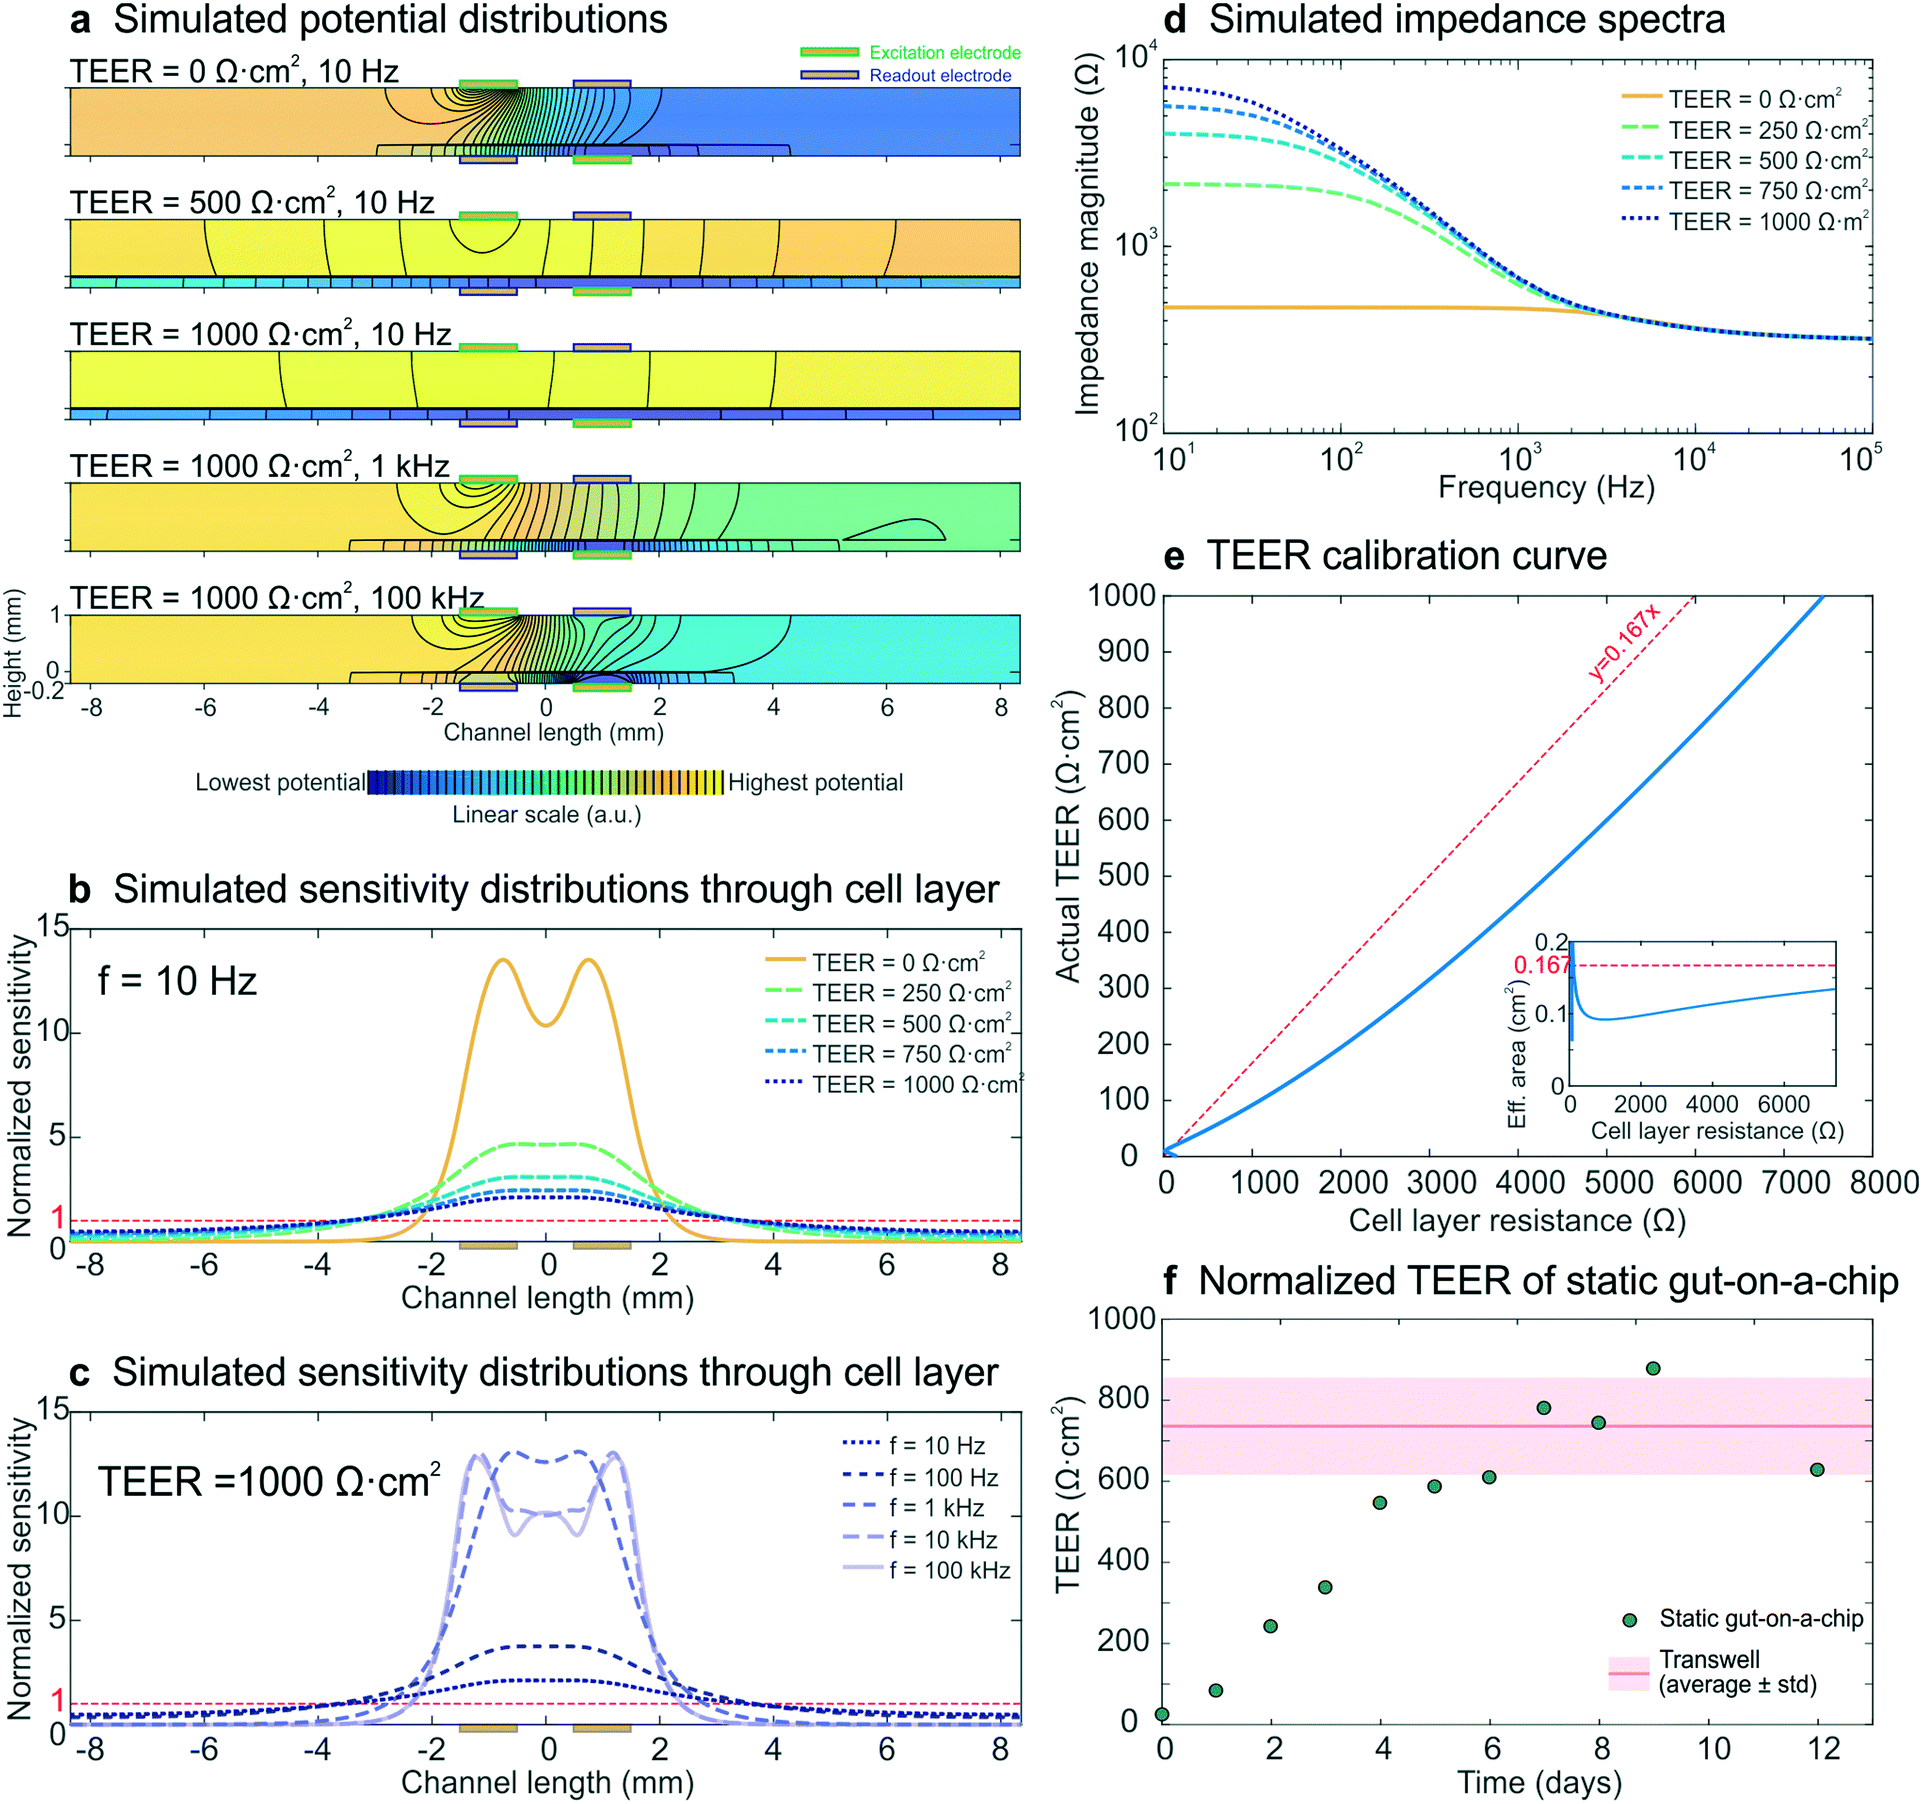 | ||
| Fig. 3 Electrical simulation with increasing input TEER values to model the development of a statically cultured epithelial cell layer. (a) Potential distributions at different input TEER values and frequencies. The colour scale (indicating linearly increasing potential from blue to yellow) and equipotential lines (black) show that there are no equipotential planes above and below the cell layer. In addition, the electrode polarity changes at low TEER and high frequency. (b and c) Sensitivity distributions through the membrane with cell layer at different input TEER values (b) and different frequencies (c), of which none matched with a uniform contribution of the entire cell layer (normalized sensitivity of 1, red dashed lines). (d) Simulated impedance spectra at five input TEER values, which correspond well to the experimental impedance spectra measured with epithelium cultured in the static gut-on-a-chip (Fig. 2a). (e) Calibration curve relating cell layer resistance to actual TEER values; the inset shows the effective area versus cell layer resistance. For easy interpretation, linear guides are added to show the deviation from the case where the effective area is equal to the actual cell layer area (red dashed lines). (f) Experimental epithelial resistance measured over time within the static gut-on-a-chip, normalized to TEER values. The resistance values are in good agreement with the average TEER measured with the same intestinal epithelial cells cultured on static Transwell inserts (Table S11). | ||
Generally, a higher sensitivity indicates that a change in resistivity of the associated model element will affect the total measured resistance more than a change in resistivity of a less sensitively probed model element (Theory S2†).28,29 Especially at low input TEER (Fig. 3b) and high frequency (Fig. 3c) the centre part of the cell layer contributes much more to the measured resistance than the outer parts. This is a result of the resistance of the microchannels approaching the cell layer impedance.7,9 At increasing input TEER and decreasing frequency, the epithelial cell layer impedance becomes more dominant over the microchannel resistance and a larger part of the cell layer contributes to the measured impedance. However, the cell layer is not uniformly probed during impedance spectroscopy measurements in any of the simulated conditions. Thus, it becomes clear that finding the appropriate area to normalize the measured cell layer resistance (Ω) to TEER (Ω cm2) is not trivial, which emphasizes the need for use of electrical simulation to normalize the TEER.7,10,11,13
To enable TEER normalization, the epithelial resistance derived from simulated impedance spectra was plotted against the input TEER, resulting in a calibration curve, with the inset showing the effective area corresponding to the cell layer resistance (Fig. 3e). Using this calibration curve, the experimentally determined resistance values of epithelium cultured within the static gut-on-a-chip were normalized to obtain the TEER values (Fig. 3f). After a week of cell layer maturation, the static on-chip TEER values were in good agreement with TEER values measured in standard Transwells (736 ± 120 Ω cm2; see Table S1†).
Using impedance spectra to detect epithelial differentiation and formation of villi
To determine whether intestinal villi formation within the cultured epithelium can be detected by impedance spectroscopy, we performed electrical simulations with different villi structures, while keeping all other parameters constant and the input TEER at 750 Ω cm2. The crenelated morphology of the intestinal villi formed on-chip was approximated with a sine function with a period and height range corresponding to measurements determined from confocal slices of the epithelium cultured in the gut-on-a-chip under dynamic flow (Fig. S5†). The degree of villi formation was reported as “villi area ratio”, which is defined as the total surface area of the villus epithelium determined by confocal microscopy and computerized morphometry divided by the total surface area of the porous membrane (Fig. 4b inset).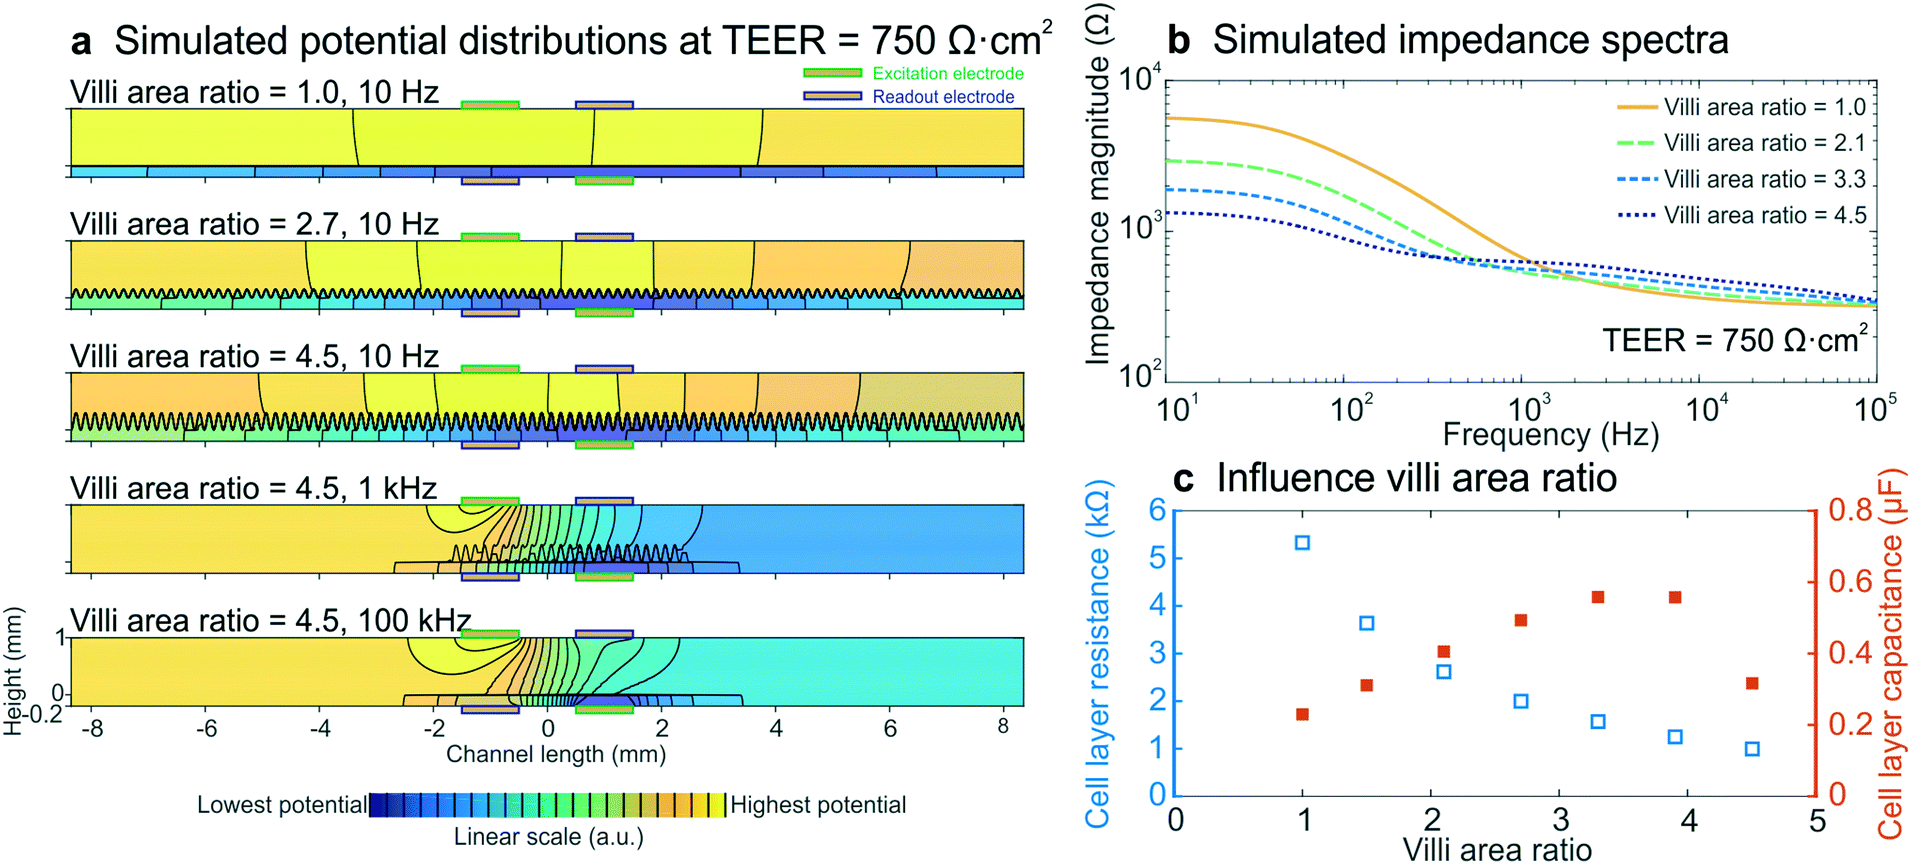 | ||
| Fig. 4 Electrical simulations with increasing villi area ratio to assess the influence of villi formation on impedance spectra. (a) Potential distributions at different villi area ratios and frequencies. The colour scale indicates linearly increasing potential from blue to yellow and equipotential lines (black) show that there are no equipotential planes above and below the cell layer. (b) Simulated impedance spectra at four villi area ratios, which correspond well to the experimental impedance spectra measured in intestinal epithelium cultured under flow within the gut-on-a-chip (Fig. 2b). The inset shows how the villi area ratio is determined. (c) Relation between simulated cell layer resistance (open blue squares) and capacitance (orange squares) and villi area ratio, showing that the experimentally observed decrease in cell layer resistance and increase in capacitance resulted from villi within the intestinal epithelium. | ||
We found that the villi area ratio influenced the potential distribution in the chip, as did altering the TEER and frequency (Fig. 4a). The modelled impedance spectra (Fig. 4b) effectively predicted that villi formation will result in decreased epithelial resistance and increased capacitance (Fig. 4c), as observed in the experimental spectra (Fig. 2b–d). Both the resistance and capacitance depend on the total area of the cell layer: the larger surface area associated with the crenulated villus epithelium results in more parallel resistors and capacitors, and thus in a smaller total resistance and a larger total capacitance. Due to the non-trivial relation between cell layer resistance and capacitance, as well as limitations of sinusoidally modelled villi and 2D simulations, we were not able to quantify the TEER of the villus epithelium. Nevertheless, the increasing capacitance that was seen in the experimental data appears to be a direct result of villi formation, as is evidenced by these simulations.
Cell layer capacitance as indicator of villi differentiation
To illustrate that our method for combining impedance spectroscopy measurements can be adapted to fit any chip design, a six-electrode chip with different channel sizes (0.8 mm top channel height) was used for subsequent experiments (Fig. 5a and b and S6–8†). During a 12 day culture period, impedance spectra were recorded daily (Fig. 5c) and a subset of chips was fixed and stained every 2–3 days. Confocal imaging followed by image analysis (Imaris, Bitplane) was carried out to reconstruct the 3D surface morphology of the intestinal epithelium throughout the culture period (Fig. 5d). The villi area ratio was determined from these reconstructed surfaces (Fig. 4b inset) using the image processing package Fiji30 available for ImageJ where the 3D surface area is used to calculate the total surface area of the villus epithelium divided by the total surface area of the porous membrane. In addition, the cell layer capacitance was derived from the impedance spectra recorded on the last day of culture for each chip.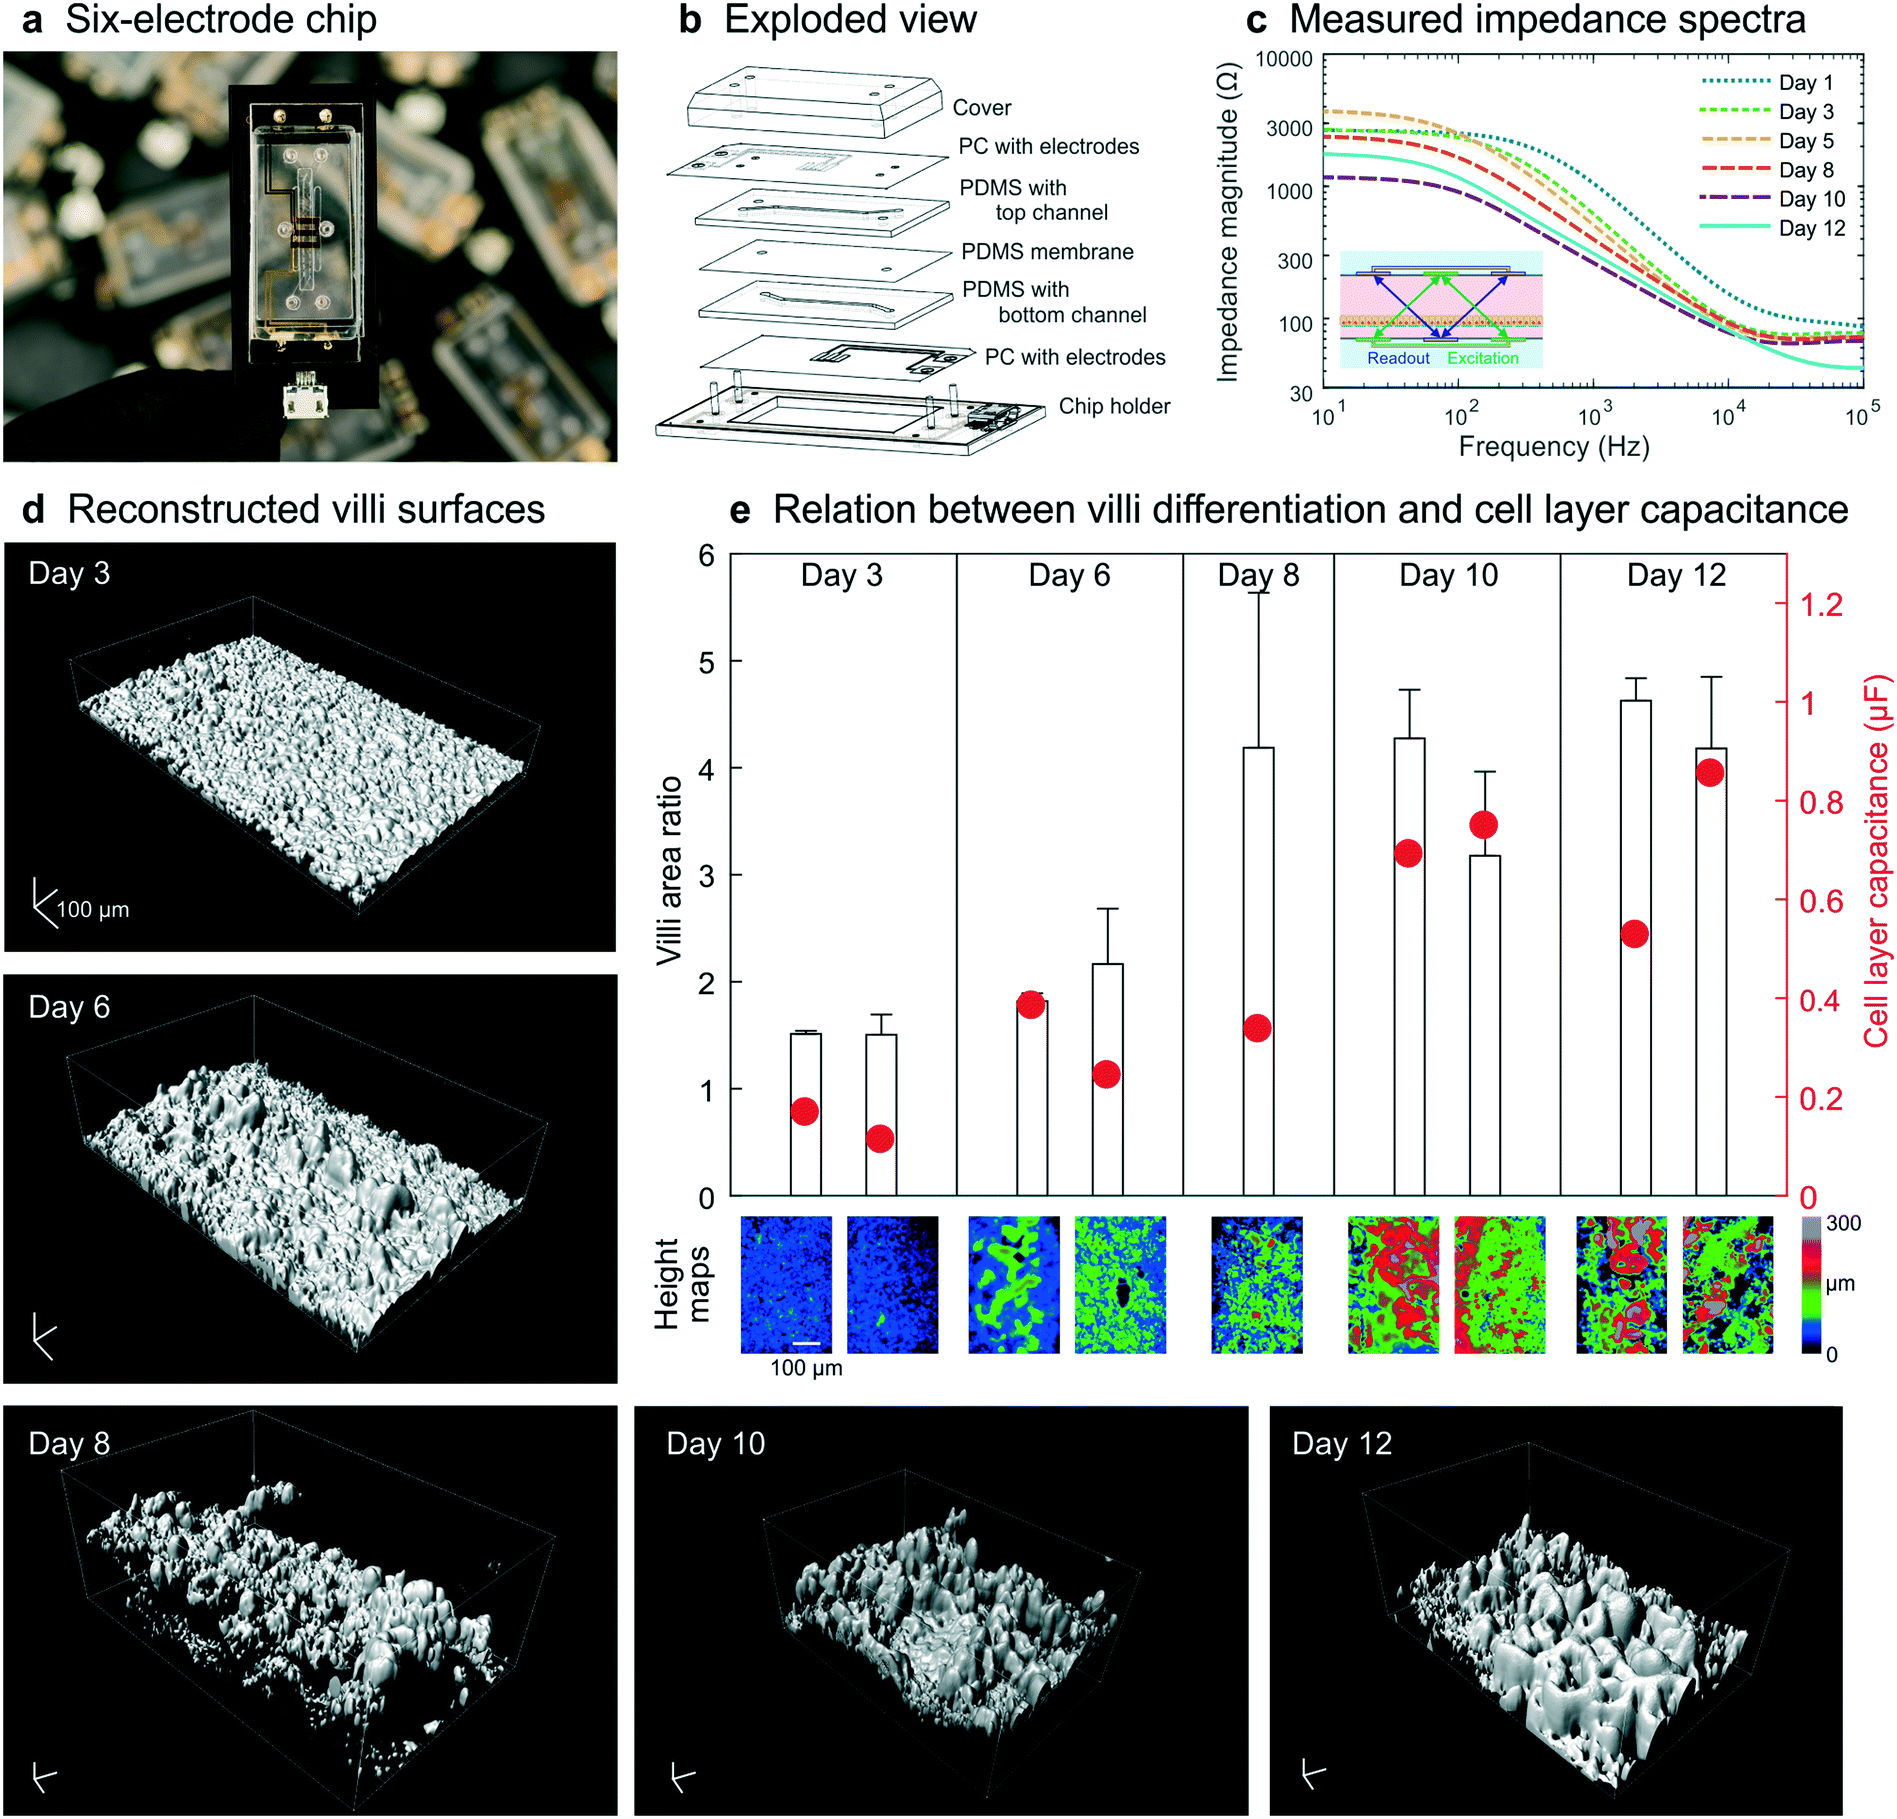 | ||
| Fig. 5 Chip design and experimental data obtained from human Caco-2 intestinal epithelium cultured dynamically inside a 6-electrode device. (a) The 6-electrode gut-on-a-chip device mounted in a chip holder. (b) Exploded view of chip and holder, showing two PDMS parts (200 μm and 800 μm high) with laser-cut channels (1 mm wide) separated by a porous PDMS membrane, sandwiched between two PC substrates with integrated semi-transparent gold electrodes (each 1 mm wide). Electrical interfacing is facilitated with the printed circuit board of the chip holder. (c) Impedance spectra obtained in these dynamically cultured guts-on-chips during the 12 day culture period display similar characteristics as when cultured in the 4-electrode chip (Fig. 2b). Fluid flow is initiated on day 2; the inset shows the 4-terminal electrode configuration used in this study. (d) Morphology of the surfaces of the villus intestinal epithelium cultured on-chip, reconstructed from confocal images of five microfluidic devices fixed on days 3, 6, 8, 10 and 12, showing an increase in number and height of villi over time (scalebar is 100 μm). (e) The measured epithelial capacitance effectively predicted the villi area ratio and hence the degree of villus differentiation, for 9 chips on 5 days (color scale indicates a height map, scale bar is 100 μm). | ||
These studies again revealed that an increase in villi area ratio is accompanied by an increase in capacitance (Fig. 5e). Therefore, we conclude that measurement of cell layer capacitance has the potential to predict the degree of villi differentiation within intestinal epithelium cultured under dynamic flow condition on-chip without the need for microscopy. Note that during villi formation, the shear stress on the cell layer will increase since the height of the channel will decrease. We did not adjust the flow rate during the measurements, but in case the villi height will finally be 300 μm, the shear rate has almost been doubled.
Conclusions
In this study, we have described novel methods for combining impedance spectroscopy with electrical simulation to measure cell layer barrier function and detect changes in villus differentiation within human intestinal epithelium cultured in a gut-on-a-chip. Impedance spectroscopy allowed the immediate and non-invasive determination of epithelial resistance, in addition to eliminating the need for measuring blanks. Use of a four-terminal sensing approach also allowed us to record changes in the electrical properties of the epithelial layer without being influenced by the double layer capacitance at the electrode–electrolyte interface, or by the contact and lead resistances.As was indicated, the sensitivity distribution is used to visualize how much different regions in the chip contribute to the total measured resistance. It proves to be a useful tool to demonstrate which volume elements or parts of the cell layer contribute most to the measured impedance. Electrical simulation enabled normalization of measured cell layer resistance to TEER values by determining the effective area that contributed to that measured resistance. This normalization allows comparison of TEER values between different organ-on-chip devices and across experimental platforms. Furthermore, these simulations provided insight in the influence of intestinal differentiation on impedance spectra, and we showed that capacitance is a promising predictor of the state of villi formation.
We also showed that electrical simulation can be adapted to fit other electrode configurations and channel sizes. It should be possible to adapt this approach for other chip designs, different measurement methods and 3D geometries as well, thus providing a general method for determining barrier function and differentiation status of functional living tissues cultured inside microfluidic devices, which should have broad application in the organs-on-chip field. In addition, this method can help identify the best electrode locations and chip designs to either arrive at uniform electric fields or to achieve local probing of cell layers.28 The method also shows, that it is also better to probe several small areas by integrating multiple electrode pairs in the channel, and thus avoid the inhomogeneities in the potential distribution caused by larger electrodes that cover a longer tissue area. This is comparable to multi-electrode arrays in which a cell layer that is cultured directly on the electrode-integrated substrate can be probed locally.10,20,31
Conflicts of interest
D. E. I. is a founder and holds equity in Emulate Inc., and he chairs its scientific advisory board.Acknowledgements
Funding for this research was provided by: SRO Biomedical Microdevices (L. I. Segerink) and SRO organs-on-chips (A. D. van der Meer), both from MIRA Institute for Biomedical Technology and Technical Medicine, University of Twente, the Netherlands; VESCEL, ERC Advanced Grant to A. van den Berg (Grant no. 669768); this research was sponsored by the Wyss Institute for Biologically Inspired Engineering at Harvard University and the Defense Advanced Research Projects Agency under Cooperative Agreement Number W911NF-12-2-0036. The views and conclusions contained in this document are those of the authors and should not be interpreted as representing the official policies, either expressed or implied, of the Defense Advanced Research Projects Agency, or the U.S. Government. This work was performed in part at the Center for Nanoscale System (CNS), a member of the National Nanotechnology Coordinated Infrastructure Network (NNCI), which is supported by the National Science Foundation under NSF award no. 1541959. CNS is part of Harvard University. The authors gratefully acknowledge Mathijs Bronkhorst for his assistance in the electrical simulations.References
- A. D. Van der Meer and A. Van den Berg, Integr. Biol., 2012, 4, 461–470 CrossRef CAS PubMed.
- S. N. Bhatia and D. E. Ingber, Nat. Biotechnol., 2014, 32, 760–772 CrossRef CAS PubMed.
- R. Thuenauer, E. Rodriguez-Boulan and W. Romer, Analyst, 2014, 139, 3206–3218 RSC.
- D. Huh, B. D. Matthews, A. Mammoto, M. Montoya-Zavala, H. Y. Hsin and D. E. Ingber, Science, 2010, 328, 1662–1668 CrossRef CAS PubMed.
- O. Y. F. Henry, R. Villenave, M. J. Cronce, W. D. Leineweber, M. A. Benz and D. E. Ingber, Lab Chip, 2017, 17, 2264–2271 RSC.
- H. J. Kim, D. Huh, G. A. Hamilton and D. E. Ingber, Lab Chip, 2012, 12, 2165–2174 RSC.
- M. Odijk, A. D. Van der Meer, D. Levner, H. J. Kim, M. W. Van der Helm, L. I. Segerink, J.-P. Frimat, G. A. Hamilton, D. E. Ingber and A. Van den Berg, Lab Chip, 2015, 15, 745–752 RSC.
- L. M. Griep, F. Wolbers, B. De Wagenaar, P. M. Ter Braak, B. B. Weksler, I. A. Romero, P. O. Couraud, I. Vermes, A. D. Van der Meer and A. Van den Berg, Biomed. Microdevices, 2013, 15, 145–150 CrossRef CAS PubMed.
- M. W. Van der Helm, M. Odijk, J.-P. Frimat, A. D. Van der Meer, J. C. T. Eijkel, A. Van den Berg and L. I. Segerink, Biosens. Bioelectron., 2016, 85, 924–929 CrossRef CAS PubMed.
- K. Benson, S. Cramer and H.-J. Galla, Fluids Barriers CNS, 2013, 10, 5 CrossRef PubMed.
- B. Srinivasan, A. R. Kolli, M. B. Esch, H. E. Abaci, M. L. Shuler and J. J. Hickman, J. Lab. Autom., 2015, 20, 107–126 CrossRef CAS PubMed.
- D. Günzel, S. S. Zakrzewski, T. Schmid, M. Pangalos, J. Wiedenhoeft, C. Blasse, C. Ozboda and S. M. Krug, Ann. N. Y. Acad. Sci., 2012, 1257, 142–151 CrossRef PubMed.
- J. Yeste, X. Illa, C. Gutiérrez, M. Solé, A. Guimerà and R. Villa, J. Phys. D: Appl. Phys., 2016, 49, 375401 CrossRef.
- A. Hakvoort, M. Haselbach, J. Wegener, D. Hoheisel and H. J. Galla, J. Neurochem., 1998, 71, 1141–1150 CrossRef CAS PubMed.
- J. Wegener, D. Abrams, W. Willenbrink, H. J. Galla and A. Janshoff, BioTechniques, 2004, 37, 590 CrossRef CAS PubMed , 592-594, 596-597.
- J. Golowasch and F. Nadim, in Encyclopedia of Computational Neuroscience, ed. D. Jaeger and R. Jung, Springer New York, New York, NY, 2015, pp. 555–558 Search PubMed.
- N. J. Douville, Y.-C. Tung, R. Li, J. D. Wang, M. E. H. El-Sayed and S. Takayama, Anal. Chem., 2010, 82, 2505–2511 CrossRef CAS PubMed.
- J. D. Wang, E.-S. Khafagy, K. Khanafer, S. Takayama and M. E. H. El-Sayed, Mol. Pharmaceutics, 2016, 13, 895–906 CrossRef CAS PubMed.
- P. P. Partyka, G. A. Godsey, J. R. Galie, M. C. Kosciuk, N. K. Acharya, R. G. Nagele and P. A. Galie, Biomaterials, 2017, 115, 30–39 CrossRef CAS PubMed.
- B. M. Maoz, A. Herland, O. Y. F. Henry, W. D. Leineweber, M. Yadid, J. Doyle, R. Mannix, V. J. Kujala, E. A. Fitzgerald, K. Kit Parker and D. E. Ingber, Lab Chip, 2017, 2294–2302 RSC.
- Y. Son, Polymer, 2007, 48, 632–637 CrossRef CAS.
- L. Leffers, F. Ebert, M. S. Taleshi, K. A. Francesconi and T. Schwerdtle, Mol. Nutr. Food Res., 2013, 57, 1270–1282 CrossRef CAS PubMed.
- A. J. Bard and L. R. Faulkner, Electrochemical methods: fundamentals and applications, J. Wiley & Sons, 2001 Search PubMed.
- H. J. Kim and D. E. Ingber, Integr. Biol., 2013, 5, 1130–1140 CrossRef CAS PubMed.
- M. W. Van der Helm, M. Odijk, J.-P. Frimat, A. D. Van der Meer, J. C. T. Eijkel, A. Van den Berg and L. I. Segerink, J. Visualized Exp., 2017, e56334 Search PubMed.
- E. Sarró, M. Lecina, A. Fontova, F. Gòdia, R. Bragós and J. J. Cairó, J. Chem. Technol. Biotechnol., 2016, 91(6), 1755–1762 CrossRef.
- C. M. Lo, C. R. Keese and I. Giaever, Exp. Cell Res., 1999, 250, 576–580 CrossRef CAS.
- S. Grimnes and Ø. G. Martinsen, J. Phys. D: Appl. Phys., 2007, 40, 9–14 CrossRef CAS.
- D. B. Geselowitz, IEEE Trans. Biomed. Eng., 1971, 38–41 CAS.
- J. Schindelin, I. Arganda-Carreras, E. Frise, V. Kaynig, M. Longair, T. Pietzsch, S. Preibisch, C. Rueden, S. Saalfeld, B. Schmid, J.-Y. Tinevez, D. J. White, V. Hartenstein, K. Eliceiri, P. Tomancak and A. Cardona, Nat. Methods, 2012, 9, 676 CrossRef CAS.
- I. Giaever and C. R. Keese, Proc. Natl. Acad. Sci. U. S. A., 1991, 88, 7896–7900 CrossRef CAS.
Footnotes |
| † Electronic supplementary information (ESI) available. See DOI: 10.1039/c8lc00129d |
| ‡ These authors contributed equally to this work. |
| This journal is © The Royal Society of Chemistry 2019 |