
 Open Access Article
 This Open Access Article is licensed under a
 Creative Commons Attribution 3.0 Unported Licence
pH-Sensitive N-doped carbon dots–heparin and doxorubicin drug delivery system: preparation and anticancer research†
Ming Zhangab,
Ping Yuanab,
Ninglin Zhou *abc,
Yutian Suab,
Maoni Shaoab and
Cheng Chiab
*abc,
Yutian Suab,
Maoni Shaoab and
Cheng Chiab
aJiangsu Collaborative Innovation Center for Biological Functional Materials, College of Chemistry and Materials Science, Nanjing Normal University, Nanjing, 210023, China
bJiangsu Key Laboratory of Biofunctional Materials, Jiangsu Engineering Research Center for Biomedical Function Materials, Nanjing 210023, China
cNanjing Zhou Ninglin Advanced Materials Technology Company Limited, Nanjing 211505, China. E-mail: zhouninglin@njnu.edu.cn
First published on 30th January 2017
Abstract
In this study, doxorubicin (DOX) hydrochloride as a model drug, N-doped carbon dots as a drug carrier, and heparin as an auxiliary medicine were selected to design and prepare a multi-functional drug delivery system with pH-triggered drug release. The CDs were anchored onto heparin via chemical bonds and DOX was then loaded on CDs–Hep by taking advantage of the electrostatic interactions between DOX and CDs–Hep. The structures of all the intermediates and final products were characterized and confirmed by 1H NMR and FT-IR spectroscopies. The CDs–Hep/DOX drug delivery system exhibited good stability. However, in acidic buffer, Hep and DOX release rate was accelerated and it was pH-responsive. In vitro and in vivo studies confirmed the high biocompatibility and low-toxicity of the CDs. An MTT assay showed that inhibition rate of CDs–Hep/DOX for HeLa, MCF-7 and A549 cells was close to that of DOX, indicating that the prepared drug system has a higher toxicity for tumor cells and can achieve an effective therapeutic effect. This systemic evaluation suggests that the introduction of Hep improves blood compatibility. In addition, the internalization of CDs–Hep/DOX by A549 cells was further confirmed using laser scanning confocal microscopy. As a result, a therapy was achieved due to the incorporation of Hep and DOX.
1. Introduction
Carbon dots (CDs) have attracted extensive attention because of their chemical inertness, biocompatibility, and low-toxicity.1–3 Moreover, they can be used for bioimaging, disease detection, drug delivery, and photovoltaic devices.4,5 CDs with a large number of specific groups have been prepared by hydrothermal synthesis. To further enhance the function of the CDs, CDs were modified to form multifunctional complexes with the biological activity of the macromolecules.6–8Doxorubicin (DOX), as an anticancer drug, is used for the clinical treatment of breast cancer, lung cancer, lymphoma, and other malignant tumors.9–11 DOX breaks the DNA chain for replication, thus preventing the helix from being resealed and thereby stopping the process of replication. However, DOX in anticancer therapy is often limited by its low-therapeutic index, cardiac toxicity, bone marrow suppression, rapid drug resistance, and other side effects.12–15 To reduce the side effects of DOX, some researchers have selected nanocarriers that can increase the bioavailability of a drug, enhance the targeting properties, reduce the side effects of a drug, and enhance the treatment effects.16–18
Tumor patients are often associated with high blood coagulation and blood vessel embolism, and some studies show that the use of heparin significantly improves the survival of patients with cancer and venous thrombosis.19,20 Heparin (Hep), a polysaccharide compound, has a variety of biological activities especially in inhibiting angiogenesis, tumor growth, and metastasis by the inhibition of angiogenic factors.21,22 Synchronously, heparin is easily absorbed by cells and the particles can be localized to specific tissues or organs by the adsorption of corresponding ligands. Heparin has attracted significant attention because it demonstrates a variety of biological activities.23 Researchers have combined heparin in a drug-delivery system for cancer research; however, heparin was not stable in vivo and required frequent administration. Therefore, the study of a sustained release of heparin-containing material is gradually being considered.24–26 In addition, based on the high affinity and internalization of heparin, it can be used as a functional group to provide an effective recognition site for cell membrane adsorption, thereby increasing the cell uptake rate.27,28 According to this, we have designed and prepared a variety of drug delivery systems in which Hep acts as a carrier loaded with DOX.
In this study, DOX hydrochloride as a model drug, carbon dots as a drug carrier, and heparin as an auxiliary medicine were selected to design and prepare a multifunctional drug delivery system with pH-triggered drug release. First, heparin was modified on the surface of CDs, forming a new type of composite carrier CDs–Hep nanoparticles, while maintaining the stability and biological activity of heparin. As a result of the existence of point carbon, the specific surface area of the material was greatly increased, which was beneficial for the loading of more drugs, thereby the synergistic effects of Hep and DOX enhanced the treatment effect and reduced the adverse drug reactions. In the early stage of the experiment, amino-abundant CDs were prepared via hydrothermal polymerization method. The CDs–Hep nanocarriers were then developed and found to have great potential for the pH-triggered drug release at the tumor sites and real-time imaging to monitor the cellular behavior during the cancer treatment. Subsequently, the drug release and in vitro and in vivo antitumor activity were evaluated by the in vitro drug release studies, cellular toxicity tests, and in vivo antitumor activity tests.
2. Results and discussion
Herein, we have designed nanoparticles for cancer treatment from the perspective of fluorescence imaging by conjugating carbon dots, as illustrated in Fig. 1. To prepare the doxorubicin-loaded heparinized nanoparticles, CDs containing amino group were prepared using chitosan as the sole starting material via a simple hydrothermal process at 200 °C for 10 h. Then, the CDs–Hep nanoparticles were synthesized via the formation of an amide group between the CDs and Hep. After this, the CDs–Hep nanoparticles were synthesized via graft copolymerization and self-assembly. The attachment of CDs to heparin involves a covalent bond. The zeta potential of CDs–Hep was −44.3 mV (Fig. S2A†), which indicated that DOX can be loaded onto CDs–Hep by taking advantage of electrostatic interactions between DOX and CDs–Hep (the zeta potential of CDs–Hep/DOX were −10.1 mV). | ||
| Fig. 1 Schematic for the formation of CDs and doxorubicin (DOX)-complexed CDs–Hep/DOX as well as the drug release in response to pH. | ||
The morphology and size of the CDs were studied by transmission electron microscopy (TEM) (Fig. 2A). The TEM image clearly shows that the nanoparticles are spherical in shape with an average size of 2.5 nm and the HRTEM image shows the presence of amorphous carbon. Similarly, the XRD pattern of the CDs shows a broad reflection peak at 2θ = 23° (Fig. 2D), consistent with the HR-TEM image. Although the diffraction peak is broad, the resulting CDs are highly crystalline since the CDs particle size is about 3.8 nm. Based on the Bragg equation (2d![[thin space (1/6-em)]](https://www.rsc.org/images/entities/char_2009.gif) sinθ = nλ), the interlayer spacing distance of the CDs was found to be 0.38 nm, where d was the interlayer spacing distance of the CDs and λ was approximately 0.154 nm. Simultaneously, the size of the CDs was measured by dynamic light scattering (DLS) measurements, which are shown in the inset of Fig. S1B-a,† revealing that the particles have an average size of 8.4 nm. This value is also consistent with the size determined from the TEM images. The size of the CDs–Hep prepared with different quantities of Hep was also monitored by DLS (Fig. S2B-b–e†). The nanoparticles were formed with an average diameter of ca. 112 nm when the input of Hep was 300 mg (Fig. S2B-d†). This size of the CDs–Hep was well within the preferred range of the nanoparticles used for drug delivery. The size of the final product (CDs–Hep/DOX) was ca. 210 nm (Fig. 2C-f). The size stability of CDs–Hep is an important evaluation indicator to see if the material can be used in the drug delivery systems. As shown in the Fig. S2,† the size of CDs–Hep gradually decreased as the pH increased from 9 to 4, indicating the release of Hep at lower pH. Moreover, the temperature effect of CDs–Hep on the size stability was also investigated. It was found that CDs–Hep exhibited good stability even when the applied temperature was 50 °C.
sinθ = nλ), the interlayer spacing distance of the CDs was found to be 0.38 nm, where d was the interlayer spacing distance of the CDs and λ was approximately 0.154 nm. Simultaneously, the size of the CDs was measured by dynamic light scattering (DLS) measurements, which are shown in the inset of Fig. S1B-a,† revealing that the particles have an average size of 8.4 nm. This value is also consistent with the size determined from the TEM images. The size of the CDs–Hep prepared with different quantities of Hep was also monitored by DLS (Fig. S2B-b–e†). The nanoparticles were formed with an average diameter of ca. 112 nm when the input of Hep was 300 mg (Fig. S2B-d†). This size of the CDs–Hep was well within the preferred range of the nanoparticles used for drug delivery. The size of the final product (CDs–Hep/DOX) was ca. 210 nm (Fig. 2C-f). The size stability of CDs–Hep is an important evaluation indicator to see if the material can be used in the drug delivery systems. As shown in the Fig. S2,† the size of CDs–Hep gradually decreased as the pH increased from 9 to 4, indicating the release of Hep at lower pH. Moreover, the temperature effect of CDs–Hep on the size stability was also investigated. It was found that CDs–Hep exhibited good stability even when the applied temperature was 50 °C.
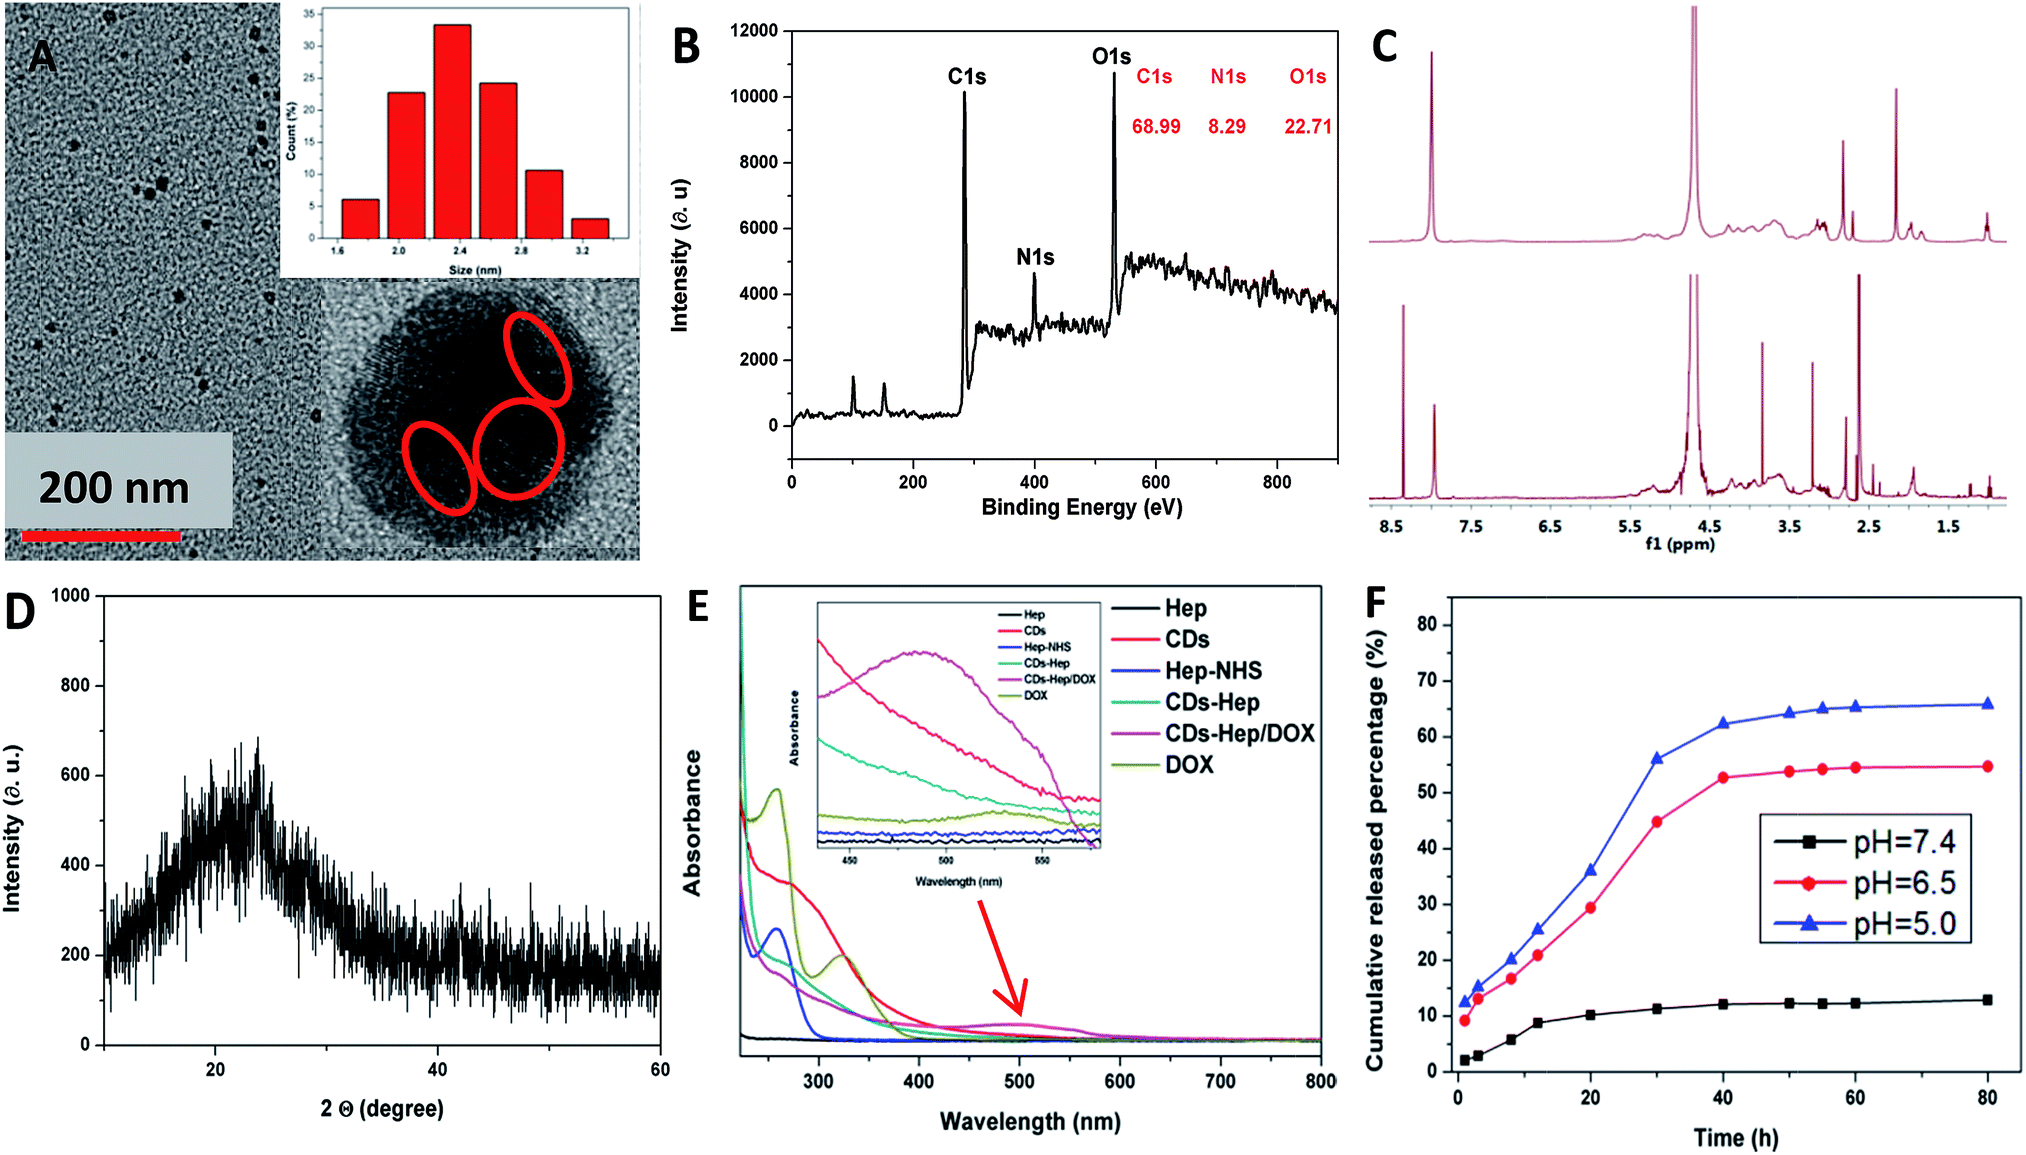 | ||
| Fig. 2 (A) TEM images of the CDs. Inset of (A): the HR-TEM image of the CDs and particle size histograms of the CDs. (B) XPS survey scan. (C) 1H-NMR spectra of Hep–NHS and CDs–Hep. Inset: images of Hep–NHS and CDs–Hep powder. (D) XRD pattern of the CDs. (E) The UV-visible absorption spectra of Hep, CDs, Hep–NHS, CDs–Hep, DOX, and CDs–Hep/DOX. Inset: the magnified absorption spectra in the range between 420 and 580 nm. (F) The release profile of Hep from CDs–Hep/DOX system in different buffer solutions. | ||
As shown in Fig. 2B, the CDs are mainly composed of carbon, oxygen, and nitrogen with the binding energy peaks at 530.44, 398.96, and 530.44 eV corresponding to O 1s, N 1s, and C 1s, respectively. Elemental analysis, as shown in Fig. 2B, indicates that the composition of the CDs was C 68.99, N 8.29, and O 22.71 wt%. The C 1s spectrum of CDs demonstrates five peaks at 284.3, 284.9, 286.2, and 287.32 eV (Fig. S3A†), which are associated with the C 1s states in C![[double bond, length as m-dash]](https://www.rsc.org/images/entities/char_e001.gif) C, C–C, C–N, and CO, respectively. The O 1s spectrum of the CDs, as shown in Fig. S3B,† was deconvoluted into two peaks at 529.02 and 530.22 eV, which are attributed to O–C–O and C–OH/C–O–C, respectively. As shown in Fig. S3C,† the high-resolution spectra of N 1s showed the pyridinic-like N (399.0 eV), pyrrolic-like N (399.8 eV), N–H (401.9 eV), C–N–C (397.8 eV), and N–(C)3 (398.3 eV), respectively. The N 1s peak of chitosan centered at 399.5 eV is associated with the aromatic N and nitrogen in the NH2 state,29 whereas the N 1s peak of the CDs at 398.9 eV is attributed to –NH2 and N on the surface (Fig. S3D†). Fig. S3F† depicts the FTIR of the surface functional groups on NHS, Hep, and Hep–NHS. The absorption at around 1618 cm−1 was attributed to –COO− of Hep. Additionally, when compared with the FTIR spectrum of Hep, the appearance of the peak at 1693 cm−1 was attributed to the formation of an ester group, which indicated that the carboxyl group of Hep reacted with NHS to generate the ester bond. The 1H-NMR spectrum of Hep–NHS also proves the reaction of Hep with NHS; the peaks at δ = 3.2–5.4 ppm were attributed to the Hep sugar ring, as shown in Fig. 2C. Simultaneously, the 1H NMR spectrum of CDs–Hep indicates that Hep successfully grafted onto the surface of the CDs. The color of Hep–NHS remarkably altered from white to yellow after reacting with the CDs (see the inset of Fig. 2C).
C, C–C, C–N, and CO, respectively. The O 1s spectrum of the CDs, as shown in Fig. S3B,† was deconvoluted into two peaks at 529.02 and 530.22 eV, which are attributed to O–C–O and C–OH/C–O–C, respectively. As shown in Fig. S3C,† the high-resolution spectra of N 1s showed the pyridinic-like N (399.0 eV), pyrrolic-like N (399.8 eV), N–H (401.9 eV), C–N–C (397.8 eV), and N–(C)3 (398.3 eV), respectively. The N 1s peak of chitosan centered at 399.5 eV is associated with the aromatic N and nitrogen in the NH2 state,29 whereas the N 1s peak of the CDs at 398.9 eV is attributed to –NH2 and N on the surface (Fig. S3D†). Fig. S3F† depicts the FTIR of the surface functional groups on NHS, Hep, and Hep–NHS. The absorption at around 1618 cm−1 was attributed to –COO− of Hep. Additionally, when compared with the FTIR spectrum of Hep, the appearance of the peak at 1693 cm−1 was attributed to the formation of an ester group, which indicated that the carboxyl group of Hep reacted with NHS to generate the ester bond. The 1H-NMR spectrum of Hep–NHS also proves the reaction of Hep with NHS; the peaks at δ = 3.2–5.4 ppm were attributed to the Hep sugar ring, as shown in Fig. 2C. Simultaneously, the 1H NMR spectrum of CDs–Hep indicates that Hep successfully grafted onto the surface of the CDs. The color of Hep–NHS remarkably altered from white to yellow after reacting with the CDs (see the inset of Fig. 2C).
To study the optical properties of the CDs, CDs–Hep, and CDs–Hep/DOX, the fluorescence spectra were obtained using molecular fluorescence spectrometry (Cary Eclipse, varian, USA), as shown in Fig. S4.† The excitation (λex) and emission (λem) peaks of the CDs and CDs–Hep were located at 365 and 455 nm, and 360 and 450 nm (Fig. S4A and C†), respectively. The CDs and CDs–Hep exhibited typical excitation-dependent fluorescence behavior similar to the result of other study (Fig. S4B and S4D†).29,30 Thus, the CDs and CDs–Hep were able to emit multiple colors. When compared with the fluorescence spectra of free DOX (Fig. S4F†), CDs–Hep/DOX was also confirmed to contain the anticancer drug doxorubicin through fluorescence because the fluorescence spectra of CDs–Hep/DOX exhibits the expected doxorubicin emission at around 575 and 605 nm (Fig. S4E†). The emission patterns obtained from the fluorescence spectra proved that the CDs, Hep, and DOX were bonded together.31 As shown in Fig. S5A,† after irradiation with a 500 W xenon lamp for 60 min, the PL intensity of the CDs could still reserve 88%, whereas the FL intensity of FITC decreased to only 27% of its original value. These results indicate that the CDs prepared in this study have a high resistance to photobleaching. Furthermore, the fluorescence quantum yield (Φ) of the as-prepared CDs was calculated to be 12.8%.
The UV-vis absorption spectra were also obtained to characterize Hep, CDs, Hep–NHS, CDs–Hep, DOX, and CDs–Hep/DOX. As shown in Fig. 2E, when compared with the spectrum of CDs, CDs–Hep clearly displays the absorption peak of the CDs at 280 nm. After binding with DOX, the UV-vis spectra of CDs–Hep/DOX exhibited an obvious absorption peak at 485 and 280 nm, which are attributed to DOX and the CDs. The Fourier transform infrared spectra of DOX and CDs–Hep/DOX are shown in Fig. S5B.† When compared with the spectrum of DOX, the FTIR spectrum of CDs–Hep/DOX exhibited the characteristic peaks of DOX, indicating the abundant interactions between DOX and the adjacent CDs–Hep.32
The release experiment of Hep and DOX from the CDs–Hep/DOX system was performed at pH 5.0, 6.5 and 7.4 (the physiological conditions of tumor cells and normal cells, respectively). Interestingly, the release of Hep and DOX from the CDs–Hep/DOX exhibited similar pH-responsive behavior at both pH 5.0, 6.5 and 7.4, as shown in Fig. 2F and S5C.† At pH 5.0, nearly 6.2% of Hep was released after 200 h, whereas the amount of Hep released at pH 7.4 was about 3.8%, indicating that the release of Hep was attributed to the electrostatic interactions between Hep and CDs, which further indicated that CDs–Hep was stable and controlled. Some studies have proved that Hep and DOX combined treatment enhances apoptosis and collectively inhibits tumor growth.33 Similarly, at pH 5.0, about 65% of DOX was released after 80 h, whereas only ca. 9% was released at pH 7.4 after 80 h, suggesting that DOX can be released at a much faster rate in a more acidic environment than a neutral environment. This result was attributed to the electrostatic interactions of the DOX drug molecules and hydrogen bonding interactions with the carrier CDs–Hep/DOX.34 To further observe the pH-triggered drug release behavior, CDs–Hep/DOX was dialyzed in buffer solution (pH = 6.5) and the fluorescence emission spectra of the release solution were obtained at various intervals (1, 3, 5, 7, 9, 11, and 13 h). As shown in Fig. S5D,† the fluorescent intensity of DOX dramatically increased at pH 6.5, which was consistent with the release of DOX in the acidic medium.
The laser scanning confocal microscopy (LSCM) was used to study the rapid internalization of CDs–Hep and CDs–Hep/DOX using in vitro cells. Fig. 3A-a–c present the bright-field and fluorescent images of HeLa cells incubated without and with CDs–Hep. The HeLa cells labeled with CDs–Hep exhibited bright blue, green, and red fluorescence under blue (403 nm), green (488 nm), and red (543 nm) light excitation, respectively. As shown in Fig. 3B-b, strong green emission was exhibited in the cell membrane and cytoplasm, whereas the cell nuclei were not significantly infiltrated. This observation confirms that the CDs could be internalized by A549 cells and pass through the cytoplasm to enter the cell nuclei. However, after 5 hours of incubation, DOX started to penetrate the cell nuclei (the cells nucleus exhibits red emissions), suggesting that some DOX was released from the CDs–Hep/DOX, as shown in Fig. 3B-c. Moreover, the PL intensity of a single cell incubated in CDs–Hep/DOX was measured using image J software, indicating that the whole cell fluorescence distribution was relatively uniform (Fig. 3E). This phenomenon is in complete agreement with the free DOX intracellular imaging shown in Fig. 3C-a and b and other reports.35 Similarly, with the extension of the incubation time, the fluorescent intensity of the nutrient solution (containing CDs–Hep/DOX) negligibly varied after 9 h (Fig. 3D), suggesting that the CDs were mainly dispersed in the cytoplasmic regions and went in and out of the cell. In contrast, the fluorescent intensity of DOX dramatically reduced, indicating that DOX was released from CDs–Hep and could diffuse to the cell nuclei. These results confirm the pH-triggered release of DOX from the entrapped acidic vesicles (where CDs–Hep are located) to the cytosol and its diffusion to the nucleus, as illustrated in Fig. 4A. Thus, considering the λex-dependent PL behavior of the CDs, it may be a potential candidate for bioimaging, drug delivery vehicle, tracking, and biomedical areas.36
 | ||
| Fig. 3 (A) LSCM images of HeLa cells incubated with CDs–Hep for 3 h observed at (a) 403 nm, (b) 488 nm, and (c) 543 nm, and (d) the merged images, respectively. (B) LSCM images of A549 cells incubated with CDs–Hep/DOX (DOX concentration: 0.10 mg mL−1) for 5 h observed at (a) 403 nm, (b) 488 nm, and (c) 543 nm, and (d) their the merged images, respectively. (C) LSCM images of A549 cells incubated with DOX (0.10 mg mL−1) for 5 h observed under (a) bright field and (b) at 543 nm. Scale bar = 20 μm. (D) The time-dependent fluorescence spectra of a nutrient solution (containing CDs–Hep/DOX) used for the cultured A549 cells at 1, 3, 5, 7, and 9 h. (E) The fluorescence strength of single cells was measured using image J software. | ||
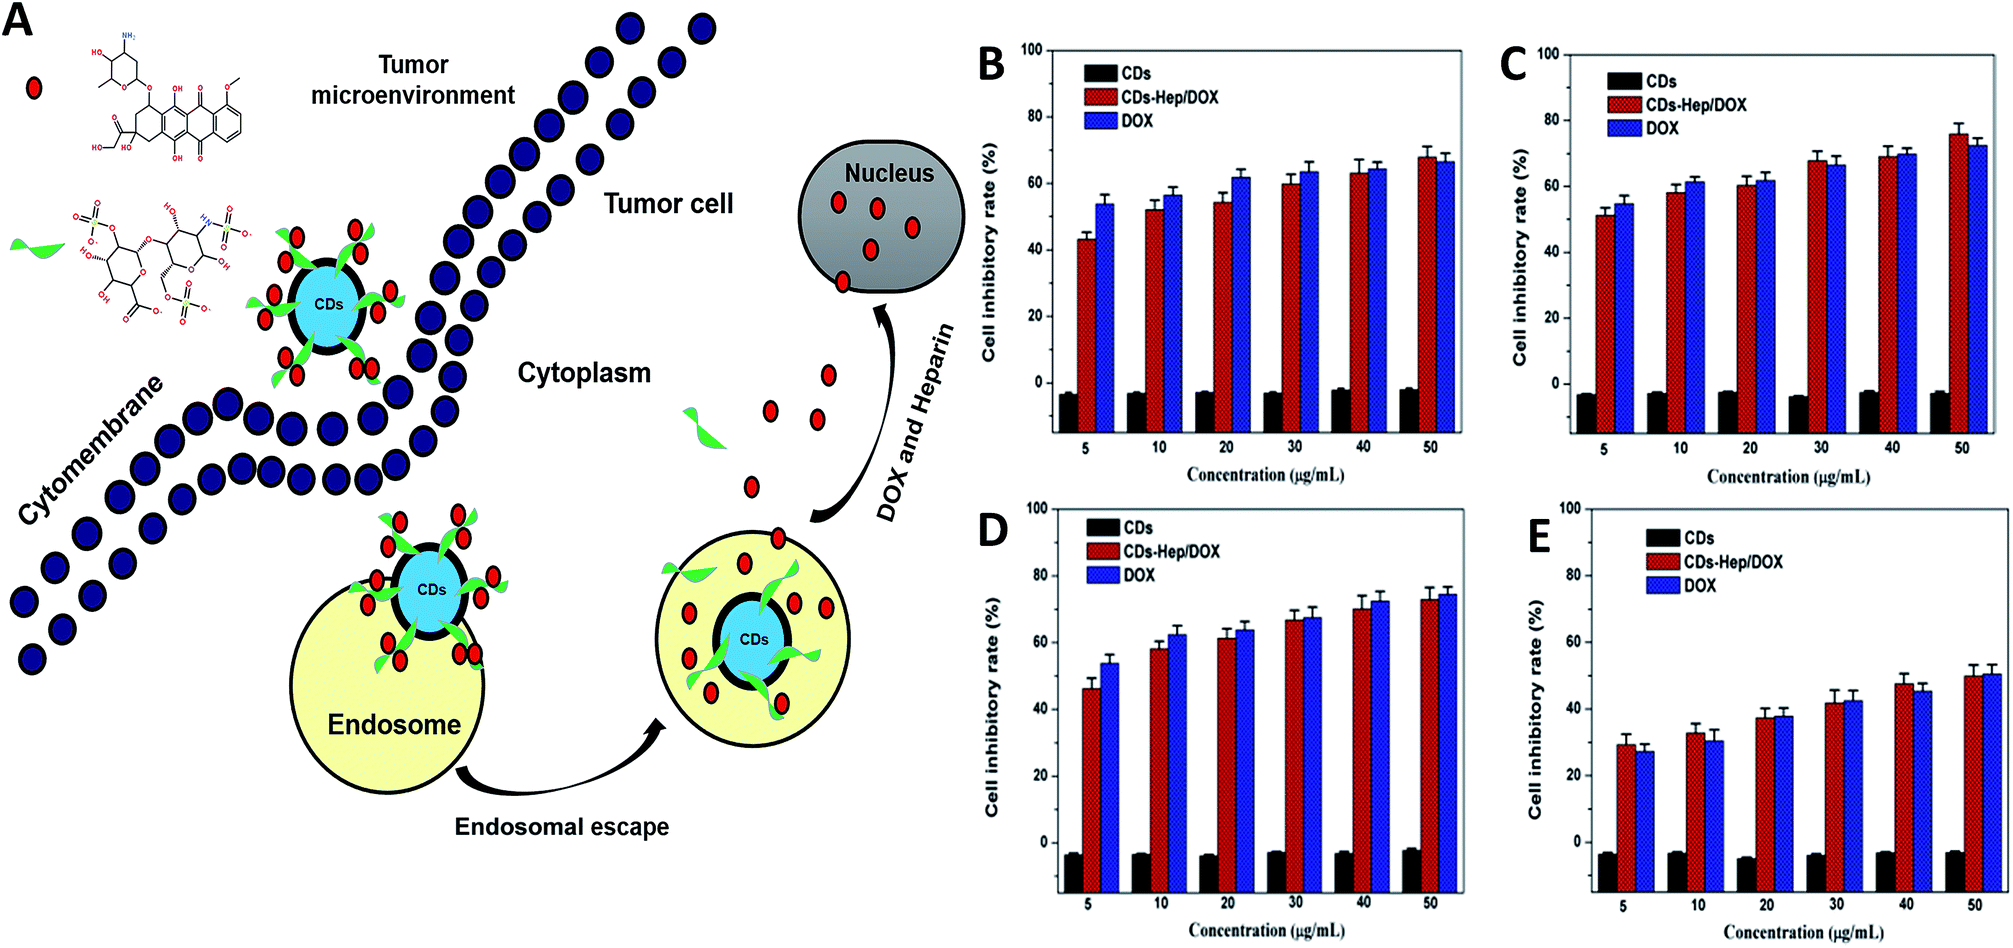 | ||
| Fig. 4 (A) Schematic of the intracellular release behavior of DOX from the CDs–Hep/DOX drug delivery system. The cell inhibitory rate of MCF-7 (B), HeLa (C), A549 (D), and NIH3T3 cells (E) after incubation with CDs and CDs–Hep/DOX or free DOX for 48 h. | ||
The therapeutic efficacy of the CDs–Hep/DOX was studied by quantifying the cell viability of MCF-7, HeLa, and A549 cells using an MTT assay. Fig. 4 shows the MCF-7 (Fig. 4B), HeLa (Fig. 4C), A549 (Fig. 4D), and NIH3T3 cells (Fig. 4F) incubated for 48 h with different doses of CDs, DOX, and CDs–Hep/DOX. After 48 h incubation, no visible reduction in the cell inhibitory rate was observed with the different doses of CDs. However, the cell inhibitory rate increased to below 60% in the presence of 0.01 mg mL−1 free DOX. More importantly, CDs–Hep/DOX was also able to significantly prohibit cancer cell proliferation and the anti-tumor effect was lower than that of DOX, probably because the release of DOX kills the cancer cells. For example, at a concentration of 0.01 mg mL−1, around 46–51% and almost 53–54% of cancer cells die with free DOX and CDs–Hep/DOX treatment, respectively. We also examined the effect of CDs, DOX, and CDs–Hep/DOX on healthy cells. At a similar dosage, there was no significant cell death observed when the cells were irradiated in the presence of the CDs. CDs–Hep/DOX exhibited a lower inhibitive effect on NIH3T3 cells when compared to cancer cells, inferring that DOX-loaded CDs–Hep can efficiently enhance the intracellular drug delivery for a sustained period of time.37 This conclusion was also confirmed by the observation of drug-treated HeLa cells with fluorescein staining. After culturing with Hoechst 33258, experimental groups treated with CDs presented a uniformly distributed and intensive blue fluorescence, which illustrates the stable proliferation of HeLa cells, whereas the fluorescence of those in contact with Hep, DOX, and CDs–Hep was much weaker and fragmentary (Fig. S6†). Simultaneously, with the extension of incubation time, fewer labeled cells could be observed in the CDs–Hep/DOX-treated samples. Together, these results strongly demonstrate that CDs–Hep/DOX can maintain the therapeutic activity of DOX and display long-lasting anti-tumor efficacy.
Hemolysis rate is an important factor for the characterization of blood compatibility. Hemolysis testing was aimed to assess the hemolysis properties of CDs, DOX, CDs–Hep, and CDs–Hep/DOX.38 In addition, as a drug or implanted device, the hemolysis of CDs–Hep/DOX was far below the accepted threshold value of 5%, implying a good hemocompatibility. It can be seen that the hemolysis rate of CDs–Hep/DOX was significantly lower than that of DOX. However, the hemolysis rate of CDs–Hep was about 0.27%, whereas less than 0.09% for the CDs–Hep immobilized samples, as shown in Fig. 5B. In this study, the morphology of the RBCs was demonstrated by the optical images obtained from the negative control (Fig. 5A-a), positive control (Fig. 5A-b), and 0.01 mg mL−1 of CDs–Hep/DOX (Fig. 5A-c). The morphology of the RBCs in the presence of the CDs–Hep/DOX do not show any changes when compared with the negative control and positive control, even at a high concentration (0.01 mg mL−1) of CDs–Hep/DOX. The anticoagulant properties of the DOX drug delivery systems were evaluated by measuring the activated partial thromboplastin time (APTT). The results showed that the anticoagulant properties of both CDs–Hep and CDs–Hep/DOX were reduced, whereas the release solutions of CDs–Hep and CDs–Hep/DOX were significantly reduced (Fig. 5C), which could be attributed to the partial release of Hep from CDs–Hep and CDs–Hep/DOX. The results showed that the prepared drug-delivery system had better safety and could avoid the bleeding caused by carrier during injection; thus, the drug delivery system has the possibility of further application.39
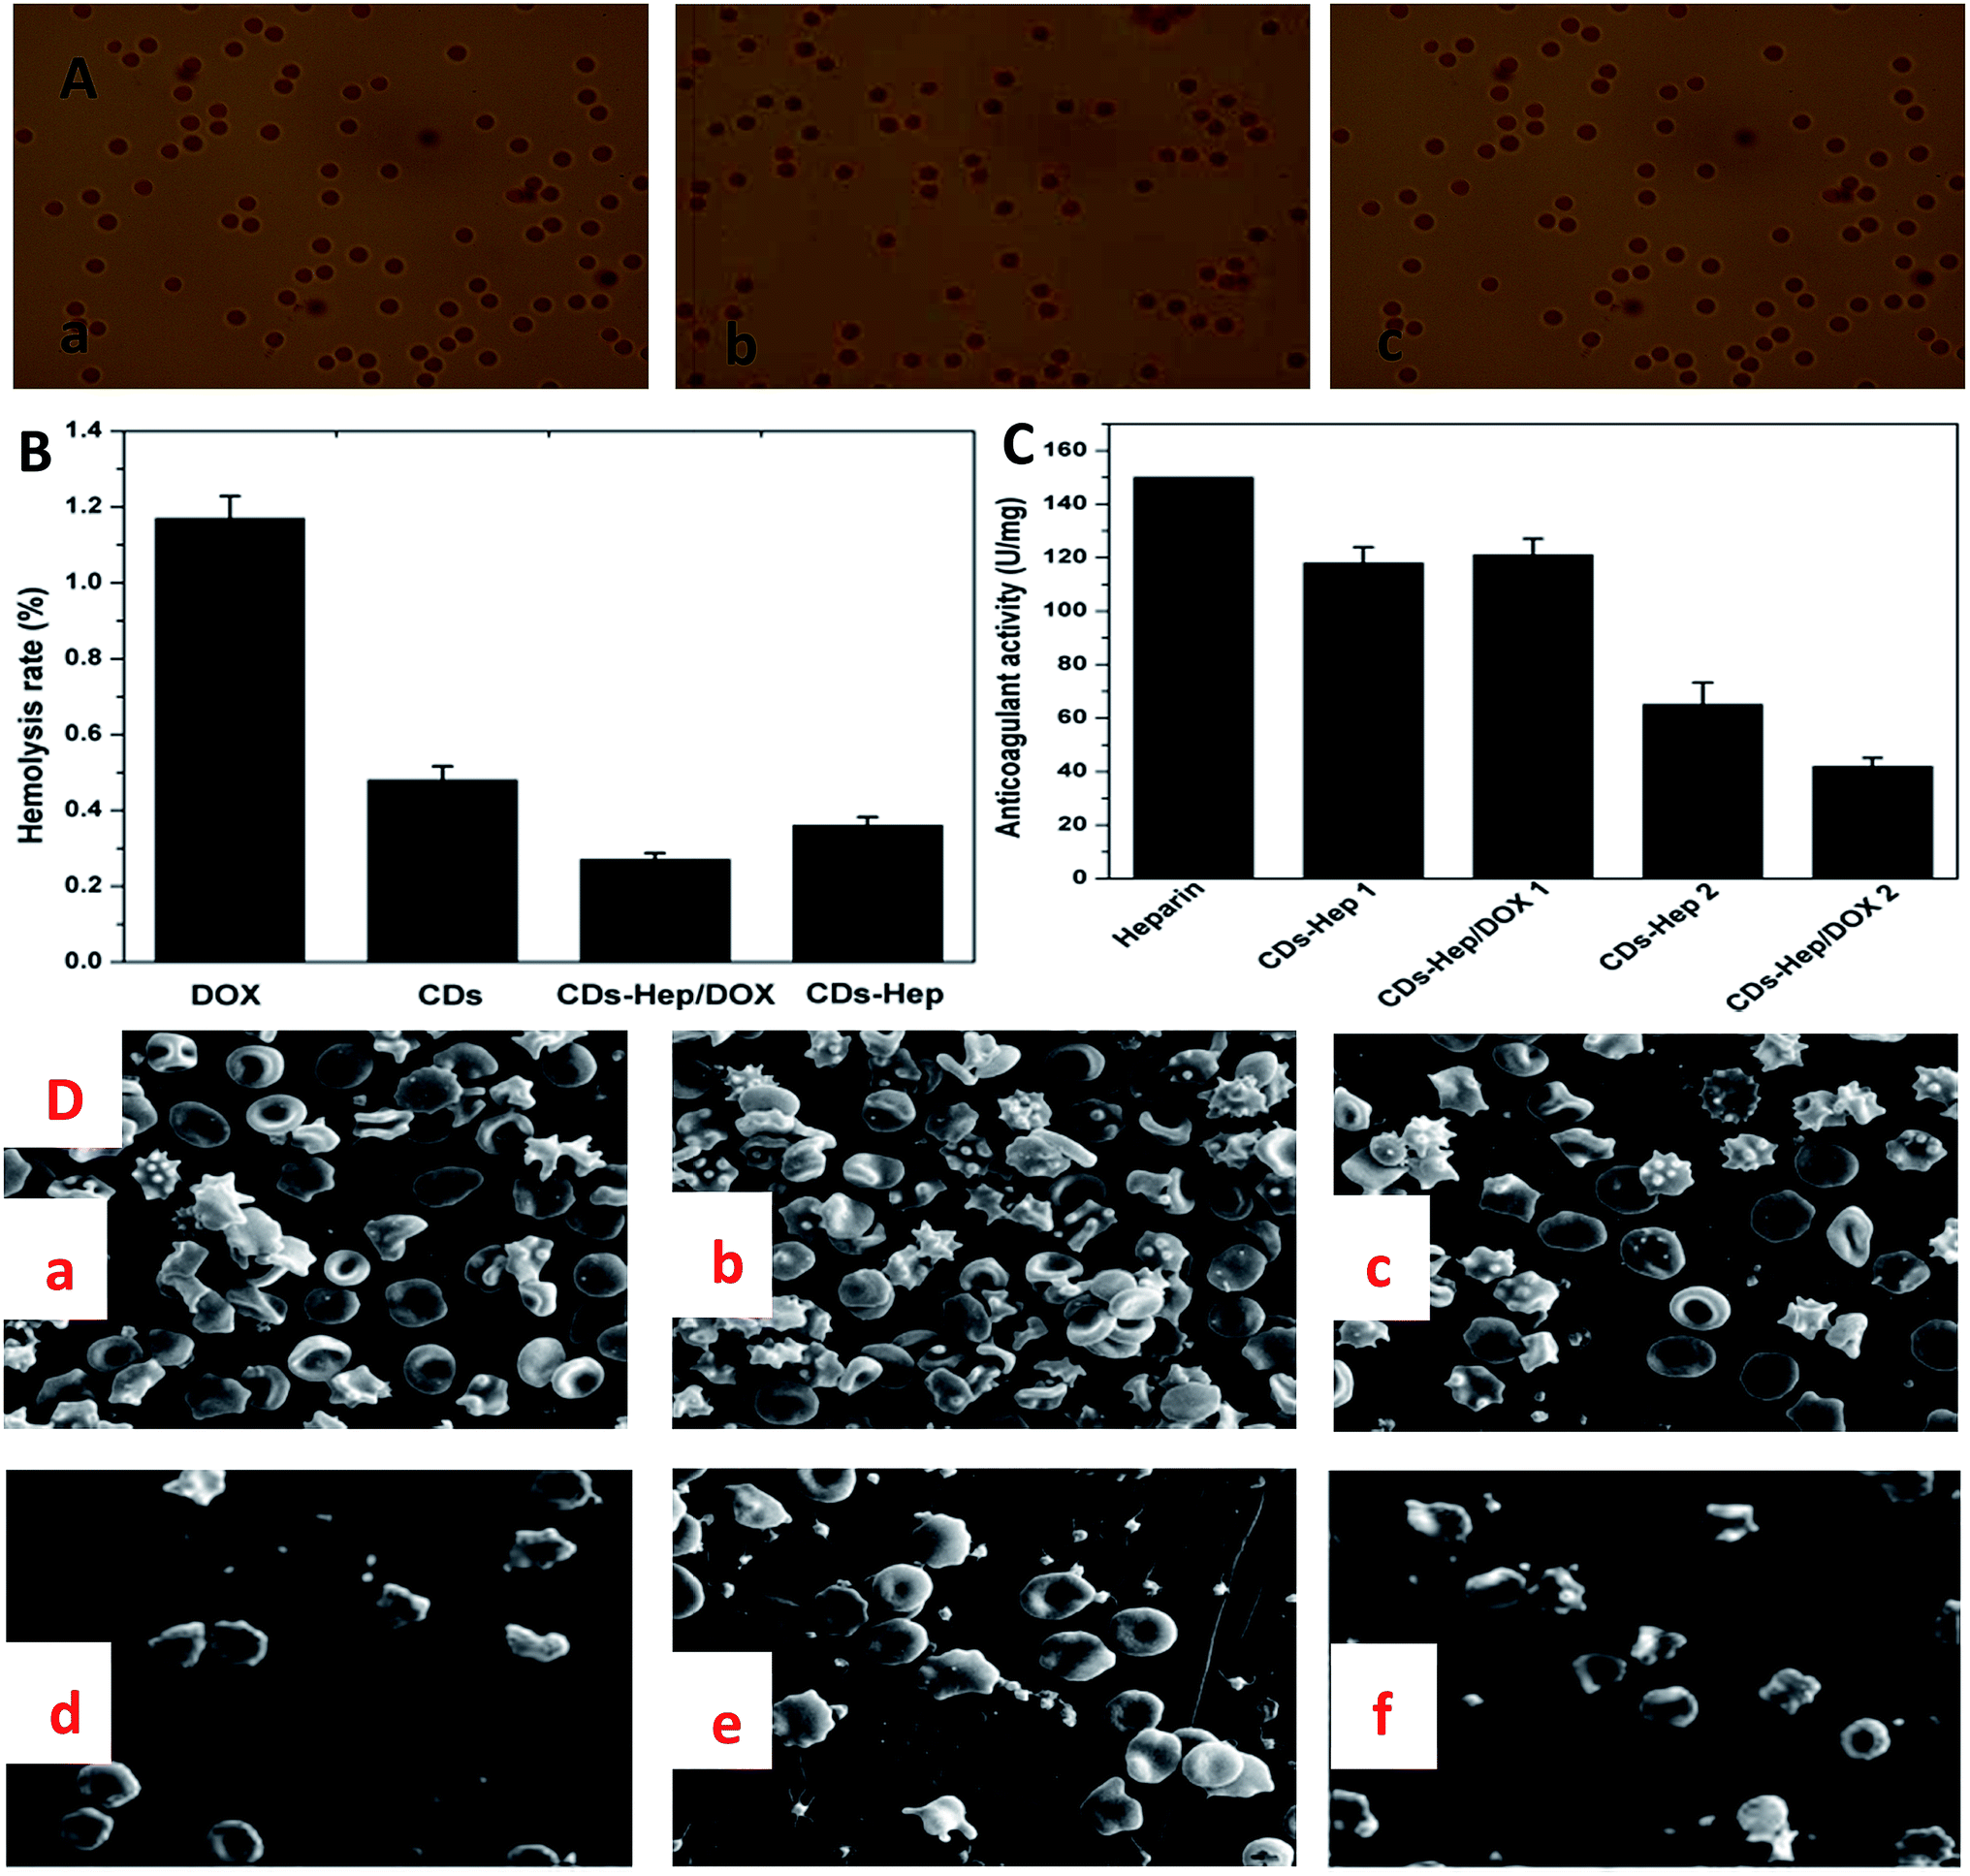 | ||
| Fig. 5 (A) Optical images of the RBCs from the negative control (a), positive control (b), and 100 μg mL−1 of CDs–Hep/DOX (c). (B) The hemolysis rate of DOX, CDs CDs–Hep, and CDs–Hep/DOX. (C) The activated partial thromboplastin time (APTT) of Hep, CDs–Hep 1, CDs–Hep/DOX 1, and the release solution of CDs–Hep 2 and CDs–Hep/DOX 2 (pH = 5). (D) SEM images of human whole blood incubated on pristine PVA (a) and the PVA composite film ((b): DOX, (c): CDs, (d): Hep, (e): CDs–Hep, and (f): CDs–Hep/DOX). | ||
The adhesion of whole blood and platelet (PLT) is one of the important ways to induce the activation of the coagulation process and also one of the main means to check the ability of the material to activate the coagulation process. The number of PLT and blood cells of Hep (Fig. S7D and 5D-d†), CDs–Hep (Fig. S7E and 5D-e†), and CDs–Hep/DOX (Fig. S7F and 5D-f†) composite membranes were significantly decreased when compared with those of the unmodified PVA membrane (Fig. S7A and 5D-a†), DOX (Fig. S7B and 5D-b†), and CDs (Fig. S7C and 5D-c†). Specifically, the morphology of the platelet and blood cells in CDs–Hep/DOX did not change, which indicates that a partial amount of heparin in CDs–Hep/DOX was released from the membrane.
Biomaterial-RBC/PLT interactions have been reported to be mediated by the electrostatic attraction between the positively charged biomaterials and the negative RBC and PLT surface, and hydrophobic interactions between the hydrophobic structures of biomaterials and the RBC lipid layer, H bonds, and van der Waals' forces, etc.40 An electrostatic attraction between the CDs–Hep/DOX and the RBC surface seems impossible in view of the negative zeta potential of CDs–Hep/DOX, as abovementioned. Instead, hydrophobic interaction forces are more likely to mediate the interaction between CDs–Hep/DOX and RBC surface. The CDs–Hep/DOX could be adsorbed onto the RBC and PLT surfaces by means of the hydrophobic interactions of their hydrophobic structures with the RBC and PLT lipid bilayer, further affecting the morphology and integrity of the RBC and PLT structure. Thus, these findings provide important information to circumvent the potential risks and promote the clinical applications of CDs–Hep/DOX.
Imaging and tissue distribution studies of the CDs in a plant model may be useful to test their in vivo biomedical applications. To research the effect of different doses of the CDs on embryonic development, we exposed the spider plant to various concentrations of CDs and carefully monitored the vital developmental stages. Different concentrations of CDs (0, 0.1, 0.3, 0.5, 1, 3, and 5.0 mg mL−1) were cultivated with an early stage spider plant and the biocompatibility was detected with a UV lamp (365 nm). The results suggest that the CDs did not have any significant adverse effects on the root development up to 5 mg mL−1. Similarly, no significant effect on the development of the spider plants treated with different concentration of CDs (Fig. 6B) was exhibited with up to 5.0 mg mL−1, revealing that the CDs can permeate throughout the plant cells but are non-toxic and did not hinder the plant growth.41
 | ||
| Fig. 6 (A) Optical images of the different developmental stages of a spider plant cultured in water containing different concentrations of CDs (a, c–f) and CDs–Hep (b) (5.0 mg mL−1) under UV lamp illumination with excitation at 365 nm. (B) Optical images of the different developmental stages of spider plant raised in an aqueous solution of the CDs (0, 0.1, 0.3, 0.5, 1, 3, and 5.0 mg mL−1). | ||
The excellent optical in vitro imaging and biocompatibility properties of the CDs confirmed that they are a compatible platform for in vivo imaging and tissue distribution.42 The spider plant was selected as a veritable model to evaluate the in vivo imaging and tissue distribution of the CDs. Fig. 6A and C display the images of the entire body of the spider plant before and after exposure to a CDs solution (0, 0.1, 0.3, 0.5, 1, 3, and 5.0 mg mL−1) for 7 days and 15 days, respectively. As shown in Fig. 6B and C, the spider plant without CDs exposure emitted a very weak fluorescence signal, which indicated that the spider plants have weak autofluorescence. In contrast, the spider plant exposed to CDs had a bright emission throughout the body. Thus, an adequate amount of the CDs had entered the spider plant and were distributed into various locations; the spider plants probably absorb the nanomaterial through their epidermis. More significantly, the leaf, root, and stem were the brightest parts of the spider plant. This indicates that the CDs can enter the spider plant through absorption at the root and stem. The nanoscale and high-water solubility of the CDs make them absorbable and the CDs were easily distributed into the spider plant tissues.
Similarly, we further tested the toxicity and feasibility of CDs–Hep as a drug carrier in biomedical applications. First, some selected spider plants were raised in an aqueous solution of CDs–Hep (5.0 mg mL−1) for 7 days. Then, spider plants were raised in water for 7 days. Under UV irradiation, spider plant grown in the CDs–Hep solution exhibited a strong characteristic blue luminescence (Fig. 6B-b), illustrating that the CDs–Hep can permeate throughout the plant cells but were non-toxic and did not hinder the plant growth. The spider plant grown in water, however, exhibited a weak blue luminescence, revealing that CDs–Hep can also enter the spider plant through absorption at the root and stem.
3. Conclusions
In this study, water-soluble carbon dots conjugated with anticoagulant heparin and the anticancer agent DOX were developed to deliver DOX with higher efficiency and they effectively prevented blood clotting. UV-vis, fluorescence, 1H-NMR, and FTIR spectroscopy supported the successful attachment of heparin and DOX to the CDs. The surface amino groups provided the CDs with an extraordinarily high-drug loading capacity (28.45 wt%) for Hep. In addition, the surface of CDs–Hep has a number of negative charges, which enabled the adsorption of DOX without any further modification (with a loading rate of 32.2%). Moreover, heparin and DOX could be released under acidic intracellular conditions due to the electrostatic interactions. MTT assessment proves that DOX in combination with CDs–Hep was effective in inhibiting the proliferation of cancer cells. Simultaneously, the introduction of Hep improved the blood compatibility. Thus, the adverse drug reaction effects of Hep and DOX were reduced and the CDs could have significant implications in anti-cancer drug delivery for the image-guided cancer therapy. These results provide valuable information for the clinical application of CDs–Hep/DOX.Acknowledgements
This project was supported by the Jiangsu Six Category Outstanding Talent (2012-NY-031), the Jiangsu Province Science and Technology Support Plan (BE2014327, BE2015367), the Jiangsu Agriculture Science and Technology Innovation Fund CX (15) 1016, JHB05-21 and Nanjing-321, and the Priority Academic Program Development of Jiangsu Higher Education Institutions (PAPD).References
- X. T. Zheng, A. Ananthanarayanan and K. Q. Luo, et al., Glowing graphene quantum dots and carbon dots: properties, syntheses, and biological applications, Small, 2015, 11(14), 1620–1636 CrossRef CAS PubMed.
- S. Zhu, Y. Song and X. Zhao, et al., The photoluminescence mechanism in carbon dots (graphene quantum dots, carbon nanodots, and polymer dots): current state and future perspective, Nano Res., 2015, 8(2), 355–381 CrossRef CAS.
- J. B. Essner, C. H. Laber and S. Ravula, et al., Pee-dots: biocompatible fluorescent carbon dots derived from the upcycling of urine, Green Chem., 2016, 18(1), 243–250 RSC.
- X. Jin, X. Sun and G. Chen, et al., pH-sensitive carbon dots for the visualization of regulation of intracellular pH inside living pathogenic fungal cells, Carbon, 2015, 81, 388–395 CrossRef CAS.
- J. Xu, Y. Zhou and G. Cheng, et al., Carbon dots as a luminescence sensor for ultrasensitive detection of phosphate and their bioimaging properties, J. Lumin., 2015, 30(4), 411–415 CrossRef CAS PubMed.
- H. Bozetine, Q. Wang and A. Barras, et al., Green chemistry approach for the synthesis of ZnO–carbon dots nanocomposites with good photocatalytic properties under visible light, J. Colloid Interface Sci., 2016, 465, 286–294 CrossRef CAS PubMed.
- J. Chen, Y. Li and K. Lv, et al., Cyclam-functionalized carbon dots sensor for sensitive and selective detection of copper (II) ion and sulfide anion in aqueous media and its imaging in live cells, Sens. Actuators, B, 2016, 224, 298–306 CrossRef CAS.
- M. Xu, Z. Gao and Q. Zhou, et al., Terbium ion-coordinated carbon dots for fluorescent aptasensing of adenosine 5′-triphosphate with unmodified gold nanoparticles, Biosens. Bioelectron., 2016, 86, 978–984 CrossRef CAS PubMed.
- C. Tan, E. Etcubanas and N. Wollner, et al., Adriamycin-an antitumor antibiotic in the treatment of neoplastic diseases, Cancer, 1973, 32(1), 9–17 CrossRef CAS PubMed.
- R. H. Blum and S. K. Carter, Adriamycin: a new anticancer drug with significant clinical activity, Ann. Intern. Med., 1974, 80(2), 249–259 CrossRef CAS PubMed.
- F. Arcamone, Doxorubicin: anticancer antibiotics, Elsevier, 2012 Search PubMed.
- F. Arcamone, G. Franceschi and S. Penco, et al., Adriamycin (14-hydroxydaunomycin), a novel antitumor antibiotic, Tetrahedron Lett., 1969, 10(13), 1007–1010 CrossRef.
- D. D. Von Hoff, M. W. Layard and P. Basa, et al., Risk factors for doxorubicin-induced congestive heart failure, Ann. Intern. Med., 1979, 91(5), 710–717 CrossRef CAS PubMed.
- H. G. Keizer, H. M. Pinedo and G. J. Schuurhuis, et al., Doxorubicin (adriamycin): a critical review of free radical-dependent mechanisms of cytotoxicity, Pharmacol. Ther., 1990, 47(2), 219–231 CrossRef CAS PubMed.
- B. K. Vig, Chromosome aberrations induced in human leukocytes by the antileukemic antibiotic adriamycin, Cancer Res., 1971, 31(1), 32–38 CAS.
- Y. Chen, Y. Wan and Y. Wang, et al., Anticancer efficacy enhancement and attenuation of side effects of doxorubicin with titanium dioxide nanoparticles, Int. J. Nanomed., 2011, 6, 2321–2326 CAS.
- W. Zhang, Z. Guo and D. Huang, et al., Synergistic effect of chemo-photothermal therapy using PEGylated graphene oxide, Biomaterials, 2011, 32(33), 8555–8561 CrossRef CAS PubMed.
- J. Hu, L. Xie and W. Zhao, et al., Design of tumor-homing and pH-responsive polypeptide–doxorubicin nanoparticles with enhanced anticancer efficacy and reduced side effects, Chem. Commun., 2015, 51(57), 11405–11408 RSC.
- F. R. Rickles and R. L. Edwards, Activation of blood coagulation in cancer: Trousseau's syndrome revisited, Blood, 1983, 62(1), 14–31 CAS.
- J. I. Zwicker, H. A. Liebman and D. Neuberg, et al., Tumor-derived tissue factor-bearing microparticles are associated with venous thromboembolic events in malignancy, Clin. Cancer Res., 2009, 15(22), 6830–6840 CrossRef CAS PubMed.
- J. Hirsh, T. E. Warkentin and S. G. Shaughnessy, et al., Heparin and low-molecular-weight heparin mechanisms of action, pharmacokinetics, dosing, monitoring, efficacy, and safety, Chest, 2001, 119(1-suppl.), 64S–94S CrossRef CAS PubMed.
- L. V. Avioli, Heparin-induced osteopenia: an appraisal//Heparin, Springer, US, 1975, pp. 375–387 Search PubMed.
- J. Zhao, X. Liu and C. Kao, et al., Kinetic and Structural Studies of Interactions between Glycosaminoglycans and Langerin, Biochemistry, 2016, 55(32), 4552–4559 CrossRef CAS PubMed.
- J. U. Choi and Y. Byun, Abstract B36: Or ally active low molecular weight heparin conjugates as a tumoral lymphangiogenesis inhibitor, Cancer Res., 2016, 76(3 Supplement), B36 Search PubMed.
- A. L. Gaviglio and G. C. Blobe, Heparin-binding epidermal growth factor-like growth factor is a pro-differentiating factor in neuroblastoma, Cancer Res., 2016, 76(14 Supplement), 1182 Search PubMed.
- F. Macbeth, S. Noble and J. Evans, et al., Randomized phase III trial of standard therapy plus low molecular weight heparin in patients with lung cancer: FRAGMATIC trial, J. Clin. Oncol., 2016, 34(5), 488–494 CrossRef CAS PubMed.
- C. Nie, L. Ma and C. Cheng, et al., Nanofibrous heparin and heparin-mimicking multilayers as highly effective endothelialization and antithrombogenic coatings, Biomacromolecules, 2015, 16(3), 992–1001 CrossRef CAS PubMed.
- L. Wang, H. Li and S. Chen, et al., Interfacial self-assembly of heparin-mimetic multilayer on membrane substrate as effective antithrombotic, endothelialization, and antibacterial coating, ACS Biomater. Sci. Eng., 2015, 1(11), 1183–1193 CrossRef CAS.
- Y. Yang, J. Cui and M. Zheng, et al., One-step synthesis of amino-functionalized fluorescent carbon nanoparticles by hydrothermal carbonization of chitosan, Chem. Commun., 2012, 48(3), 380–382 RSC.
- A. Sachdev, I. Matai and S. U. Kumar, et al., A novel one-step synthesis of PEG passivated multicolour fluorescent carbon dots for potential biolabeling application, RSC Adv., 2013, 3(38), 16958–16961 RSC.
- S. Li, D. Amat and Z. Peng, et al., Transferrin conjugated nontoxic carbon dots for doxorubicin delivery to target pediatric brain tumor cells, Nanoscale, 2016, 8(37), 16662–16669 RSC.
- Q. Zhang, W. Li and T. Kong, et al., Tailoring the interlayer interaction between doxorubicin-loaded graphene oxide nanosheets by controlling the drug content, Carbon, 2013, 51, 164–172 CrossRef CAS.
- K. Park, G. Y. Lee and R. W. Park, et al., Combination therapy of heparin–deoxycholic acid conjugate and doxorubicin against squamous cell carcinoma and B16F10, Pharm. Res., 2008, 25(2), 268–276 CrossRef CAS PubMed.
- Z. Wang, H. Liao and H. Wu, et al., Fluorescent carbon dots from beer for breast cancer cell imaging and drug delivery, Anal. Methods, 2015, 7(20), 8911–8917 RSC.
- Y. Zhang, L. Han and Y. Zhang, et al., Glutathione-mediated mesoporous carbon as a drug delivery nanocarrier with carbon dots as a cap and fluorescent tracer, Nanotechnology, 2016, 27(35), 355102 CrossRef PubMed.
- X. Gong, Q. Zhang and Y. Gao, et al., Phosphorus and Nitrogen Dual-Doped Hollow Carbon Dot as a Nanocarrier for Doxorubicin Delivery and Biological Imaging, ACS Appl. Mater. Interfaces, 2016, 8(18), 11288–11297 CAS.
- J. Qiu, R. Zhang and J. Li, et al., Fluorescent graphene quantum dots as traceable, pH-sensitive drug delivery systems, Int. J. Nanomed., 2015, 10, 6709 CAS.
- C. Ay, F. Posch and J. Riedl, et al., Prediction of Venous Thromboembolism in Patients with Cancer By the Activated Partial Thromboplastin Time: Results from the Vienna Cancer and Thrombosis Study, Blood, 2015, 126(23), 653 Search PubMed.
- Z. Liu, Y. Jiao and T. Wang, et al., Interactions between solubilized polymer molecules and blood components, J. Controlled Release, 2012, 160(1), 14–24 CrossRef CAS PubMed.
- A. Wollowitz, P. E. Bijur and D. Esses, et al., Use of butterfly needles to draw blood is independently associated with marked reduction in hemolysis compared to intravenous catheter, Acad. Emerg. Med., 2013, 20(11), 1151–1155 CrossRef PubMed.
- W. Lu, X. Gong and Z. Yang, et al., High-quality water-soluble luminescent carbon dots for multicolor patterning, sensors, and bioimaging, RSC Adv., 2015, 5(22), 16972–16979 RSC.
- S. H. Chiu, G. Gedda and W. M. Girma, et al., Rapid fabrication of carbon quantum dots as multifunctional nanovehicles for dual-modal targeted imaging and chemotherapy, Acta Biomater., 2016, 46, 151–164 CrossRef CAS PubMed.
Footnote |
| † Electronic supplementary information (ESI) available. See DOI: 10.1039/c6ra28345d |
| This journal is © The Royal Society of Chemistry 2017 |