 Open Access Article
Creative Commons Attribution 3.0 Unported Licence
Novel β-Ag2MoO4/g-C3N4 heterojunction catalysts with highly enhanced visible-light-driven photocatalytic activity†
Junlei Zhang and
Zhen Ma *
*
Shanghai Key Laboratory of Atmospheric Particle Pollution and Prevention (LAP3), Department of Environmental Science and Engineering, Fudan University, Shanghai, 200433, PR China. E-mail: zhenma@fudan.edu.cn
First published on 12th January 2017
Abstract
The kernel of photocatalysis research is the development of catalysts with remarkable photocatalytic activity. g-C3N4 has attracted much interest as a new and promising photocatalyst, but further modification and improvement of g-C3N4 is urgently needed. Herein, we report a novel β-Ag2MoO4/g-C3N4 heterojunction system with highly enhanced visible-light-driven photocatalytic activity. β-Ag2MoO4 nanoparticles were in situ loaded onto thin g-C3N4 nanosheets to make these heterojunction photocatalysts. The photocatalytic activities of these heterojunctions and the relevant samples were investigated by degrading Rhodamine B (RhB), methylene blue (MB), and methyl orange (MO) under visible light irradiation (λ > 400 nm). β-Ag2MoO4/g-C3N4 heterojunctions were found to be much more active than pristine β-Ag2MoO4, g-C3N4, or a mechanical mixture of both in the degradation of organic pollutants. The optimal catalyst had a β-Ag2MoO4/g-C3N4 mass ratio of 37.5%. Through relevant characterization, the upgraded photocatalytic activities of the β-Ag2MoO4/g-C3N4 heterojunctions were mainly attributed to the efficient separation of photogenerated charge carries. Superoxide radical anions (˙O2−) and photogenerated holes (h+) were found to be the main active species.
1. Introduction
Photocatalysis, an attractive technology that involves photocatalysts and light irradiation, has been widely studied for the degradation of pollutants, the splitting of water, the reduction of CO2, and antibacterial applications.1–4 However, a bottleneck for its practical applications is that many catalysts such as TiO2 (ref. 5) and Ag2MoO4 (ref. 6) only respond to UV light (∼5% of the solar spectrum).Ag2MoO4 has been used as high-temperature lubricants,7 ion-conducting glasses,8 photoluminescent materials,9 and photoswitch devices.10 However, the wide band gap (∼3.2 eV) still limits its applications in visible-light-driven photocatalysis. Various methods, such as doping ions (e.g., Eu3+),11 depositing noble metals (e.g., Ag),12 and forming heterojunctions (e.g., Ag@Ag2MoO4–AgBr, Ag2MoO4/Ag3PO4, Ag2MoO4/Ag/AgBr/GO),13–15 have been used to enhance the visible-light absorption, thus enhancing the visible-light-driven photocatalytic performance. However, reports on Ag2MoO4-based photocatalysts are still rare.
Graphitic carbon nitride (g-C3N4), due to its suitable band gap of ∼2.7 eV and excellent structural stability, has attracted much attention for the applications in visible-light-driven photocatalytic water splitting,16–19 degradation of pollutants,20–24 and removal of NOx.25–27 g-C3N4 is abundant, of low cost, and can be easily prepared by thermal polycondensation of nitrogen-rich organic precursors such as cyanamide,28,29 dicyandiamide,22 melamine,23 and urea.30 However, the photocatalytic activity of pure g-C3N4 is still unsatisfactory due to the rapid recombination of photogenerated charge carriers. Generally, the construction of semiconductor heterojunctions is an efficient strategy to upgrade the separation efficiency of photo-induced electrons. g-C3N4 has been coupled with other compounds, such as Al2O3,31,32 V2O5,33 W18O49,34 β-Ni(OH)2,35 Bi12TiO20,36 CdV2O6,37 BiPO4,38 SnS2,39 Bi4O5I2,40 Nb2O5,41 FeOx,42 and ZnMoCdS.43 In particular, g-C3N4 can be coupled with silver-containing compounds such as Ag2O,44 Ag2CO3,45 Ag3PO4,46 Ag/AgX (X = Cl or Br),47 Ag3VO4,48 Ag2CrO4,49 and Ag2WO4 (ref. 50) to form heterojunctions with improved photocatalytic performance. However, to the best of our knowledge, there is no report on photocatalysis over β-Ag2MoO4/g-C3N4 heterojunctions.
Considering that the band edges of g-C3N4 (ECB = −1.12 eV, EVB = 1.58 eV) match well with those of β-Ag2MoO4 (ECB = −0.27 eV, EVB = 3.11 eV),13,51 we suppose that this feature is beneficial for constructing a staggered band-gap type (type II) heterojunction system. Such a catalyst system may promote the separation and migration of photogenerated carriers efficiently. Thus, in the present work, we developed a novel β-Ag2MoO4/g-C3N4 heterojunction catalyst system and found that the heterojunction catalysts exhibited much higher photocatalytic activity than pristine β-Ag2MoO4 or g-C3N4 in the degradation of dyes under visible-light irradiation. Possible reasons for the enhanced photocatalytic activity of β-Ag2MoO4/g-C3N4 heterojunction were investigated. This work not only furnishes a new photocatalyst system with improved photocatalytic activity, but also provides some mechanistic information.
2. Experimental
2.1. Materials
Melamine, CH3OH, AgNO3, Na2MoO4·2H2O, absolute ethanol, Rhodamine B (RhB), methylene blue (MB), and methyl orange (MO) were purchased from Sinopharm Chemical Reagent Co., Ltd. All chemicals were of analytical grade and used as received.2.2. Preparation of g-C3N4
Bulk g-C3N4 (B-CN) was prepared by thermal polymerization.52 Typically, 10.0 g melamine powders were put into an Al2O3 crucible with a cover. The crucible was heated to 550 °C at a ramping rate of 3 °C min−1, kept at 550 °C for 4 h, and then cooled down to room temperature. After that, 1.0 g bulk g-C3N4 was ground into powders, and ultrasonically crashed in 15 ml methanol for 5 h to obtain thin g-C3N4 nanosheets (T-CN).2.3. Preparation of β-Ag2MoO4/g-C3N4
β-Ag2MoO4/g-C3N4 heterojunctions were prepared by deposition–precipitation at room temperature. Briefly, 0.50 g T-CN powders were dispersed with 50 mL deionized water (in a 100 mL beaker) by ultrasonication for 30 min. 10.0 mL AgNO3 solution (0.1 M) was then added dropwise into the breaker, and the mixture was magnetically stirred for 30 min to obtain Ag+-T-CN suspension. After that, 5.0 mL Na2MoO4 solution (0.1 M) was added in the above suspension, and the mixture was continuously stirred for 2 h. The solid (with a theoretical β-Ag2MoO4/g-C3N4 mass ratio of 37.5%) collected by filtration was washed with water–ethanol for three times, and dried at 60 °C for 24 h. A series of samples with different β-Ag2MoO4/g-C3N4 mass ratios (9.3%, 18.9%, 37.5%, 75.1%, and 150.2%) were prepared that way, and were named as AMOCNX (X = 1, 2, 3, 4, and 5). For comparison, β-Ag2MoO4 (denoted as AMO) was prepared via a similar process without adding T-CN.2.4. Characterization
Powder X-ray diffraction (XRD) data were collected using a MSAL XD2 X-ray diffractometer with CuKα radiation at 40 kV and 30 mA at a scanning speed of 8° min−1. The oxidation states of elements were analyzed by using X-ray photoelectron spectroscopy (Axis Ultra Dld, Kratos). Scanning electron microscope (SEM) experiments were conducted on a Shimadz SUPERSCAN SSX-550 field emission scanning electron microscope. Transmission electron microscopy (TEM) data were obtained by a JEOL JEM-2100F high-resolution transmission electron microscope. N2 adsorption–desorption isotherms at liquid N2 temperature were obtained on a Micrometrics ASAP 2020M + C adsorption apparatus. Optical diffuse reflectance spectra were recorded on a UV-VIS-NIR scanning spectrophotometer (Lambda 35, Perkin-Elmer) using an integrating sphere accessory.2.5. Evaluation of photocatalytic performance
Photocatalytic performance in the degradation of RhB, MO, or MB dye was investigated under visible light irradiation (λ > 420 nm) at room temperature. The distance between the Xe lamp and the beaker mouth was 15 cm (Fig. S1 in the ESI†).53 In a typical procedure, 30.0 mg photocatalyst was suspended in 50 mL RhB (5.0 mg L−1), MO (6.0 mg L−1), or MB (5.0 mg L−1) solution in a 100 mL beaker. The beaker was placed in a water bath placed on top of an electromagnetic stirrer. The solution was stirred (854 rpm) for 30 min in the dark before the Xe lamp (300 W, HSX-F300, Beijing NBeT Technology Co., Ltd.) coupled with a UV-cutoff filter (420 nm) was turned on. During the experiment, ∼4.0 mL of suspension was sampled in certain intervals, centrifuged to separate the catalyst and the liquid, and the clear liquid was then monitored by a UV-5200PC spectrometer.Experiments involving radicals capture were conducted by adding 1 mmol ammonium oxalate (AO), 1 mmol isopropanol (IPA), 1 mmol AgNO3, or 0.02 mmol benzoquinone (BQ) into RhB (5.0 mg L−1) solution before the standard photocatalytic tests.
3. Results and discussion
3.1. Preparation and characterization of β-Ag2MoO4/g-C3N4 heterojunctions
Thin g-C3N4 nanosheets (T-CN) were first prepared via thermal polymerization and subsequent ultrasonication. β-Ag2MoO4 (0.125, 0.250, 0.500, 1.00, and 2.00 mmol) was then in situ deposited onto T-CN (0.50 g) through the reaction of AgNO3 and Na2MoO4 in the aqueous solution at room temperature. The resulting catalysts are named as AMOCN1, AMOCN2, AMOCN3, AMOCN4, AMOCN5, respectively. The theoretical β-Ag2MoO4/g-C3N4 mass ratios of these composite samples are 9.3%, 18.9%, 37.5%, 75.1%, and 150.2%, respectively.Fig. S2† shows the XRD patterns of bulk g-C3N4 (B-CN), thin g-C3N4 nanosheets (T-CN), and Ag2MoO4 (AMO). Both B-CN and T-CN show a characteristic peak at 27.4°, indexed as the (002) peak of g-C3N4.22 For Ag2MoO4, the peaks at 2θ = 16.5°, 27.1°, 31.8°, 33.3°, 38.6°, 42.2°, 47.8°, 50.9°, 55.8°, 65.7°, and 66.6° are assigned to the (111), (220), (311), (222), (400), (331), (422), (511), (440), (533), and (622) planes of cubic β-Ag2MoO4, respectively (JCPDS 08-0473).13 The XRD patterns of AMOCN1, AMOCN2, AMOCN3, AMOCN4, and AMOCN5 can be indexed to a combination of g-C3N4 and β-Ag2MoO4 (Fig. 1). The intensities of the β-Ag2MoO4 peaks enhance gradually when the β-Ag2MoO4/g-C3N4 mass ratio increases. No impurity phase is identified.
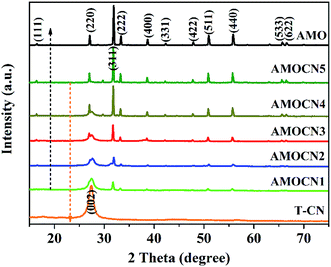 | ||
| Fig. 1 XRD patterns of T-CN (thin g-C3N4 nanosheets), AMOCN1, AMOCN2, AMOCN3, AMOCN4, AMOCN5, and AMO (β-Ag2MoO4). | ||
Representative catalysts were subjected to XPS analysis. The survey XPS spectra in Fig. 2A show that g-C3N4 contains C and N, and β-Ag2MoO4 contains Ag, Mo, O, and adventitious C. AMOCN3 comprises C, N, Ag, Mo, and O. For AMOCN3, the peaks at 284.70 and 287.87 eV can be ascribed to sp2 C–C bonds of graphitic carbon and sp2-bonded carbon (N–C![[double bond, length as m-dash]](https://www.rsc.org/images/entities/char_e001.gif) N) of the s-triazine rings, respectively (Fig. 2B).50,52 The binding energy for the C 1s peak at 284.70 eV can be attributed to adventitious carbon species on the sample (normally used as the reference for XPS calibration). The N 1s signal also shows two feature peaks at 398.22 and 399.90 eV (Fig. 2C), ascribed to the sp2-bonded N (C–N
N) of the s-triazine rings, respectively (Fig. 2B).50,52 The binding energy for the C 1s peak at 284.70 eV can be attributed to adventitious carbon species on the sample (normally used as the reference for XPS calibration). The N 1s signal also shows two feature peaks at 398.22 and 399.90 eV (Fig. 2C), ascribed to the sp2-bonded N (C–N![[double bond, length as m-dash]](https://www.rsc.org/images/entities/char_e001.gif) C) and tertiary nitrogen N–(C)3 groups.50,52 The binding energies of 367.85 eV for Ag 3d5/2 and 373.84 eV for Ag 3d3/2 (Fig. 2D) confirm the existence of Ag+.49 Fig. 2E shows two peaks at 232.70 and 235.85 eV, corresponding to the Mo 3d5/2 and Mo 3d3/2 binding energies of Mo6+.54 There are three main signals in O 1s spectra (Fig. 2F). The peaks at 532.92 and 530.54 eV are assigned to chemisorbed H2O (532.92 eV) and hydroxyls (OH−, 530.54 eV), respectively.42 Another peak at 532.31 eV is ascribed to oxygen in β-Ag2MoO4. Overall, the XPS results confirm that AMOCN3 is composed of g-C3N4 and β-Ag2MoO4.
C) and tertiary nitrogen N–(C)3 groups.50,52 The binding energies of 367.85 eV for Ag 3d5/2 and 373.84 eV for Ag 3d3/2 (Fig. 2D) confirm the existence of Ag+.49 Fig. 2E shows two peaks at 232.70 and 235.85 eV, corresponding to the Mo 3d5/2 and Mo 3d3/2 binding energies of Mo6+.54 There are three main signals in O 1s spectra (Fig. 2F). The peaks at 532.92 and 530.54 eV are assigned to chemisorbed H2O (532.92 eV) and hydroxyls (OH−, 530.54 eV), respectively.42 Another peak at 532.31 eV is ascribed to oxygen in β-Ag2MoO4. Overall, the XPS results confirm that AMOCN3 is composed of g-C3N4 and β-Ag2MoO4.
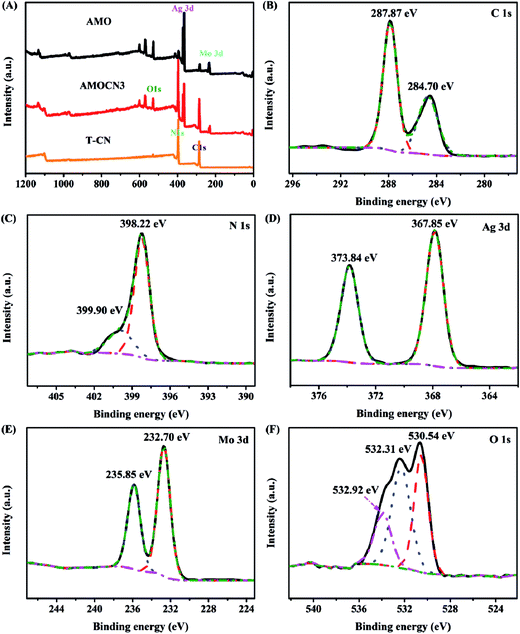 | ||
| Fig. 2 (A) Survey XPS spectra of T-CN, AMOCN3, and AMO; high-resolution XPS spectra of C 1s (B), N 1s (C), Ag 3d (D), Mo 3d (E), and O 1s (F) from AMOCN3. | ||
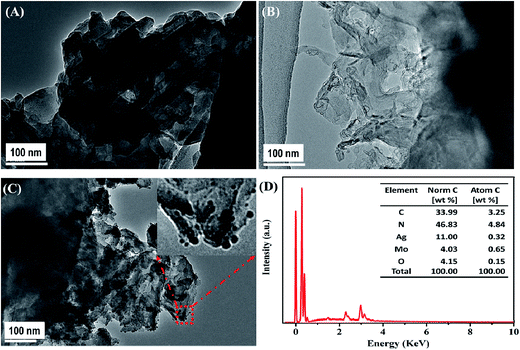
Fig. 3 shows the morphology and microstructure of B-CN, T-CN, and AMOCN3. The TEM (Fig. 3A) and SEM (Fig. S3A†) images indicate that B-CN exhibits a stratified structure built from numerous nanosheets with smooth surfaces. After ultrasonic dispersion, some B-CN is exfoliated to form T-CN (Fig. 3B and S3B†). Upon loading β-Ag2MoO4 onto T-CN, some β-Ag2MoO4 nanoparticles with sizes from nanometers to decades of nanometers are well dispersed on the surface of nanosheets (Fig. 3C). The EDS result exhibits the existence of C, N, Ag, Mo, and O elements in AMOCN3 (Fig. 3D). The calculated C/N and Ag/Mo atom ratios, shown in the inset of Fig. 3D, are very close to the theoretical values (3/4 for g-C3N4, 2/1 for β-Ag2MoO4). Furthermore, HAADF-FSEM coupled with EDS mapping indicate the uniform distribution of C, N, Ag, Mo, and O on the catalyst (Fig. S4†).
With the increase of the β-Ag2MoO4/g-C3N4 mass ratio, more β-Ag2MoO4 nanoparticles are observed on the surface of T-CN (Fig. S5†). Occasionally, some particles with sizes ranging from 0.5 to 5 μm are also found on the surface of T-CN (Fig. S6†). The TEM results are consistent with the XRD results (Fig. 1) that the β-Ag2MoO4 peaks become sharper as the β-Ag2MoO4/g-C3N4 mass ratio increases.
Representative samples were characterized by N2 adsorption–desorption (Fig. S7†). The pore size distributions calculated from the adsorption branches reveal the existence of nanopores (diameter: 29.9, 29.5, and 31.0 nm) in B-CN, T-CN, and AMOCN3. The BET surface areas of B-CN, T-CN, and AMOCN3 are 9.2, 9.8, and 8.2 m2 g−1, respectively.
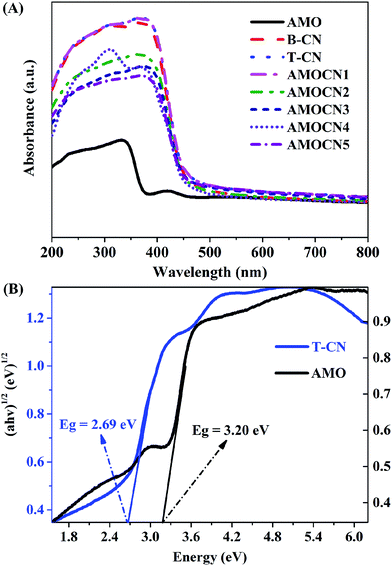
The optical property of catalysts was investigated by UV-Vis-NIR DRS (Fig. 4A). Pure β-Ag2MoO4 exhibits a strong absorption in the UV region with an absorption edge around 388 nm, indicating that β-Ag2MoO4 can only be excited by UV light.6,13,55 Both B-CN and T-CN exhibit strong absorption from the UV to visible-light region with an absorption edge around 460 nm, consistent with previous results.51,56 β-Ag2MoO4/g-C3N4 heterojunctions can absorb visible light, and their wavelength thresholds are estimated to be 450–460 nm.
The optical absorption near the band edge follows the Tauc equation:
| αhν = A(hν − Eg)n/2, | (1) |
The band edge positions of β-Ag2MoO4 (band gap: 3.20 eV) and g-C3N4 (band gap: 2.69 eV) were further evaluated using the following empirical equations:57
| EVB = X − E0 + 0.5Eg; | (2) |
| ECB = EVB − Eg, | (3) |
3.2. Photocatalytic performance under visible light irradiation
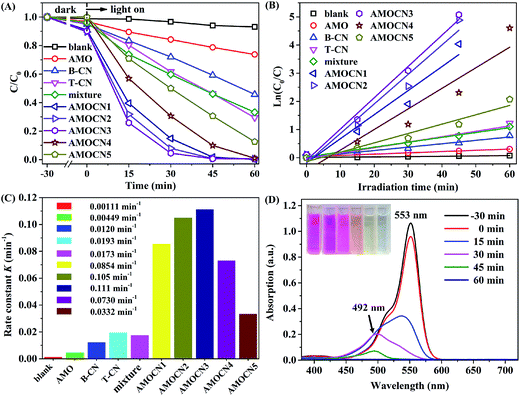
The photocatalytic performance of β-Ag2MoO4/g-C3N4 heterojunctions was evaluated in the degradation of organic dyes (RhB, MO, and MB) in aqueous systems under visible light irradiation. Prior to irradiation, the mixture containing dye solution and a catalyst (30.0 mg) was kept in the dark for 30 min to ensure the adsorption–desorption equilibrium.The degradation of RhB under visible light irradiation is extremely slow without adding a catalyst (Fig. 5A). The degradation efficiencies achieved by using AMOCN1, AMOCN2, AMOCN3, AMOCN3, AMOCN4, and AMOCN5 after 60 min of reaction are 98.3%, 99.3%, 99.4%, 90.1%, and 69.4%, repectively, all higher than those achieved by using pristine β-Ag2MoO4 (21.3%), B-CN (40.8%), or T-CN (53.7%) with the same mass (30.0 mg). Especially, AMOCN3 with a β-Ag2MoO4/g-C3N4 ratio of 37.5% exhibits the highest activity among these catalysts. The degradation efficiency achieved using AMOCN3 (99.4%) is even much higher than the degradation efficiency (54%) achieved using a mechanical mixture of β-Ag2MoO4 (8.20 mg) and g-C3N4 (21.8 mg) with a β-Ag2MoO4/g-C3N4 ratio of 37.5%, indicating the advantageous role of nanojunction in the β-Ag2MoO4/g-C3N4 system.
The degradation data were fit using the pseudo-first-order model (Fig. 5B): −ln(C/C0) = Kt,59,60 where C is the concentration of RhB at time t, C0 is the original concentration of RhB, and K is the reaction rate constant. As shown in Fig. 5C, the photocatalytic degradation rates using AMOCN1 (0.0854 min−1), AMOCN2 (0.105 min−1), AMOCN3 (0.111 min−1), AMOCN4 (0.0730 min−1), and AMOCN5 (0.0332 min−1) are much higher than those obtained by using β-Ag2MoO4 (0.00449 min−1), B-CN (0.0120 min−1), T-CN (0.0193 min−1), or a mixture of β-Ag2MoO4 and T-CN (0.0173 min−1). Clearly, AMOCN3 exhibits the highest photocatalytic activity.
Fig. 5D shows the temporal evolution of the absorption spectrum of RhB solution in the presence of AMOCN3 under visible-light irradiation. The absorption peak at 553 nm decreases gradually as the irradiation time increases and completely disappears after 45 min, indicating the destruction of the conjugated structure. The stepwise blue shift of the main peak can be attributed to the de-ethylation of RhB, accompanied by slight concomitant blue-shifts from 553 to 492 nm of the maximum absorption.61,62 This phenomenon is due to the incomplete mineralization of RhB in 45 min. However, the absorption peak at 492 nm also completely disappears after additional 15 min of reaction. In addition, the color of RhB solution gradually changes from red to pale yellow as the reaction proceeds, and even becomes colorless and transparent at the end of reaction, confirming that RhB can be decomposed into small molecules, e.g., H2O and CO2.60,63
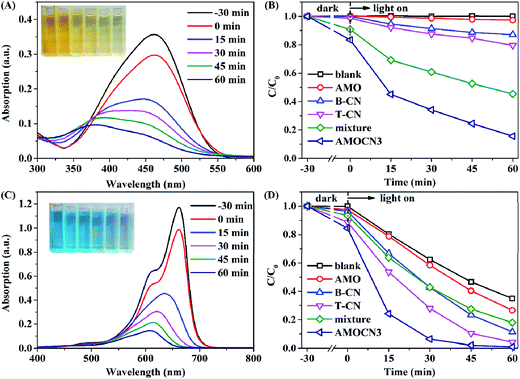
The photocatalytic degradation of MO and MB under visible-light irradiation was also studied using AMOCN3 (Fig. 6). A rapid decrease of MO absorption at 464 nm is observed as the reaction proceeds (Fig. 6A). The color of MO solution gradually changes from dark yellow to pale yellow. During 30 min in the dark, AMOCN3 exhibits a higher adsorption efficiency for anionic MO (16.7%) than cationic RhB (9.8%), consistent with previous studies.64,65 After 60 min of reaction, the MO photodegradation efficiency reaches 84.4%, much higher than that by using B-CN (12.9%), T-CN (20.4%), AMO (2.7%), or a mixture of T-CN and AMO (54.7%, Fig. 6B). Moreover, the photodegradation rate (0.0264 min−1) of MO is about 11.7, 7.7, 5.1, or 2.4 times as that by using B-CN (0.00226 min−1), T-CN (0.00343 min−1), AMO (0.00520 min−1), or the mixture (0.0111 min−1) as the catalyst (Fig. S8A†). In another reaction, the MB degradation efficiency achieved by using AMOCN3 reaches 100% after 60 min of reaction, higher than that by using B-CN (88.7%), T-CN (95.9%), AMO (73.4%), or the mixture (82.1%) as the catalyst (Fig. 6C and D). The photodegradation rate (0.0762 min−1) of MB is about 2.2, 1.5, 3.5, or 2.8 times as that by using B-CN (0.0355 min−1), T-CN (0.0519 min−1), AMO (0.0218 min−1), or the mixture (0.0276 min−1) as the catalyst (Fig. S8B†).
The effect of initial concentration of RhB, MO, or MB on the catalytic activity of AMOCN3 was further studied. The degradation efficiency (Fig. 7) and rate (Fig. S9†) decrease with the increase of initial dye concentration. One possible reason is that, when the concentration of dye is too high, a significant portion of visible light may be absorbed by the dye molecules rather than by AMOCN3, which may inhibit the photoactivity. Another reason is that the intermediates formed during the photocatalytic reaction may compete with the dye molecules, further limiting the adsorption and catalytic sites on the catalyst.
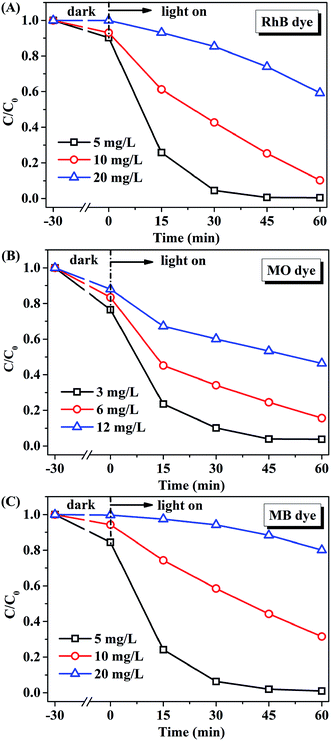 | ||
| Fig. 7 The effect of initial concentration of (A) RhB, (B) MO or (C) MB on the catalytic performance of AMOCN3 (30.0 mg) under visible light irradiation. | ||
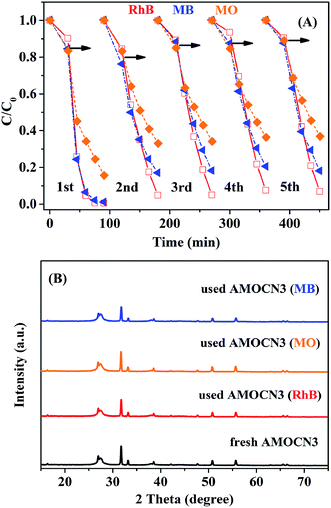
The recyclability of AMOCN3 in photocatalytic degradation of RhB, MO, or MB was studied (Fig. 8A). After the first run, AMOCN3 does not lose activity in the subsequent four runs. The used catalyst exhibits the similar XRD peaks (Fig. 8B) and survey XPS spectrum (Fig. S10A†) as the fresh one. Usually, the transformation of Ag+ into Ag0 takes place in silver-containing compounds and the resulting photocorrosion may decrease the catalytic activity.50,66 However, the formation of Ag0 does not happen after five recycling runs in the current work, as seen from high-resolution XPS spectra of Ag 3d from the used AMOCN3 (Fig. S10B–D†), consistent with the result of XRD pattern (Fig. 8B). This is mainly attributed to the fact that the N–H groups or conjugated π structures in g-C3N4 can bond with Ag+ (in β-Ag2MoO4) tightly due to the chemical adsorption, which may protect β-Ag2MoO4 from photo-reduction (Ag+ + e− → Ag0) during the photocatalytic process.46,50
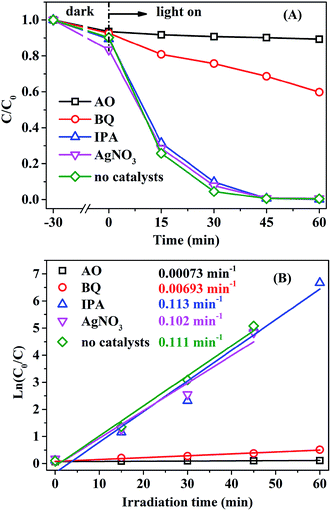
To analyze the reaction mechanism, it is essential to identify the main active species. Trapping agents such as benzoquinone (BQ), ammonium oxalate (AO), AgNO3, and isopropyl alcohol (IPA) have been used to capture superoxide radical anions (˙O2−), photogenerated holes (h+), photogenerated electrons (e−), and hydroxyl free radicals (˙OH), respectively.53,60,67 As shown in Fig. 9, the addition of IPA or AgNO3 has no obvious effect on the photocatalytic activity of AMOCN3, suggesting that ˙OH and e− are not the primary active species. However, when AO or BQ is added into the system, the RhB degradation efficiency decreases from 100% to 9.9% or 31.4% after 45 min of reaction, and the photodegradation rate also decreases from 0.111 to 0.00073 and 0.00693 min−1, respectively (Fig. 9). Thus, ˙O2− and h+ play a critical role in the photodegradation of RhB over AMOCN3.
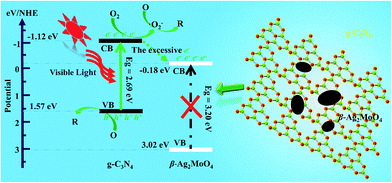
Based on the band edge positions, the transfer path of the photogenerated charge carriers in β-Ag2MoO4/g-C3N4 under visible light is drawn in Fig. 10. Under visible light irradiation, the electrons (e−) in β-Ag2MoO4 cannot be excited from the VB to CB but the electrons photoexcited in the CB of g-C3N4 still drift to the CB of β-Ag2MoO4 because of the more negative potential of the CB for g-C3N4. Because the CB potential of β-Ag2MoO4 is higher than that of O2/˙O2− (−0.33 eV),50 the electrons on the CB of β-Ag2MoO4 cannot reduce O2 to generate ˙O2−. Thus, ˙O2− may be firstly generated by the electrons excited on the CB of g-C3N4. The excessive electrons will then transfer from the CB of g-C3N4 to that of β-Ag2MoO4. The photogenerated holes left in the CB of g-C3N4 could not oxidize H2O to generate ˙OH owing to the more positive potential of ˙OH/H2O (2.68 eV).50 Hence, the photogenerated holes will react with the target pollutants (RhB, MO, and MB) directly due to their strong oxidative capacity. These main active species (˙O2− and h+) can break down the chromophores of the organic dyes (RhB, MO, and MB) into small molecules, e.g., H2O and CO2.60,63
4. Conclusions
β-Ag2MoO4/g-C3N4 heterojunctions were synthesized by the in situ deposition of β-Ag2MoO4 nanoparticles on the surface of thin g-C3N4 nanosheets. They were much more active than pristine β-Ag2MoO4 or g-C3N4 in photocatalytic degradation of several organic dyes (Rhodamine B, methyl orange, and methylene blue) under visible light irradiation. The optimal β-Ag2MoO4/g-C3N4 mass ratio is 37.5%. Superoxide radical anions (˙O2−) and photogenerated holes (h+) are the primary active species in the photocatalytic degradation of RhB. There are two main reasons for the high photocatalytic activity of the β-Ag2MoO4/g-C3N4 heterojunctions. First, g-C3N4 has an appropriate band gap for the visible light absorption. Second, the nanojunction between β-Ag2MoO4 and g-C3N4 can promote the separation efficiency of photogenerated electrons (e−) and holes (h+). This work provides a new example on the development of g-C3N4-based or β-Ag2MoO4-based photocatalysts with excellent photocatalytic activity under visible-light irradiation, and it provides new opportunities for us to expand the application of this type of catalysts in other reactions such as photocatalytic bacterial/virus inactivation and removal of air pollutants in the future.Acknowledgements
Zhen Ma acknowledges the financial support by National Natural Science Foundation of China (Grant No. 21477022).References
- M. R. Hoffmann, S. T. Martin, W. Y. Choi and D. W. Bahnemann, Chem. Rev., 1995, 95, 69–96 CrossRef CAS.
- A. Kubacka, M. Fernandez-Garcia and G. Colon, Chem. Rev., 2012, 112, 1555–1614 CrossRef CAS PubMed.
- W. Hou and S. B. Cronin, Adv. Funct. Mater., 2013, 23, 1612–1619 CrossRef CAS.
- T. Matsunaga, R. Tomoda, T. Nakajima and H. Wake, FEMS Microbiol. Lett., 1985, 29, 211–214 CrossRef CAS.
- K. Nakata and A. Fujishima, J. Photochem. Photobiol., C, 2012, 13, 169–189 CrossRef CAS.
- D. F. Xu, B. Cheng, J. F. Zhang, W. K. Wang, J. G. Yu and W. K. Ho, J. Mater. Chem. A, 2015, 3, 20153–20166 CAS.
- E. Y. Liu, Y. M. Gao, J. H. Jia and Y. P. Bai, Tribol. Lett., 2013, 50, 313–322 CrossRef CAS.
- S. Bhattacharya and A. Ghosh, Phys. Rev. B: Condens. Matter Mater. Phys., 2007, 75, 2103 Search PubMed.
- Y. V. B. De Santana, J. E. Cardoso Gomes, L. Matos, G. H. Cruvinel, A. Perrin, C. Perrin, J. Andres, J. A. Varela and E. Longo, Nanomater. Nanotechnol., 2014, 4, 1627–1635 Search PubMed.
- L. Cheng, Q. Shao, M. W. Shao, X. W. Wei and Z. C. Wu, J. Phys. Chem. C, 2009, 113, 1764–1768 CAS.
- S. K. Gupta, P. S. Ghosh, K. Sudarshan, R. Gupta, P. K. Pujari and R. M. Kadam, Dalton Trans., 2015, 44, 19097–19110 RSC.
- Z. Q. Li, X. T. Chen and Z. L. Xue, Sci. China: Chem., 2013, 56, 443–450 CrossRef CAS.
- Y. Y. Bai, Y. Lu and J. K. Liu, J. Hazard. Mater., 2016, 307, 26–35 CrossRef CAS PubMed.
- R. Dhanabal, S. Velmathi and A. C. Bose, Catal. Sci. Technol., 2016, 6, 8449–8463 CAS.
- Y. Y. Bai, F. R. Wang and J. K. Liu, Ind. Eng. Chem. Res., 2016, 55, 9873–9879 CrossRef CAS.
- Y. Wang, X. C. Wang and M. Antonietti, Angew. Chem., Int. Ed., 2012, 51, 68–89 CrossRef CAS PubMed.
- X. Q. Fan, L. X. Zhang, R. L. Cheng, M. Wang, M. L. Li, Y. J. Zhou and J. L. Shi, ACS Catal., 2015, 5, 5008–5015 CrossRef CAS.
- Q. Han, B. Wang, Y. Zhao, C. G. Hu and L. T. Qu, Angew. Chem., Int. Ed., 2015, 54, 11433–11437 CrossRef CAS PubMed.
- F. He, G. Chen, Y. S. Zhou, Y. G. Yu, Y. Zheng and S. Hao, Chem. Commun., 2015, 51, 16244–16246 RSC.
- X. Y. Yuan, C. Zhou, Y. R. Jin, Q. Y. Jing, Y. L. Yang, X. Shen, Q. Tang, Y. H. Mu and A. K. Du, J. Colloid Interface Sci., 2016, 468, 211–219 CrossRef CAS PubMed.
- Y. Z. Yu and J. G. Wang, Ceram. Int., 2016, 42, 4063–4071 CrossRef CAS.
- M. Zhang, W. J. Jiang, D. Liu, J. Wang, Y. F. Liu, Y. Y. Zhu and Y. F. Zhu, Appl. Catal., B, 2016, 183, 263–268 CrossRef CAS.
- X. L. Yang, F. F. Qian, G. J. Zou, M. L. Li, J. R. Lu, Y. M. Li and M. T. Bao, Appl. Catal., B, 2016, 193, 22–35 CrossRef CAS.
- Y. J. Cui, Y. B. Cui and X. C. Wang, Mater. Lett., 2015, 161, 197–200 CrossRef CAS.
- G. H. Dong, W. K. Ho, Y. H. Li and L. Z. Zhang, Appl. Catal., B, 2015, 174, 477–485 CrossRef.
- F. Dong, Y. H. Li, Z. Y. Wang and W. K. Ho, Appl. Surf. Sci., 2015, 358, 393–403 CrossRef CAS.
- W. K. Ho, Z. Z. Zhang, M. K. Xu, X. W. Zhang, X. X. Wang and Y. Huang, Appl. Catal., B, 2015, 179, 106–112 CrossRef CAS.
- Z. X. Ding, J. H. Huang and X. C. Wang, Phys. Chem. Chem. Phys., 2010, 12, 5983–5985 RSC.
- H. Zhang, L. X. Zhao, F. L. Geng, L. H. Guo, B. Wan and Y. Yang, Appl. Catal., B, 2016, 180, 656–662 CrossRef CAS.
- Z. A. Lan, G. G. Zhang and X. C. Wang, Appl. Catal., B, 2016, 192, 116–125 CrossRef CAS.
- F. T. Li, Y. Zhao, Q. Wang, X. J. Wang, Y. J. Hao, R. H. Liu and D. S. Zhao, J. Hazard. Mater., 2015, 283, 371–381 CrossRef CAS PubMed.
- F. T. Li, S. J. Liu, Y. B. Xue, X. J. Wang, Y. J. Hao, J. Zhao, R. H. Liu and D. S. Zhao, Chem.–Eur. J., 2015, 21, 10149–10159 CrossRef CAS PubMed.
- Y. Z. Hong, Y. H. Jiang, C. S. Li, W. Q. Fan, X. Yan, M. Yan and W. D. Shi, Appl. Catal., B, 2016, 180, 663–673 CrossRef CAS.
- K. N. Song, F. Xiao, L. J. Zhang, F. Yue, X. Y. Liang, J. D. Wang and X. T. Su, J. Mol. Catal. A: Chem., 2016, 418–419, 95–102 CrossRef CAS.
- J. Q. Yan, H. Wu, H. Chen, L. Q. Pang, Y. X. Zhang, R. B. Jiang, L. D. Li and S. Z. Liu, Appl. Catal., B, 2016, 194, 74–83 CrossRef CAS.
- H. L. Sun, J. Li, G. K. Zhang and N. Li, J. Mol. Catal. A: Chem., 2016, 424, 311–322 CrossRef CAS.
- M. Cui, Q. Y. Nong, J. X. Yu, H. J. Lin, Y. Wu, X. L. Jiang, X. Z. Liu and Y. M. He, J. Mol. Catal. A: Chem., 2016, 423, 240–247 CrossRef CAS.
- X. J. Zou, C. Q. Ran, Y. Y. Dong, Z. B. Chen, D. P. Dong, D. X. Hu, X. Y. Li and Y. B. Cui, RSC Adv., 2016, 6, 20664–20670 RSC.
- Y. P. Liu, P. Chen, Y. Chen, H. D. Lu, J. X. Wang, Z. S. Yang, Z. H. Lu, M. Li and L. Fang, RSC Adv., 2016, 6, 10802–10809 RSC.
- N. Tian, Y. H. Zhang, C. Y. Liu, S. X. Yu, M. Li and H. W. Huang, RSC Adv., 2016, 6, 10895–10903 RSC.
- Y. Z. Hong, C. S. Li, G. Y. Zhang, Y. D. Meng, B. X. Yin, Y. Zhao and W. D. Shi, Chem. Eng. J., 2016, 299, 74–84 CrossRef CAS.
- R. L. Cheng, L. X. Zhang, X. Q. Fan, M. Wang, M. L. Li and J. L. Shi, Carbon, 2016, 101, 62–70 CrossRef CAS.
- Q. Zhang, S. Z. Hu, Z. P. Fan, D. S. Liu, Y. F. Zhao, H. F. Ma and F. Y. Li, Dalton Trans., 2016, 45, 3497–3505 RSC.
- M. Wu, J. M. Yan, X. W. Zhang, M. Zhao and Q. Jiang, J. Mater. Chem. A, 2015, 3, 15710–15714 CAS.
- Y. F. Li, L. Fang, R. X. Jin, Y. Yang, X. Fang, Y. Xing and S. Y. Song, Nanoscale, 2015, 7, 758–764 RSC.
- S. Kumar, T. Surendar, A. Baruah and V. Shanker, J. Mater. Chem. A, 2013, 1, 5333–5340 CAS.
- S. F. Kang, Y. Fang, Y. K. Huang, L.-F. Cui, Y. Z. Wang, H. F. Qin, Y. M. Zhang, X. Li and Y. G. Wang, Appl. Catal., B, 2015, 168–169, 472–482 CrossRef CAS.
- T. T. Zhu, Y. H. Song, H. Y. Ji, Y. G. Xu, Y. X. Song, J. X. Xia, S. Yin, Y. P. Li, H. Xu, Q. Zhang and H. M. Li, Chem. Eng. J., 2015, 271, 96–105 CrossRef CAS.
- Y. C. Deng, L. Tang, G. M. Zeng, J. J. Wang, Y. Y. Zhou, J. J. Wang, J. Tang, Y. N. Liu, B. Peng and F. Chen, J. Mol. Catal. A: Chem., 2016, 421, 209–221 CrossRef CAS.
- Y. F. Li, R. X. Jin, X. Fang, Y. Yang, M. Yang, X. C. Liu, Y. Xing and S. Y. Song, J. Hazard. Mater., 2016, 313, 219–228 CrossRef CAS PubMed.
- Z. Zhu, Z. Y. Lu, D. D. Wang, X. Tang, Y. S. Yan, W. D. Shi, Y. S. Wang, N. L. Gao, X. Yao and H. J. Dong, Appl. Catal., B, 2016, 182, 115–122 CrossRef CAS.
- S. W. Cao, J. X. Low, J. G. Yu and M. Jaroniec, Adv. Mater., 2015, 27, 2150–2176 CrossRef CAS PubMed.
- J. L. Zhang, H. Liu and Z. Ma, J. Mol. Catal. A: Chem., 2016, 424, 37–44 CrossRef CAS.
- R. M. Mohamed and F. M. Ibrahim, J. Ind. Eng. Chem., 2015, 22, 28–33 CrossRef CAS.
- A. F. Gouveia, J. C. Sczancoski, M. M. Ferrer, A. S. Lima, M. R. M. C. Santos, M. S. Li, R. S. Santos, E. Longo and L. S. Cavalcante, Inorg. Chem., 2014, 53, 5589–5599 CrossRef CAS PubMed.
- H. G. Yu, P. Xiao, P. Wang and J. G. Yu, Appl. Catal., B, 2016, 193, 217–225 CrossRef CAS.
- X. Zong, H. J. Yan, G. P. Wu, G. J. Ma, F. Y. Wen, L. Wang and C. Li, J. Am. Chem. Soc., 2008, 130, 7176–7177 CrossRef CAS PubMed.
- R. R. Hao, G. H. Wang, H. Tang, L. L. Sun, C. Xu and D. Y. Han, Appl. Catal., B, 2016, 187, 47–58 CrossRef CAS.
- J. L. Zhang, L. S. Zhang, N. Yu, K. B. Xu, S. J. Li, H. L. Wang and J. S. Liu, RSC Adv., 2015, 5, 75081–75088 RSC.
- J. L. Zhang, L. S. Zhang, X. F. Shen, P. F. Xu and J. S. Liu, CrystEngComm, 2016, 18, 3856–3865 RSC.
- J. Di, J. X. Xia, S. Yin, H. Xu, L. Xu, Y. G. Xu, M. Q. He and H. M. Li, J. Mater. Chem. A, 2014, 2, 5340–5351 CAS.
- J. Di, J. X. Xia, M. X. Ji, B. Wang, S. Yin, Q. Zhang, Z. G. Chen and H. M. Li, Appl. Catal., B, 2016, 183, 254–262 CrossRef CAS.
- H. L. Wang, L. S. Zhang, Z. G. Chen, J. Q. Hu, S. J. Li, Z. H. Wang, J. S. Liu and X. C. Wang, Chem. Soc. Rev., 2014, 43, 5234–5244 RSC.
- F. T. Li, Q. Wang, J. R. Ran, Y. J. Hao, X. J. Wang, D. S. Zhao and S. Z. Qiao, Nanoscale, 2015, 7, 1116–1126 RSC.
- F. T. Li, Y. Zhao, Y. J. Hao, X. J. Wang, R. H. Liu, D. S. Zhao and D. M. Chen, J. Hazard. Mater., 2012, 239–240, 118–127 CrossRef CAS PubMed.
- S. M. Wang, D. L. Li, C. Sun, S. G. Yang, Y. Guan and H. He, Appl. Catal., B, 2014, 144, 885–892 CrossRef CAS.
- Y. J. Chen, G. H. Tian, Y. H. Shi, Y. T. Xiao and H. G. Fu, Appl. Catal., B, 2015, 164, 40–47 CrossRef CAS.
Footnote |
| † Electronic supplementary information (ESI) available. See DOI: 10.1039/c6ra26352f |
| This journal is © The Royal Society of Chemistry 2017 |

