Highly selective ratiometric fluorescent recognition of histidine by tetraphenylethene–terpyridine–Zn(II) complexes†
Jiao Dua,
Shanshan Yu*a,
Zeng Huanga,
Liming Chena,
Yimang Xua,
Guanyu Zhanga,
Qi Chena,
Xiaoqi Yu*a and
Lin Pu*ab
aKey Laboratory of Green Chemistry and Technology, Ministry of Education, College of Chemistry, Sichuan University, Chengdu, 610064, P. R. China. E-mail: yushanshan@scu.edu.cn; xqyu@scu.edu.cn
bDepartment of Chemistry, University of Virginia, Charlottesville, Virginia 22904-4319, USA. E-mail: lp6n@virginia.edu
First published on 2nd March 2016
Abstract
TPE–monoTpy and TPE–diTpy compounds (TPE = tetraphenylethene, Tpy = 2,2′:6′,2′′-terpyridine) were prepared and showed significant red shifts in fluorescence upon coordination to Zn(NO3)2 in THF![[thin space (1/6-em)]](https://www.rsc.org/images/entities/char_2009.gif) :
:![[thin space (1/6-em)]](https://www.rsc.org/images/entities/char_2009.gif) HEPES (1
HEPES (1![[thin space (1/6-em)]](https://www.rsc.org/images/entities/char_2009.gif) :
:![[thin space (1/6-em)]](https://www.rsc.org/images/entities/char_2009.gif) 4) solutions. These in situ prepared Zn(II) complexes have achieved highly selective ratiometric fluorescent recognition of histidine even in the presence of other natural amino acids and metal cations. This fluorescent recognition of histidine is visually observable with distinctive color changes from yellow to blue under UV irradiation. The mechanism for the interaction of the Zn(II) complexes with histidine was studied by UV-Vis absorption, NMR and MS.
4) solutions. These in situ prepared Zn(II) complexes have achieved highly selective ratiometric fluorescent recognition of histidine even in the presence of other natural amino acids and metal cations. This fluorescent recognition of histidine is visually observable with distinctive color changes from yellow to blue under UV irradiation. The mechanism for the interaction of the Zn(II) complexes with histidine was studied by UV-Vis absorption, NMR and MS.
1. Introduction
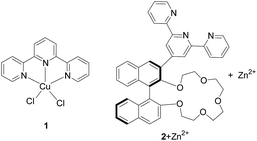
Histidine is an indispensable amino acid for humans and other mammals. It is not only essential for human growth but also acts as a neurotransmitter in the central nervous system of mammals.1 Abnormal levels of histidine in a biological system could indicate a variety of diseases. Therefore, detection of histidine in biological fluids has become an important goal and a number of methods have been developed for this purpose.2–4 Among these methods, using molecular fluorescent sensors have attracted extensive attention due to the high sensitivity of fluorescence, the easy availability of instruments and the potential for remote observation.4Terpyridine (Tpy) is a tridentate chelating ligand capable of binding a variety of metal cations5 and this binding ability has been utilized in sensing.6 We have studied the use of the Tpy metal complexes in the fluorescent recognition of histidine. In our previous work, we have found that the classical TpyCuCl2 complex 1 exhibited greatly enhanced fluorescence when treated with histidine or cysteine (Fig. 1).7a,b It was shown that coordination of Cu(II) with Tpy quenched its fluorescence which can be turned on upon interaction with histidine or cysteine. We further designed a crown ether–Tpy compound 2 and found that its in situ generated Zn(II) complex can distinguish histidine from cysteine as well as other amino acids by showing significant fluorescence enhancement with histidine only.7c In addition, this fluorescent sensor can also differentiate histidine from other imidazole derivatives. This high selectivity is attributed to the cooperative interaction of both the crown ether and the Tpy sites.
When the complexes 1 and 2 + Zn2+ were used to recognize histidine, the fluorescent enhancements were observed at λ ≤ 400 nm. It would be desirable that if the fluorescent response could be observed at longer wavelengths in the visible region under aqueous conditions. In order to shift the fluorescent response to the longer wavelength, we propose to incorporate the Tpy ligand with fluorophores of longer wavelength emission.
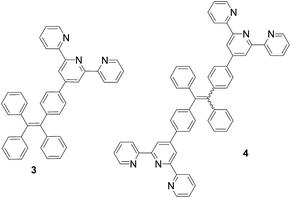
Since 2001, Tang and many research groups have conducted extensive studies on the aggregation-induced emission of organic materials.8 For example, the propeller-shaped molecules such as tetraphenylethene (TPE) exhibit greatly enhanced emission in the visible region when water is added to its THF solution.9 That is, addition of water promotes the aggregation of the TPE molecules, leading to the fluorescent enhancement. In order to utilize the unique fluorescent properties of the TPE molecules under aqueous conditions for the Tpy-based fluorescent recognition, we have synthesized the TPE–Tpy conjugates 3 and 4 and explored their fluorescent response toward metal cations and amino acids (Fig. 2). We have demonstrated that the Zn2+ complexes of these compounds are highly selective ratiometric fluorescent sensors toward histidine. The fluorescent responses are visually observable with distinctive color changes. Herein these results are reported.
2. Results and discussion
2.1. Synthesis of the TPE–monoTpy and –diTpy compounds 3 (ref. 10) and 4
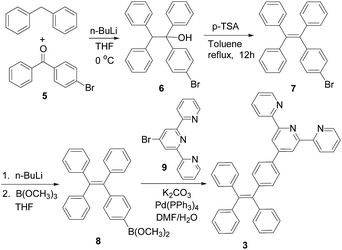
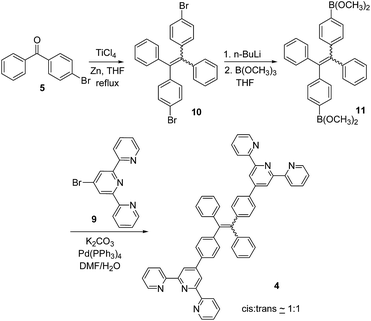
The synthesis of the TPE–monoTpy compound 3 is shown in Scheme 1. Deprotonation of diphenylmethane with n-BuLi followed by addition of the diaryl ketone 5 gave the alcohol 6.11 Dehydration of 6 in the presence of p-toluenesulfonic acid (p-TSA) in refluxing toluene gave the brominated TPE compound 7.11 This compound was then converted to the boronic ester 8 by reaction with n-BuLi and then B(OCH3)3.12 The Suzuki coupling of 8 with 4-bromoTpy 9 gave the desired TPE–monoTpy compound 3.Scheme 2 gives the synthesis of the TPE–diTpy compound 4. The McMurry coupling of the diarylketone 5 in the presence of TiCl4 and Zn gave the dibrominated TPE compound 10.13 This compound was found to be a 1![[thin space (1/6-em)]](https://www.rsc.org/images/entities/char_2009.gif) :
:![[thin space (1/6-em)]](https://www.rsc.org/images/entities/char_2009.gif) 1 mixture of the cis and trans isomers.14 Treatment of 10 with n-BuLi followed by addition of B(OCH3)3 produced the TPE–diboronic ester 11,13 which was then coupled with the 4-bromoTpy 9 in the presence of a palladium catalyst to give the desired compound 4 as a 1
1 mixture of the cis and trans isomers.14 Treatment of 10 with n-BuLi followed by addition of B(OCH3)3 produced the TPE–diboronic ester 11,13 which was then coupled with the 4-bromoTpy 9 in the presence of a palladium catalyst to give the desired compound 4 as a 1![[thin space (1/6-em)]](https://www.rsc.org/images/entities/char_2009.gif) :
:![[thin space (1/6-em)]](https://www.rsc.org/images/entities/char_2009.gif) 1 mixture of the cis and trans isomers.
1 mixture of the cis and trans isomers.
2.2. Study of the interaction of the TPE–diTpy compound 4 with metal ions and amino acids
![[thin space (1/6-em)]](https://www.rsc.org/images/entities/char_2009.gif) :
:![[thin space (1/6-em)]](https://www.rsc.org/images/entities/char_2009.gif) 4. Then the fluorescence showed some decrease when the water fraction was more than 80%. The fluorescent responses of 4 in the THF/water mixed solvents suggest that compound 4 is AIE active.
4. Then the fluorescence showed some decrease when the water fraction was more than 80%. The fluorescent responses of 4 in the THF/water mixed solvents suggest that compound 4 is AIE active.
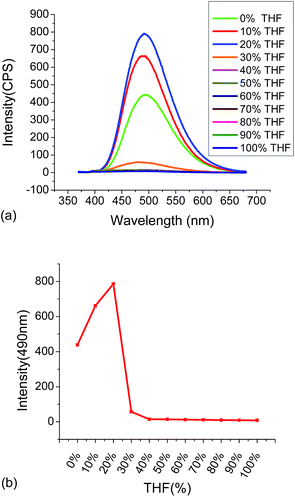 | ||
| Fig. 3 (a) Fluorescent spectra of 4 (1.0 × 10⁻⁵ M) in THF/H2O mixed solvents. (b) The fluorescent intensity of 4 at 495 nm versus the THF fraction (λexc = 355 nm, slits: 2 nm/2 nm). | ||
Compound 4 (1.0 × 10⁻⁵ M in THF![[thin space (1/6-em)]](https://www.rsc.org/images/entities/char_2009.gif) :
:![[thin space (1/6-em)]](https://www.rsc.org/images/entities/char_2009.gif) H2O = 1
H2O = 1![[thin space (1/6-em)]](https://www.rsc.org/images/entities/char_2009.gif) :
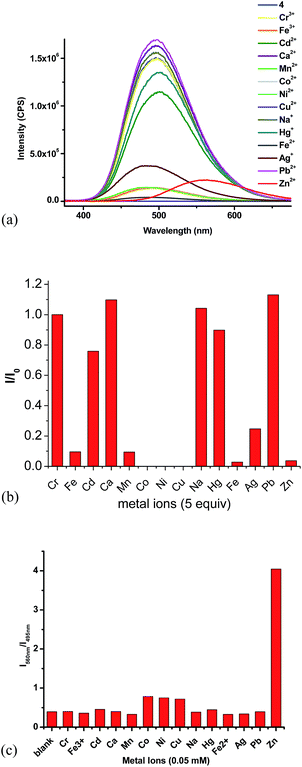
:![[thin space (1/6-em)]](https://www.rsc.org/images/entities/char_2009.gif) 4) showed strong green emission at λ = 495 nm. We studied its interaction with various metal ions, including Zn2+, Cd2+, Cr3+, Al3+, Fe3+, Ag+, Mg2+, Li+, Ni2+, Co2+, Cu2+, Cu2+, K+, Mn2+ and Ca2+ and different fluorescent responses were observed (Fig. 4). Addition of 5 equiv. of Cu2+, Ni2+ or Co2+ completely quenched its fluorescence. Treatment of 4 with 5 equiv. of Fe2+, Mn2+, Fe3+, Zn2+ and Ag+ significantly quenched its fluorescence with I/I0 < 0.1 for Fe2+, Mn2+, Fe3+ and Zn2+, and I/I0 = 0.25 for Ag+. Other metal ions such as Cr3+, Cd2+, Ca2+, Na+, Hg+ and Pb2+ caused much smaller fluorescence changes to 4. Notably, addition of 5 equiv. of Zn2+ to 4 caused red shift of the maximum emission from 495 nm to 560 nm with significantly decreased fluorescence intensity. The plot of the fluorescence intensity ratio I560/I495 of various metals clearly demonstrates the high selectivity for Zn2+ (Fig. 4c). This ratio for Zn2+ is 4.0 while those for all the other metals are lower than 0.8. Thus, the TPE–diTpy compound 4 shows highly ratiometric selective fluorescent response toward Zn2+. In addition, Fig. 8c also demonstrates that with the use of 4, Zn2+ can be successfully differentiated from Cd2+, a common interference for the recognition of Zn2+. Treatment of 4 with Zn2+ led to a visually observable color change from green to yellow under a UV lamp.
4) showed strong green emission at λ = 495 nm. We studied its interaction with various metal ions, including Zn2+, Cd2+, Cr3+, Al3+, Fe3+, Ag+, Mg2+, Li+, Ni2+, Co2+, Cu2+, Cu2+, K+, Mn2+ and Ca2+ and different fluorescent responses were observed (Fig. 4). Addition of 5 equiv. of Cu2+, Ni2+ or Co2+ completely quenched its fluorescence. Treatment of 4 with 5 equiv. of Fe2+, Mn2+, Fe3+, Zn2+ and Ag+ significantly quenched its fluorescence with I/I0 < 0.1 for Fe2+, Mn2+, Fe3+ and Zn2+, and I/I0 = 0.25 for Ag+. Other metal ions such as Cr3+, Cd2+, Ca2+, Na+, Hg+ and Pb2+ caused much smaller fluorescence changes to 4. Notably, addition of 5 equiv. of Zn2+ to 4 caused red shift of the maximum emission from 495 nm to 560 nm with significantly decreased fluorescence intensity. The plot of the fluorescence intensity ratio I560/I495 of various metals clearly demonstrates the high selectivity for Zn2+ (Fig. 4c). This ratio for Zn2+ is 4.0 while those for all the other metals are lower than 0.8. Thus, the TPE–diTpy compound 4 shows highly ratiometric selective fluorescent response toward Zn2+. In addition, Fig. 8c also demonstrates that with the use of 4, Zn2+ can be successfully differentiated from Cd2+, a common interference for the recognition of Zn2+. Treatment of 4 with Zn2+ led to a visually observable color change from green to yellow under a UV lamp.
Fluorescent titration of 4 (1.0 × 10⁻⁵ M in THF![[thin space (1/6-em)]](https://www.rsc.org/images/entities/char_2009.gif) :
:![[thin space (1/6-em)]](https://www.rsc.org/images/entities/char_2009.gif) HEPES = 1
HEPES = 1![[thin space (1/6-em)]](https://www.rsc.org/images/entities/char_2009.gif) :
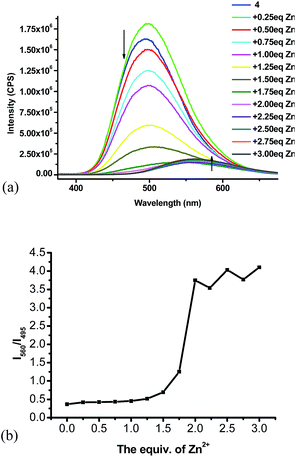
:![[thin space (1/6-em)]](https://www.rsc.org/images/entities/char_2009.gif) 4) with Zn(NO3)2·6H2O was studied.15 As shown in Fig. 5a, the fluorescent intensity of 4 gradually decreased with addition of Zn2+. When more than 1.5 equiv. of Zn2+ was added, the emission maximum was observed to undergo red shift. When more than 2 equiv. of Zn2+ was added, no significant fluorescent change was observed and the emission maximum was at 560 nm. Fig. 5b plots the fluorescent intensity ratio I560/I495 versus the stoichiometry of the Zn2+ added. When more than 2 equiv. of Zn2+ was added, the I560/I495 ratio stabilized at around 3.7.
4) with Zn(NO3)2·6H2O was studied.15 As shown in Fig. 5a, the fluorescent intensity of 4 gradually decreased with addition of Zn2+. When more than 1.5 equiv. of Zn2+ was added, the emission maximum was observed to undergo red shift. When more than 2 equiv. of Zn2+ was added, no significant fluorescent change was observed and the emission maximum was at 560 nm. Fig. 5b plots the fluorescent intensity ratio I560/I495 versus the stoichiometry of the Zn2+ added. When more than 2 equiv. of Zn2+ was added, the I560/I495 ratio stabilized at around 3.7.
In order to determine the stoichiometry for the complexation of 4 with Zn2+, we studied the fluorescent response while maintaining a constant total molar concentration of 4 + Zn2+ and varying their mole fractions. The maximum emission wavelength was employed to make the Job plot (Fig. 6). When the Zn2+ fraction increased from 0.1 to 0.5, the fluorescence emission maximum underwent red shift to 538 nm. Further increase of the Zn2+ concentration caused no more shift in the peak position. The corresponding binding ratio is thus given as 1![[thin space (1/6-em)]](https://www.rsc.org/images/entities/char_2009.gif) :
:![[thin space (1/6-em)]](https://www.rsc.org/images/entities/char_2009.gif) 1 for 4 to Zn2+.
1 for 4 to Zn2+.
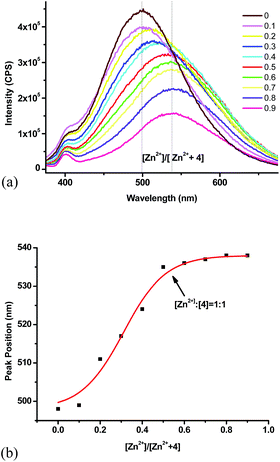 | ||
Fig. 6 (a) Fluorescence spectra of Job plot (total concentration: 1.0 × 10⁻⁵ M). (b) Job plot of 4 with Zn2+ (λexc = 355 nm, slits: 5 nm/5 nm, THF![[thin space (1/6-em)]](https://www.rsc.org/images/entities/char_2009.gif) : :![[thin space (1/6-em)]](https://www.rsc.org/images/entities/char_2009.gif) HEPES = 1 HEPES = 1![[thin space (1/6-em)]](https://www.rsc.org/images/entities/char_2009.gif) : :![[thin space (1/6-em)]](https://www.rsc.org/images/entities/char_2009.gif) 1). 1). | ||
We then studied the fluorescent response of the in situ prepared complex 4 + Zn2+ (2.5 equiv.) toward amino acids and biological amino thiols. In the mixed solvents of THF and water (1![[thin space (1/6-em)]](https://www.rsc.org/images/entities/char_2009.gif) :
:![[thin space (1/6-em)]](https://www.rsc.org/images/entities/char_2009.gif) 4), 4 has poor solubility and emits very strong fluorescence, but its Zn2+ complex can be completely dissolved and emits weaker and red-shifted fluorescence. We thus used THF
4), 4 has poor solubility and emits very strong fluorescence, but its Zn2+ complex can be completely dissolved and emits weaker and red-shifted fluorescence. We thus used THF![[thin space (1/6-em)]](https://www.rsc.org/images/entities/char_2009.gif) :
:![[thin space (1/6-em)]](https://www.rsc.org/images/entities/char_2009.gif) HEPES (1
HEPES (1![[thin space (1/6-em)]](https://www.rsc.org/images/entities/char_2009.gif) :
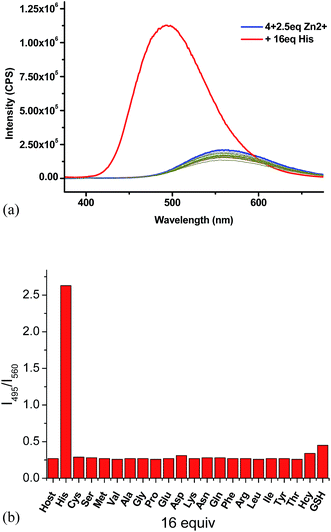
:![[thin space (1/6-em)]](https://www.rsc.org/images/entities/char_2009.gif) 4) as the solvent for the amino acid study while maintaining the pH at 7.4. The fluorescent responses of the 4 + Zn2+ (2.5 equiv.) complex in the presence of 16 equiv. of various amino acids and biological amino thiols including Hcy and GSH were examined (Fig. 7a). Of all the tested amino acids and amino thiols, none of them caused significant fluorescent change except histidine which greatly enhanced the fluorescence and shifted the emission from λ = 560 nm back to λ = 495 nm. The fluorescent intensity ratio I495/I560 of the 4 + Zn2+ complex in the presence of 16 equiv. of histidine is 2.6 and that for all the other amino acids and amino thiols is around 0.3 (Fig. 7b). As shown in Fig. 8, the highly selective fluorescent response of the 4 + Zn2+ complex toward histidine can also be detected visually under UV irradiation (365 nm). That is, only the addition of histidine turned the solution to emit blue-greenish light while the addition of all other amino acids caused no change in the original yellow emission.
4) as the solvent for the amino acid study while maintaining the pH at 7.4. The fluorescent responses of the 4 + Zn2+ (2.5 equiv.) complex in the presence of 16 equiv. of various amino acids and biological amino thiols including Hcy and GSH were examined (Fig. 7a). Of all the tested amino acids and amino thiols, none of them caused significant fluorescent change except histidine which greatly enhanced the fluorescence and shifted the emission from λ = 560 nm back to λ = 495 nm. The fluorescent intensity ratio I495/I560 of the 4 + Zn2+ complex in the presence of 16 equiv. of histidine is 2.6 and that for all the other amino acids and amino thiols is around 0.3 (Fig. 7b). As shown in Fig. 8, the highly selective fluorescent response of the 4 + Zn2+ complex toward histidine can also be detected visually under UV irradiation (365 nm). That is, only the addition of histidine turned the solution to emit blue-greenish light while the addition of all other amino acids caused no change in the original yellow emission.
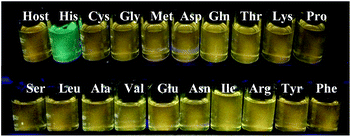 | ||
Fig. 8 Photos of 4 + Zn2+ (2.5 equiv.) (1.0 × 10⁻⁵ M in THF![[thin space (1/6-em)]](https://www.rsc.org/images/entities/char_2009.gif) : :![[thin space (1/6-em)]](https://www.rsc.org/images/entities/char_2009.gif) HEPES = 1 HEPES = 1![[thin space (1/6-em)]](https://www.rsc.org/images/entities/char_2009.gif) : :![[thin space (1/6-em)]](https://www.rsc.org/images/entities/char_2009.gif) 4) in the presence of various amino acids (20 equiv.) under UV irradiation (365 nm). 4) in the presence of various amino acids (20 equiv.) under UV irradiation (365 nm). | ||
We then conducted a fluorescent titration of the 4 + Zn2+ (2.5 equiv.) complex (1.0 × 10⁻⁵ M in THF![[thin space (1/6-em)]](https://www.rsc.org/images/entities/char_2009.gif) :
:![[thin space (1/6-em)]](https://www.rsc.org/images/entities/char_2009.gif) HEPES = 1
HEPES = 1![[thin space (1/6-em)]](https://www.rsc.org/images/entities/char_2009.gif) :
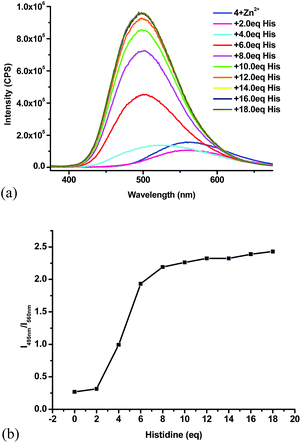
:![[thin space (1/6-em)]](https://www.rsc.org/images/entities/char_2009.gif) 4) with histidine at 2 equiv. increments. As shown in Fig. 9a, the emission of this Zn2+ complex at 560 nm was first slightly quenched with 2 equiv. histidine. With an additional 2 equiv. histidine, the maximum emission underwent significant blue shift. Large fluorescent enhancement was observed with further increased amount of histidine while the emission maximum was shifted to 495 nm. With the addition of more than 16 equiv. of histidine, no more change in fluorescence was observed. Formation of white precipitate was observed with the clear solution gradually turning into a white slurry. Under UV irradiation, it was clearly observed that the yellow solution gradually turned blue greenish. We plotted the fluorescent intensity ratio I495/I560 versus the equiv. of histidine in Fig. 9b. This ratio shows a sharp increase from 0.3 to 2.2 in the range of 2–8 equiv. of histidine, which demonstrates a ratiometric fluorescent response of the 4 + Zn2+ complex toward histidine.
4) with histidine at 2 equiv. increments. As shown in Fig. 9a, the emission of this Zn2+ complex at 560 nm was first slightly quenched with 2 equiv. histidine. With an additional 2 equiv. histidine, the maximum emission underwent significant blue shift. Large fluorescent enhancement was observed with further increased amount of histidine while the emission maximum was shifted to 495 nm. With the addition of more than 16 equiv. of histidine, no more change in fluorescence was observed. Formation of white precipitate was observed with the clear solution gradually turning into a white slurry. Under UV irradiation, it was clearly observed that the yellow solution gradually turned blue greenish. We plotted the fluorescent intensity ratio I495/I560 versus the equiv. of histidine in Fig. 9b. This ratio shows a sharp increase from 0.3 to 2.2 in the range of 2–8 equiv. of histidine, which demonstrates a ratiometric fluorescent response of the 4 + Zn2+ complex toward histidine.
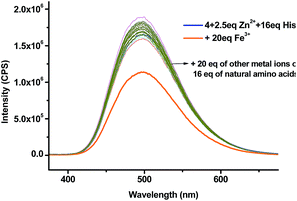
We tested the fluorescence recovery of the 4 + Zn2+ complex in the presence of the mixtures of histidine with other species in biological systems including the common metal ions Mg2+, Fe3+, K+, Ca2+ and Na+, the natural amino acids and amino thiols. The results are summarized in Fig. 10 and Table 1. All the tested metal ions (20 equiv.) except Fe3+ had little effect on the fluorescent recognition of histidine by the Zn2+ complex. Addition of 20 equiv. of Fe3+ partially quenched the fluorescence and the emission wavelength remained. The interference caused by Fe3+ might be attributed to its strong coordination to Tpy. All the other natural amino acids and amino thiols, including the commonly interfering amino acids such as serine and arginine, had little effect on the fluorescent recognition of histidine by the 4 + Zn2+ complex.
![[thin space (1/6-em)]](https://www.rsc.org/images/entities/char_2009.gif) :
:![[thin space (1/6-em)]](https://www.rsc.org/images/entities/char_2009.gif) HEPES = 1
HEPES = 1![[thin space (1/6-em)]](https://www.rsc.org/images/entities/char_2009.gif) :
:![[thin space (1/6-em)]](https://www.rsc.org/images/entities/char_2009.gif) 4) in the presence of the mixtures of 16 equiv. of histidine with metal ions or other natural amino acids. (λexc = 355 nm, slits: 2 nm/2 nm)
4) in the presence of the mixtures of 16 equiv. of histidine with metal ions or other natural amino acids. (λexc = 355 nm, slits: 2 nm/2 nm)
| Added species | Conc. (μM) | Recovery (%) | Added species | Conc. (μM) | Recovery (%) |
|---|---|---|---|---|---|
| Asp | 160 | 110 | Val | 160 | 110 |
| Lys | 160 | 115 | Arg | 160 | 107 |
| Gly | 160 | 101 | Cys | 160 | 109 |
| Ile | 160 | 111 | Met | 160 | 103 |
| Asn | 160 | 108 | Ala | 160 | 102 |
| Gln | 160 | 109 | Hcy | 160 | 109 |
| Tyr | 160 | 109 | GSH | 160 | 116 |
| Phe | 160 | 102 | MgCl2 | 200 | 105 |
| Thr | 160 | 104 | FeCl3 | 200 | 69 |
| Pro | 160 | 102 | KCl | 200 | 105 |
| Leu | 160 | 106 | CaCl2 | 200 | 102 |
| Glu | 160 | 100 | NaCl | 200 | 102 |
| Ser | 160 | 106 |
![[thin space (1/6-em)]](https://www.rsc.org/images/entities/char_2009.gif) :
:![[thin space (1/6-em)]](https://www.rsc.org/images/entities/char_2009.gif) HEPES = 1
HEPES = 1![[thin space (1/6-em)]](https://www.rsc.org/images/entities/char_2009.gif) :
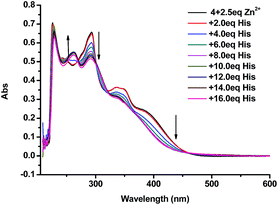
:![[thin space (1/6-em)]](https://www.rsc.org/images/entities/char_2009.gif) 4) showed a sharp peak at 218 nm, broad peaks at 255 nm and 295 nm, and a shoulder at 366 nm. Upon addition of 2.5 equiv. of Zn2+ the broad peaks at 255 nm and 295 nm disappeared and a new peak at 283 nm showed up (Fig. 11). When the 4 + Zn2+ (2.5 equiv.) complex (1.0 × 10⁻⁵ M in THF
4) showed a sharp peak at 218 nm, broad peaks at 255 nm and 295 nm, and a shoulder at 366 nm. Upon addition of 2.5 equiv. of Zn2+ the broad peaks at 255 nm and 295 nm disappeared and a new peak at 283 nm showed up (Fig. 11). When the 4 + Zn2+ (2.5 equiv.) complex (1.0 × 10⁻⁵ M in THF![[thin space (1/6-em)]](https://www.rsc.org/images/entities/char_2009.gif) :
:![[thin space (1/6-em)]](https://www.rsc.org/images/entities/char_2009.gif) HEPES = 1
HEPES = 1![[thin space (1/6-em)]](https://www.rsc.org/images/entities/char_2009.gif) :
:![[thin space (1/6-em)]](https://www.rsc.org/images/entities/char_2009.gif) 4) was titrated with histidine, this new peak at 283 nm gradually decreased and the characteristic absorption of 4 at 255 nm appeared (Fig. 12). This suggests the displacement of the coordinated Zn2+ from the 4 + Zn2+ complex by the amino acid.
4) was titrated with histidine, this new peak at 283 nm gradually decreased and the characteristic absorption of 4 at 255 nm appeared (Fig. 12). This suggests the displacement of the coordinated Zn2+ from the 4 + Zn2+ complex by the amino acid.
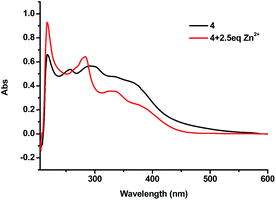 | ||
Fig. 11 UV-Vis spectra of 4 (1.0 × 10⁻⁵ M in THF![[thin space (1/6-em)]](https://www.rsc.org/images/entities/char_2009.gif) : :![[thin space (1/6-em)]](https://www.rsc.org/images/entities/char_2009.gif) HEPES = 1 HEPES = 1![[thin space (1/6-em)]](https://www.rsc.org/images/entities/char_2009.gif) : :![[thin space (1/6-em)]](https://www.rsc.org/images/entities/char_2009.gif) 4) in the absence and presence of 2.5 equiv. of Zn2+. 4) in the absence and presence of 2.5 equiv. of Zn2+. | ||
![[thin space (1/6-em)]](https://www.rsc.org/images/entities/char_2009.gif) :
:![[thin space (1/6-em)]](https://www.rsc.org/images/entities/char_2009.gif) D2O (4
D2O (4![[thin space (1/6-em)]](https://www.rsc.org/images/entities/char_2009.gif) :
:![[thin space (1/6-em)]](https://www.rsc.org/images/entities/char_2009.gif) 1) solution. Broadened peaks and changes in the chemical shifts were observed, indicating coordination of Zn2+ as well as possible formation of multiple complexes. When histidine was added to this system, characteristic singlet peak at δ 9.39 and two doublet peaks at δ 7.91 and 7.85 of 4 gradually reappeared, indicating the release of 4 from its Zn2+ complex.
1) solution. Broadened peaks and changes in the chemical shifts were observed, indicating coordination of Zn2+ as well as possible formation of multiple complexes. When histidine was added to this system, characteristic singlet peak at δ 9.39 and two doublet peaks at δ 7.91 and 7.85 of 4 gradually reappeared, indicating the release of 4 from its Zn2+ complex.
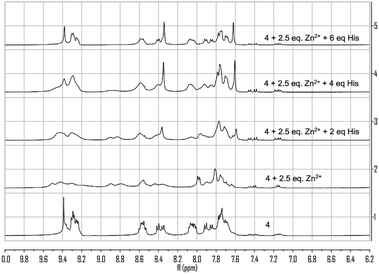 | ||
Fig. 13 1H NMR spectra of 4 with the addition of Zn(NO3)2 (2.5 equiv.) and histidine in THF-d8![[thin space (1/6-em)]](https://www.rsc.org/images/entities/char_2009.gif) : :![[thin space (1/6-em)]](https://www.rsc.org/images/entities/char_2009.gif) D2O (4 D2O (4![[thin space (1/6-em)]](https://www.rsc.org/images/entities/char_2009.gif) : :![[thin space (1/6-em)]](https://www.rsc.org/images/entities/char_2009.gif) 1). 1). | ||
In the mass spectrum obtained for the 4 + Zn2+ (1.5 equiv.) complex in CH3CN![[thin space (1/6-em)]](https://www.rsc.org/images/entities/char_2009.gif) :
:![[thin space (1/6-em)]](https://www.rsc.org/images/entities/char_2009.gif) H2O (4
H2O (4![[thin space (1/6-em)]](https://www.rsc.org/images/entities/char_2009.gif) :
:![[thin space (1/6-em)]](https://www.rsc.org/images/entities/char_2009.gif) 1), a base peak at m/z = 827.28 is assigned to the 2
1), a base peak at m/z = 827.28 is assigned to the 2![[thin space (1/6-em)]](https://www.rsc.org/images/entities/char_2009.gif) :
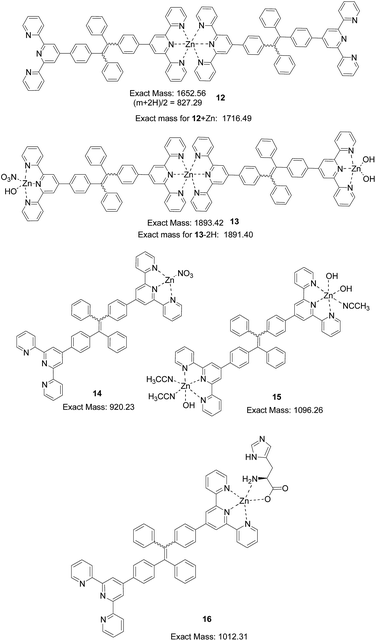
:![[thin space (1/6-em)]](https://www.rsc.org/images/entities/char_2009.gif) 1 complex (12 + 2H)2+(Fig. 14). A peak at 1716.58 can be assigned to that of (12 + Zn)+, a 2
1 complex (12 + 2H)2+(Fig. 14). A peak at 1716.58 can be assigned to that of (12 + Zn)+, a 2![[thin space (1/6-em)]](https://www.rsc.org/images/entities/char_2009.gif) :
:![[thin space (1/6-em)]](https://www.rsc.org/images/entities/char_2009.gif) 2 complex. A peak at m/z = 1891.65 can be assigned to the 2
2 complex. A peak at m/z = 1891.65 can be assigned to the 2![[thin space (1/6-em)]](https://www.rsc.org/images/entities/char_2009.gif) :
:![[thin space (1/6-em)]](https://www.rsc.org/images/entities/char_2009.gif) 3 complex (13 − 2H)+. A peak at 1335.45 can be assigned to a 3
3 complex (13 − 2H)+. A peak at 1335.45 can be assigned to a 3![[thin space (1/6-em)]](https://www.rsc.org/images/entities/char_2009.gif) :
:![[thin space (1/6-em)]](https://www.rsc.org/images/entities/char_2009.gif) 4 complex of (34 + 4Zn + 2OH)2+ (calc.: 2670.65/2). A peak at 920.24 is assigned to the 1
4 complex of (34 + 4Zn + 2OH)2+ (calc.: 2670.65/2). A peak at 920.24 is assigned to the 1![[thin space (1/6-em)]](https://www.rsc.org/images/entities/char_2009.gif) :
:![[thin space (1/6-em)]](https://www.rsc.org/images/entities/char_2009.gif) 1 complex 14. A peak at m/z = 1095.35 is proposed for that of the 1
1 complex 14. A peak at m/z = 1095.35 is proposed for that of the 1![[thin space (1/6-em)]](https://www.rsc.org/images/entities/char_2009.gif) :
:![[thin space (1/6-em)]](https://www.rsc.org/images/entities/char_2009.gif) 2 complex (15 − H)+. With the addition of histidine, the relative intensity of the peak at m/z = 795.32 (4 + H+) gradually increased. A new peak at m/z = 1012.32 assigned to the ternary complex 16 (4 + Zn2+ + His) was also observed with increasing intensity (Fig. 14).
2 complex (15 − H)+. With the addition of histidine, the relative intensity of the peak at m/z = 795.32 (4 + H+) gradually increased. A new peak at m/z = 1012.32 assigned to the ternary complex 16 (4 + Zn2+ + His) was also observed with increasing intensity (Fig. 14).
The observations of the mass, 1H NMR and UV spectroscopic analyses substantiate the hypothesis that addition of histidine to the 4 + Zn2+ complex initially coordinate to the Zn2+ center to form the ternary complex 16 which upon further reaction with histidine displaces the Zn2+ ion off the TPE–diTpy ligand 4. The observed formation of white slurry can be attributed to the formation of 4 which has poor solubility in the reaction media without Zn2+ coordination and exhibits the aggregation induced emission.
2.3. Study of the interaction of the TPE–monoTpy compound 3 with metal ions and amino acids
The TPE–monoTpy compound 3 (1.0 × 10⁻⁵ M in THF![[thin space (1/6-em)]](https://www.rsc.org/images/entities/char_2009.gif) :
:![[thin space (1/6-em)]](https://www.rsc.org/images/entities/char_2009.gif) HEPES = 1
HEPES = 1![[thin space (1/6-em)]](https://www.rsc.org/images/entities/char_2009.gif) :
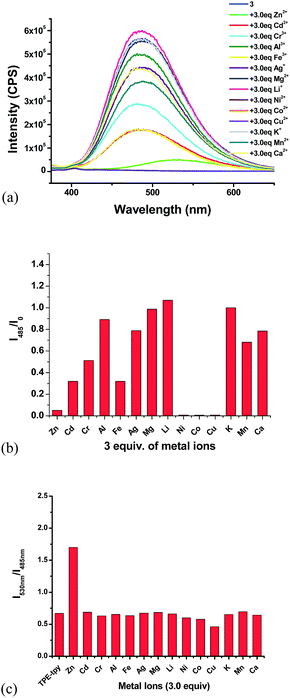
:![[thin space (1/6-em)]](https://www.rsc.org/images/entities/char_2009.gif) 4) shows strong blue-green emission at λ = 485 nm, 10 nm shorter than that of 4 due to the less conjugation. We also studied its interaction with various metal ions (Fig. 15). Similar to 4, addition of 3 equiv. of Cu2+, Ni2+, Co2+ completely quenched its fluorescence. Partial fluorescent quenching was observed for the addition of 3 equiv. of Cd2+ (I485/I0 = 0.32), Cr3+ (I485/I0 = 0.51), Al3+ (I485/I0 = 0.89), Fe3+ (I485/I0 = 0.32), Ag+ (I485/I0 = 0.79), Mn2+ (I485/I0 = 0.68) and Ca2+ (I485/I0 = 0.79). Addition of Mg2+ caused no change to the fluorescence of 3 and Li+ slightly increased its fluorescence. It is notable that addition of 3 equiv. of Zn2+ caused red shift of the emission maximum from 485 nm to 530 nm with significantly decreased fluorescence intensity. Fig. 15c plots the fluorescence intensity ratio I530/I485 of 3 upon addition of various metal ions. This ratio for Zn2+ is as high as 1.7 while that for all the other metals is in the range of 0.5 to 0.7. As shown in Fig. 16, under UV irradiation (365 nm), addition of 3 equiv. Zn2+ to 3 changed the solution from the blue-green emission to a weak yellow emission that was visually observable.
4) shows strong blue-green emission at λ = 485 nm, 10 nm shorter than that of 4 due to the less conjugation. We also studied its interaction with various metal ions (Fig. 15). Similar to 4, addition of 3 equiv. of Cu2+, Ni2+, Co2+ completely quenched its fluorescence. Partial fluorescent quenching was observed for the addition of 3 equiv. of Cd2+ (I485/I0 = 0.32), Cr3+ (I485/I0 = 0.51), Al3+ (I485/I0 = 0.89), Fe3+ (I485/I0 = 0.32), Ag+ (I485/I0 = 0.79), Mn2+ (I485/I0 = 0.68) and Ca2+ (I485/I0 = 0.79). Addition of Mg2+ caused no change to the fluorescence of 3 and Li+ slightly increased its fluorescence. It is notable that addition of 3 equiv. of Zn2+ caused red shift of the emission maximum from 485 nm to 530 nm with significantly decreased fluorescence intensity. Fig. 15c plots the fluorescence intensity ratio I530/I485 of 3 upon addition of various metal ions. This ratio for Zn2+ is as high as 1.7 while that for all the other metals is in the range of 0.5 to 0.7. As shown in Fig. 16, under UV irradiation (365 nm), addition of 3 equiv. Zn2+ to 3 changed the solution from the blue-green emission to a weak yellow emission that was visually observable.
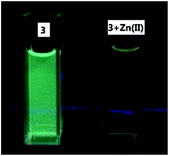 | ||
Fig. 16 Fluorescence of compound 3 (1.0 × 10⁻⁵ M in THF![[thin space (1/6-em)]](https://www.rsc.org/images/entities/char_2009.gif) : :![[thin space (1/6-em)]](https://www.rsc.org/images/entities/char_2009.gif) HEPES = 1 HEPES = 1![[thin space (1/6-em)]](https://www.rsc.org/images/entities/char_2009.gif) : :![[thin space (1/6-em)]](https://www.rsc.org/images/entities/char_2009.gif) 4) in the absence or presence of 3 equiv. of Zn2+ under UV irradiation (365 nm). 4) in the absence or presence of 3 equiv. of Zn2+ under UV irradiation (365 nm). | ||
We then titrated 3 (1.0 × 10⁻⁵ M in THF![[thin space (1/6-em)]](https://www.rsc.org/images/entities/char_2009.gif) :
:![[thin space (1/6-em)]](https://www.rsc.org/images/entities/char_2009.gif) HEPES = 1
HEPES = 1![[thin space (1/6-em)]](https://www.rsc.org/images/entities/char_2009.gif) :
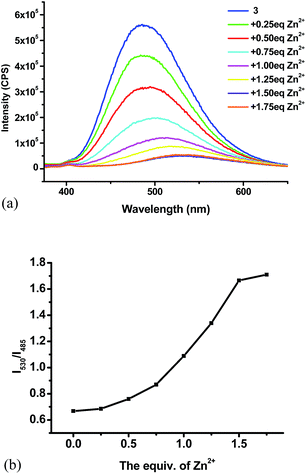
:![[thin space (1/6-em)]](https://www.rsc.org/images/entities/char_2009.gif) 4) with Zn2+ in 0.25 equiv. increment and monitored its fluorescence after each addition.15 As shown in Fig. 17a, the fluorescence of 3 decreased with addition of Zn2+. When 1.5 equiv. of Zn2+ was added, the fluorescence stabilized with the emission maximum shifted to 530 nm. Fig. 17b plots the fluorescence intensity ratio I530/I485 of compound 3 versus the concentration of Zn2+. This ratio first increased and then reached a plateau after 1.5 equiv. of Zn2+.
4) with Zn2+ in 0.25 equiv. increment and monitored its fluorescence after each addition.15 As shown in Fig. 17a, the fluorescence of 3 decreased with addition of Zn2+. When 1.5 equiv. of Zn2+ was added, the fluorescence stabilized with the emission maximum shifted to 530 nm. Fig. 17b plots the fluorescence intensity ratio I530/I485 of compound 3 versus the concentration of Zn2+. This ratio first increased and then reached a plateau after 1.5 equiv. of Zn2+.
We then studied the fluorescent response of the 3 + Zn2+ (1.5 equiv.) complex (1.0 × 10⁻⁵ M in THF![[thin space (1/6-em)]](https://www.rsc.org/images/entities/char_2009.gif) :
:![[thin space (1/6-em)]](https://www.rsc.org/images/entities/char_2009.gif) HEPES = 1
HEPES = 1![[thin space (1/6-em)]](https://www.rsc.org/images/entities/char_2009.gif) :
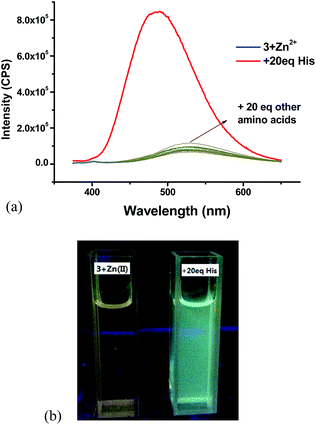
:![[thin space (1/6-em)]](https://www.rsc.org/images/entities/char_2009.gif) 4, prepared in situ) with 20 equiv. of various natural amino acids. As shown in Fig. 18a, this Zn(II) complex exhibited very high selectivity for the fluorescent recognition of histidine. Histidine greatly enhanced the fluorescence of the complex and shifted the emission maximum from 530 nm back to 485 nm while all the other amino acids caused little effect on the fluorescence of the 3 + Zn2+ complex. Fig. 18b shows the color change of the 3 + Zn2+ complex under UV irradiation upon treatment with histidine. Thus, the 3 + Zn2+ complex can also be used for the fluorescent recognition of histidine, similar to that observed for the 4 + Zn2+ complex.
4, prepared in situ) with 20 equiv. of various natural amino acids. As shown in Fig. 18a, this Zn(II) complex exhibited very high selectivity for the fluorescent recognition of histidine. Histidine greatly enhanced the fluorescence of the complex and shifted the emission maximum from 530 nm back to 485 nm while all the other amino acids caused little effect on the fluorescence of the 3 + Zn2+ complex. Fig. 18b shows the color change of the 3 + Zn2+ complex under UV irradiation upon treatment with histidine. Thus, the 3 + Zn2+ complex can also be used for the fluorescent recognition of histidine, similar to that observed for the 4 + Zn2+ complex.
Previously, we reported that the Tpy + CuCl2 complex 1 exhibits large fluorescent enhancement in the presence of histidine and cysteine but not with other amino acids and is useful for the fluorescent recognition of the two amino acids.7a,b Therefore, we also prepared the 3 + CuCl2 complex and studied its fluorescent response toward amino acids. We found that unlike 1 which is highly selective toward histidine and cysteine, the 3 + CuCl2 complex shows poor selectivity in its fluorescent response since many amino acids can turn on its fluorescence without shift in the emission wavelength (Fig. 19). Thus the Cu(II) complex of 3 cannot be used for the fluorescent recognition of histidine. The TPE unit of 3 has greatly altered the fluorescent response of the Tpy–Cu(II) complex in the presence of the amino acids.
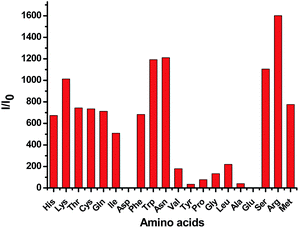 | ||
Fig. 19 Fluorescence enhancement ratio I/I0 at 475 nm of 3 + CuCl2 complex (1.0 × 10⁻⁵ M in H2O![[thin space (1/6-em)]](https://www.rsc.org/images/entities/char_2009.gif) : :![[thin space (1/6-em)]](https://www.rsc.org/images/entities/char_2009.gif) THF = 99 THF = 99![[thin space (1/6-em)]](https://www.rsc.org/images/entities/char_2009.gif) : :![[thin space (1/6-em)]](https://www.rsc.org/images/entities/char_2009.gif) 1) in the presence of 10 equiv. of various amino acids (λexc = 354 nm, slits: 2 nm/2 nm). 1) in the presence of 10 equiv. of various amino acids (λexc = 354 nm, slits: 2 nm/2 nm). | ||
3. Conclusions
We have synthesized two TPE–Tpy compounds 3 and 4 which show significant red shift in emission upon coordination to Zn(NO3)2 in THF![[thin space (1/6-em)]](https://www.rsc.org/images/entities/char_2009.gif) :
:![[thin space (1/6-em)]](https://www.rsc.org/images/entities/char_2009.gif) HEPES (1
HEPES (1![[thin space (1/6-em)]](https://www.rsc.org/images/entities/char_2009.gif) :
:![[thin space (1/6-em)]](https://www.rsc.org/images/entities/char_2009.gif) 4) solution. This change is visually observable from blue greenish color to yellow upon UV irradiation. The in situ prepared Zn(II) complexes 3 + Zn2+ and 4 + Zn2+ in THF
4) solution. This change is visually observable from blue greenish color to yellow upon UV irradiation. The in situ prepared Zn(II) complexes 3 + Zn2+ and 4 + Zn2+ in THF![[thin space (1/6-em)]](https://www.rsc.org/images/entities/char_2009.gif) :
:![[thin space (1/6-em)]](https://www.rsc.org/images/entities/char_2009.gif) HEPES (1
HEPES (1![[thin space (1/6-em)]](https://www.rsc.org/images/entities/char_2009.gif) :
:![[thin space (1/6-em)]](https://www.rsc.org/images/entities/char_2009.gif) 4) have achieved highly selective ratiometric fluorescent recognition of histidine even in the presence of other natural amino acids, amino thiols and metal cations. Comparison of Fig. 7a with Fig. 18a indicates that the diTpy compound 4 in combination with Zn2+ should be a more sensitive fluorescent sensor because of higher fluorescent intensity upon histidine binding than the monoTpy complex 3 + Zn2+. The ratiometric fluorescent response and the high selectivity of these complexes make them useful for the fluorescent detection of histidine. On the basis of the UV, 1H NMR and mass spectroscopic analyses, it is proposed that the observed highly selective fluorescent response of the 4 + Zn2+ complex toward histidine should be due to the coordination of histidine to the Zn2+ center of the complex followed by displacement of 4 off to restore its aggregation induced emission.
4) have achieved highly selective ratiometric fluorescent recognition of histidine even in the presence of other natural amino acids, amino thiols and metal cations. Comparison of Fig. 7a with Fig. 18a indicates that the diTpy compound 4 in combination with Zn2+ should be a more sensitive fluorescent sensor because of higher fluorescent intensity upon histidine binding than the monoTpy complex 3 + Zn2+. The ratiometric fluorescent response and the high selectivity of these complexes make them useful for the fluorescent detection of histidine. On the basis of the UV, 1H NMR and mass spectroscopic analyses, it is proposed that the observed highly selective fluorescent response of the 4 + Zn2+ complex toward histidine should be due to the coordination of histidine to the Zn2+ center of the complex followed by displacement of 4 off to restore its aggregation induced emission.
4. Experimental section
4.1. General data
Unless otherwise noted, materials were obtained from commercial suppliers and were used without further purification. All the solvents were dried according to the standard methods prior to use. In the optical spectroscopic studies, all the solvents were either HPLC or spectroscopic grade. In the syntheses of compounds 3 and 4, THF was distilled over sodium and benzophenone under nitrogen atmosphere and stored over 4 Å molecular sieves.1H and 13C NMR spectra were measured on a Bruker AM400 NMR spectrometer. 1H chemical shifts of NMR spectra were given in ppm relative to internals reference TMS (1H, 0.00 ppm). ESI-MS and HRMS spectral data were recorded on a Finnigan LCQDECA and a BrukerDaltonics Bio TOF mass spectrometer, respectively. UV-Vis absorption spectra were recorded on a Hitachi U1900 spectrometer. Fluorescence emission spectra were obtained using FluoroMax-4 Spectrofluorophotometer (HORIBA JobinYvon) at 298 K. pH was taken on an ARK PHS-2C pH meter.
4.2. Synthesis and characterization of 3
(a) Under nitrogen, to a THF (100 mL) solution of diphenylmethane (2.0 g, 12.0 mmol) was added n-BuLi (6.0 mL, 2.5 M in hexane solution, 15.0 mmol) dropwise. After the mixture was stirred at room temperature for 3 h, a THF (20 mL) solution of 5 (3.1 g, 12.0 mmol) was added dropwise to the reaction mixture. The resulting solution was stirred at room temperature for 8 h, and then quenched with saturated NH4Cl solution (10 mL). After extraction with CH2Cl2 (50 mL × 3), the combined organic layer was washed with brine and dried over anhydrous Na2SO4. Filtration followed by evaporation of the solvent and purification of the residue by flash column chromatography on silica gel eluted with petroleum/ethyl acetate (10/1) gave 6 as a white solid. (b) Compound 6 was then dissolved in toluene (50 mL) to which p-toluenesulfonic acid (3.0 g, 17.4 mmol) was added. The reaction mixture was heated at reflux for 8 h. After cooled down to room temperature, the reaction mixture was extracted with CH2Cl2 (3 × 30 mL). The organic layer was collected and concentrated. The crude product was purified by column chromatography on silica gel using hexane as eluent to give product 7 as a white solid (1.1 g). The combined yield of the two steps was 24%. (c) Under nitrogen, 7 (500 mg, 1.2 mmol) was dissolved in THF (50 mL) and the temperature was lowered to −78 °C. n-BuLi (0.58 mL, 2.5 M in hexane, 1.45 mmol) was slowly added to the mixture and after 1 h B(OCH3)3 (0.2 mL, 1.8 mmol) was added slowly. The reaction mixture was stirred at −78 °C for 1 h and then the temperature was increased to room temperature. After stirred for 8 h, the reaction was quenched with saturated NH4Cl solution (5 mL) and extracted with CH2Cl2 (3 × 30 mL). The combined organic layer was washed with brine (30 mL) and dried over anhydrous Na2SO4. After evaporation of the solvent, the residue was purified by flash column chromatography on silica gel eluted with petroleum ether/ethyl acetate (5/1) to afford 8 as a white solid (201.1 mg) in 41% yield. (d) Under nitrogen, compound 8 (200 mg, 0.5 mmol) was dissolved in DMF (20 mL) and water (3.6 mL) was added as a cosolvent. Compound 9 (185 mg, 0.6 mmol), K2CO3 (1.0 g, 7.2 mmol) and Pd(PPh3)4 (110 mg, 0.1 mmol) were added to the solution. Then the reaction mixture was heated to 80 °C and stirred for 8 h. The reaction was extracted with CH2Cl2 (3 × 30 mL). The combined organic layer was washed with brine (30 mL) and dried over anhydrous Na2SO4. After evaporation of the solvent, the residue was purified by flash column chromatography on silica gel eluted with petroleum ether/ethyl acetate (3/1) to afford 3 as a light yellow solid (92 mg) in 33% yield. 1H NMR (CDCl3, 400 MHz) δ 8.09 (d, 2H, J = 4.8 Hz), 8.67–8.65 (m, 4H), 7.87 (td, 2H, J = 7.8, 1.6 Hz), 7.65 (d, 2H, J = 8.4 Hz), 7.36–7.33 (m, 2H), 7.17–7.04 (m, 17H). 13C NMR (CDCl3, 100 MHz) δ 156.27, 155.82, 150.00, 149.11, 144.75, 143.53, 143.49, 141.57, 140.28, 136.88, 136.24, 131.93, 131.41, 131.35, 131.33, 127.86, 127.75, 127.67, 126.62, 126.58, 126.53, 123.81, 121.34, 118.72. HR-MS (ES+) calculated for C41H29N3 (M + H) 564.2434 and (M + Na) 586.2254, found 564.2430 and 586.2272.4.3. Synthesis and characterization of 4
(a) Under nitrogen, to a THF (100 mL) solution of 5 (5.0 g, 19.0 mmol) were added TiCl4 (2.1 mL, 19.0 mmol) and Zn (3.1 g, 47.7 mmol). The mixture was heated at reflux for 20 h and then filtered. The filtrate was evaporated and purified by column chromatography on silica gel eluted with petroleum ether to afford 10 as a white solid in 95% yield (4.5 g). 1H NMR (CDCl3, 400 MHz) δ 7.25 (d, J = 8.2 Hz, 4H), 7.21 (d, J = 8.2 Hz, 4H), 7.14 (t, J = 3.2 Hz, 6H), 7.10 (t, J = 3.2 Hz, 6H), 6.97–7.02 (m, 8H), 6.89 (d, J = 8.4 Hz, 4H), 6.87 (d, J = 8.4 Hz, 4H). 13C NMR (CDCl3, 100 MHz) 142.92, 142.82, 142.38, 142.29, 140.27, 132.90, 132.88, 131.22, 131.20, 131.10, 130.90, 128.02, 127.82, 126.95, 126.84, 120.78, 120.65. (b) Under nitrogen, a THF (50 mL) solution of 10 (0.99 g, 2.0 mmol) was dissolved in THF (50 mL) and the temperature was lowered to −78 °C. n-BuLi (2.4 mL, 2.5 M in hexane, 6.0 mmol) was slowly added to the mixture. After 1 h, B(OCH3)3 (1.15 mL, 10.0 mmol) was added slowly. The reaction mixture was stirred at −78 °C for 1 h and then warmed up to room temperature. After stirred for 8 h, the reaction mixture was quenched with saturated NH4Cl solution (5 mL) and extracted with CH2Cl2 (3 × 30 mL). The combined organic layer was washed with brine (30 mL) and dried over anhydrous Na2SO4. After filtration and evaporation of the solvent, the residue was purified by flash column chromatography on silica gel eluted with petroleum/ethyl acetate (5/1) to afford 11 as a white solid (0.47 g) in 49% yield. (c) Under nitrogen, compound 11 (500 mg, 1.05 mmol) was dissolved in DMF (20 mL) and water (6 mL). Compound 9 (660 mg, 2.1 mmol), K2CO3 (1.6 g, 11.6 mmol) and Pd(PPh3)4 (150 mg, 0.13 mmol) were added to the solution. After the reaction mixture was heated at 80 °C with stirring for 8 h, it was extracted with CH2Cl2 (3 × 30 mL). The combined organic layer was washed with brine (30 mL) and dried over anhydrous Na2SO4. After filtration and evaporation of the solvent, the residue was purified by flash column chromatography on silica gel eluted with petroleum/ethyl acetate (5/1) to afford 4 as a light yellow solid in 27% yield (0.215 g). 1H NMR (CDCl3, 400 MHz) δ 8.72–8.62 (m, 12H), 7.89–7.82 (m, 4H), 7.72–7.66 (m, 4H), 7.35–7.26 (m, 4H), 7.24–7.09 (m, 14H). 13C NMR (CDCl3, 100 MHz) 156.31, 156.28, 155.85, 155.83, 149.99, 149.88, 149.13, 149.10, 144.67, 144.60, 143.45, 143.34, 140.94, 140.92, 136.89, 136.80, 136.54, 136.38, 131.98, 131.96, 131.45, 131.44, 127.99, 127.80, 126.91, 126.88, 126.72, 126.67, 123.82, 123.71, 121.35, 121.31, 118.84, 118.75. HR-MS (ES+) calculated for C56H38N6 (M + H) 795.3231 and (M + Na) 817.3050, found 795.3235 and 817.30355.4.4. Preparation of samples of 4 + Zn2+ (2.5 equiv.) complex (1.0 × 10⁻⁵ M in THF![[thin space (1/6-em)]](https://www.rsc.org/images/entities/h3_char_2009.gif) :
:![[thin space (1/6-em)]](https://www.rsc.org/images/entities/h3_char_2009.gif) HEPES = 1
HEPES = 1![[thin space (1/6-em)]](https://www.rsc.org/images/entities/h3_char_2009.gif) :
:![[thin space (1/6-em)]](https://www.rsc.org/images/entities/h3_char_2009.gif) 4)
4)
A portion (0.5 mL) of a stock solution of 4 (1.6 mg/1.0 mL, 2.0 mM in THF) was transferred to a 100 mL volumetric flask, to which was added a solution (100 μL) of Zn(NO3)2 (c = 74.4 mg/10 mL, 0.025 M in H2O). Then, 20 mL THF was added and the flask was filled to 100 mL with a HEPES buffer solution.
4.5. Preparation of samples for Job plot (total concentration: 1.0 × 10⁻⁵ M in THF![[thin space (1/6-em)]](https://www.rsc.org/images/entities/h3_char_2009.gif) :
:![[thin space (1/6-em)]](https://www.rsc.org/images/entities/h3_char_2009.gif) HEPES = 1
HEPES = 1![[thin space (1/6-em)]](https://www.rsc.org/images/entities/h3_char_2009.gif) :
:![[thin space (1/6-em)]](https://www.rsc.org/images/entities/h3_char_2009.gif) 1)
1)
A stock solution of 4 (1.0 mg/1.0 mL, 1.25 mM in THF) and a stock solution of Zn(NO3)2 (1.5 mg/10.0 mL, 0.50 mM in HEPES) were prepared. These two stock solutions were mixed in 10 mL test tubes according to Table 2. Then 2.5 mL THF and 2.5 mL HEPES were added to the test tubes.
| Sample no. | 4 (μL) | Zn(NO3)2·6H2O (μL) |
|---|---|---|
| 1 | 40 | 0 |
| 2 | 36 | 10 |
| 3 | 32 | 20 |
| 4 | 28 | 30 |
| 5 | 24 | 40 |
| 6 | 20 | 50 |
| 7 | 16 | 60 |
| 8 | 12 | 70 |
| 9 | 8 | 80 |
| 10 | 4 | 90 |
4.6. Preparation of samples for mass spectral analyses
A stock solution of 4 (1.6 mg/10.0 mL, 0.20 mM in CH3CN) was prepared. A portion of this solution (5.0 mL) was transferred to another 10.0 mL volumetric flask to which was added a solution (300 μL) of Zn(NO3)2 (c = 15.0 mg/10 mL, 5.0 mM in H2O). Then CH3CN (3.0 mL) was added and the flask was filled with H2O. Four portions of this solution (1.0 mL each) were combined with 0, 50, 100 and 150 μL of a histidine solution (c = 16.0 mg/10.0 mL, 10.0 mM in H2O) respectively. The mass spectra of these solutions were then obtained.Acknowledgements
This work was financially supported by the National Program on Key Basic Research Project of China (973 Program, 2013CB328900), and the National Science Foundation of China (No. 21502127, 21321061 and J1103315).References and notes
- (a) S. E. Snyderman, A. Boyer, E. Roitman, L. E. Holt Jr and P. H. Prose, Pediatrics, 1963, 31, 786–801 CAS; (b) J. D. Kopple and M. E. Swendseid, J. Clin. Invest., 1975, 55, 881–891 CrossRef CAS PubMed; (c) Y. Kusakari, S. Nishikawa, S. Ishiguro and M. Tamai, Curr. Eye Res., 1997, 16, 600–604 CrossRef CAS PubMed.
- Selected references for detection of histidine: (a) T. Grawe, T. Schrader, P. Finocchiaro, G. Consiglio and S. Failla, Org. Lett., 2001, 3, 1597–1600 CrossRef CAS PubMed; (b) Z. H. Zhang, H. P. Liao, H. Li, L. H. Nie and S. Z. Yao, Anal. Biochem., 2005, 336, 108–116 CrossRef CAS PubMed; (c) G. Patel and S. Menon, Chem. Commun., 2009, 3563–3565 RSC; (d) B. B. Prasad, S. Srivastava, K. Tiwari and P. S. Sharma, Mater. Sci. Eng., C, 2009, 29, 1781–1789 CrossRef CAS; (e) G. Balakrishnan, A. A. Jarzecki, Q. Wu, P. M. Kozlowski, D. Wang and T. G. Spiro, J. Phys. Chem. B, 2012, 116, 9387–9395 CrossRef CAS PubMed; (f) A. Kugimiya and E. Takamitsu, Mater. Sci. Eng., C, 2013, 33, 4867–4870 CrossRef CAS PubMed; (g) A. Contino, G. Maccarrone, M. Zimbone, P. Musumeci, A. Giuffrida and L. Calcagno, Anal. Bioanal. Chem., 2014, 406, 481–491 CrossRef CAS PubMed; (h) J. Zhou, K. Xu, P. Zhou, O. Zheng, Z. Lin, L. Guo, B. Qiu and G. Chen, Biosens. Bioelectron., 2014, 51, 386–390 CrossRef CAS PubMed.
- For fluorescent sensing of histidine: (a) M. A. Hortala, L. Fabbrizzi, N. Marcotte, F. Stomeo and A. Taglietti, J. Am. Chem. Soc., 2003, 125, 20–21 CrossRef CAS PubMed; (b) Y. Fu, H. Li and W. Hu, Sens. Actuators, B, 2008, 131, 167–173 CrossRef CAS; (c) R.-M. Kong, X.-B. Zhang, Z. Chen, H.-M. Meng, Z.-L. Song, W. Tan, G.-L. Shen and R.-Q. Yu, Anal. Chem., 2011, 83, 7603–7607 CrossRef CAS PubMed; (d) L. Xu, Y. Xu, W. Zhu, B. Zeng, C. Yang, B. Wu and X. Qian, Org. Biomol. Chem., 2011, 9, 8284–8287 RSC; (e) R. K. Pathak, K. Tabbasum, A. Rai, D. Panda and C. P. Rao, Analyst, 2012, 137, 4069–4075 RSC; (f) I. A. Azath and K. Pitchumani, Sens. Actuators, B, 2013, 188, 59–64 CrossRef CAS; (g) H.-Z. He, M. Wang, D. S.-H. Chan, C.-H. Leung, J.-W. Qiu and D.-L. Ma, Methods, 2013, 64, 205–211 CrossRef CAS PubMed; (h) S.-Y. Jiao, L.-L. Peng, K. Li, Y.-M. Xie, M.-Z. Ao, X. Wang and X.-Q. Yu, Analyst, 2013, 138, 5762–5768 RSC; (i) E. Oliveira, C. Santos, P. Poeta, J. L. Capelo and C. Lodeiro, Analyst, 2013, 138, 3642–3645 RSC; (j) G. Xiang, S. Lin, W. Cui, L. Wang, L. Zhou, L. Li and D. Cao, Sens. Actuators, B, 2013, 188, 540–547 CrossRef CAS; (k) N. B. Amaral, S. Zuliani, V. Guieu, C. Ravelet, S. Perrier and E. Peyrin, Anal. Bioanal. Chem., 2014, 406, 1173–1179 CrossRef PubMed; (l) X. Wang, Q. Miao, T. Song, Q. Yuan, J. Gao and G. Liang, Analyst, 2014, 139, 3360–3364 RSC; (m) Q.-H. You, A. W.-M. Lee, W.-H. Chan, X.-M. Zhu and K. C.-F. Leung, Chem. Commun., 2014, 50, 6207–6210 RSC; (n) U. G. Reddy, H. Agarwalla, N. Taye, S. Ghorai, S. Chattopadhyay and A. Das, Chem. Commun., 2014, 50, 9899–9902 RSC; (o) P. G. Sutariya, A. Pandya, A. Lodha and S. K. Menon, Analyst, 2014, 139, 4794–4798 RSC; (p) T. Chen, L. Yin, C. Huang, Y. Qin, W. Zhu, Y. Xu and X. Qian, Biosens. Bioelectron., 2015, 66, 259–265 CrossRef CAS PubMed; (q) H.-I. Un, S. Wu, C.-B. Huang, Z. Xu and L. Xu, Chem. Commun., 2015, 51, 3143–3146 RSC; (r) X. Zheng, T. Yao, Y. Zhu and S. Shi, Biosens. Bioelectron., 2015, 66, 103–108 CrossRef CAS PubMed.
- For reviews on fluorescent recognition of amino acids: (a) L. Fabbrizzi, M. Licchelli, G. Rabaioli and A. Taglietti, Coord. Chem. Rev., 2000, 205, 85–108 CrossRef CAS; (b) J. W. Bell and N. M. Hext, Chem. Soc. Rev., 2004, 33, 589–598 Search PubMed; (c) I. L. Medintz, Trends Biotechnol., 2006, 24, 539–542 CrossRef CAS PubMed; (d) G. J. Mohr, Anal. Bioanal. Chem., 2006, 386, 1201–1214 CrossRef CAS PubMed; (e) X. Chen, Y. Zhou, X. Peng and J. Yoon, Chem. Soc. Rev., 2010, 39, 2120–2135 RSC; (f) R. M. Duke, E. B. Veale, F. M. Pfeffer, P. E. Kruger and T. Gunnlaugsson, Chem. Soc. Rev., 2010, 39, 3936–3953 RSC; (g) Y. Zhou and J. Yoon, Chem. Soc. Rev., 2012, 41, 52–67 RSC; (h) M. Dutta and D. Das, J. Indian Chem. Soc., 2013, 90, 9–25 CAS.
- For reviews on terpyridine metal complexes: (a) E. C. Constable, Adv. Inorg. Chem., 1986, 30, 69–121 CAS; (b) P. R. Andres and U. S. Schubert, Adv. Mater., 2004, 16, 1043–1068 CrossRef CAS; (c) E. Baranoff, J. P. Collin, L. Flamigni and J. P. Sauvage, Chem. Soc. Rev., 2004, 33, 147–155 RSC; (d) H. Hofmeier and U. S. Schubert, Chem. Soc. Rev., 2004, 33, 373–399 RSC; (e) I. Eryazici, C. N. Moorefield and G. R. Newkome, Chem. Rev., 2008, 108, 1834–1895 CrossRef CAS PubMed; (f) L. Flamigni, J.-P. Collin and J.-P. Sauvage, Acc. Chem. Res., 2008, 41, 857–871 CrossRef CAS PubMed; (g) S. D. Cummings, Coord. Chem. Rev., 2009, 253, 449–478 CrossRef CAS; (h) U. S. Schubert, H. Hofmeier and G. R. Newkome, Modern Terpyridine Chemistry, Wiley-VCH, Weinheim, 2006 Search PubMed; (i) E. C. Constable, Chem. Soc. Rev., 2007, 36, 246–253 RSC; (j) A. Wild, A. Winter, F. Schlütter and U. S. Schubert, Chem. Soc. Rev., 2011, 40, 1459–1511 RSC.
- Selected references on Tpy-based sensors: (a) S. M. Brombosz, A. J. Zucchero, R. L. Phillips, D. Vazquez, A. Wilson and U. H. F. Bunz, Org. Lett., 2007, 9, 4519–4522 CrossRef CAS PubMed; (b) B. Tang, F.-B. Yu, P. Li, L. Tong, X. Duan, T. Xie and X. Wang, J. Am. Chem. Soc., 2009, 131, 3016–3023 CrossRef CAS PubMed; (c) K. M. C. Wong, and and V. W. W. Yam, Coord. Chem. Rev., 2007, 251, 2477–2488 CrossRef CAS; (d) H. Aiet-Haddou, S. L. Wiskur, V. M. Lynch and E. V. Anslyn, J. Am. Chem. Soc., 2001, 123, 11296–11297 CrossRef CAS; (e) T. J. Wadas, Q. M. Wang, Y. J. Kim, C. Flaschenreim, T. N. Blanton and R. Eisenberg, J. Am. Chem. Soc., 2004, 126, 16841–16849 CrossRef CAS PubMed; (f) C. J. R. Galan-Mascaros, C. Marti-Gastaldo, E. Palomares, J. R. Durrant, R. Vilar, M. Gratzel and M. K. Nazeeruddin, J. Am. Chem. Soc., 2005, 127, 12351–12356 CrossRef PubMed; (g) M. Schmittel, V. Kalsani, P. Mal and J. W. Bats, Inorg. Chem., 2006, 45, 6370–6377 CrossRef CAS PubMed.
- (a) Z. Huang, J. Du, J. Zhang, X.-Q. Yu and L. Pu, Chem. Commun., 2012, 48, 3412–3414 RSC; (b) X.-Y. Zhou, Z. Huang, Y. Cao, S. S. Yu, X. Q. Yu, G. Zhao and L. Pu, RSC Adv., 2015, 5, 53905–53910 RSC; (c) J. Du, Z. Huang, X.-Q. Yu and L. Pu, Chem. Commun., 2013, 49, 5399–5401 RSC.
- For reviews on aggregation induced emission, see: (a) Y. Hong, J. W. Y. Lam and B. Z. Tang, Chem. Commun., 2009, 4332–4353 RSC; (b) Y. Hong, J. W. Y. Lam and B. Z. Tang, Chem. Soc. Rev., 2011, 40, 5361–5388 RSC; (c) D. Ding, K. Li, B. Liu and B. Z. Tang, Acc. Chem. Res., 2013, 46, 2441–2453 CrossRef CAS PubMed; (d) R. Hu, N. L. C. Leung and B. Z. Tang, Chem. Soc. Rev., 2014, 43, 4494–4562 RSC; (e) J. Mei, Y. Hong, J. W. Y. Lam, A. Qin, Y. Tang and B. Z. Tang, Adv. Mater., 2014, 26, 5429–5479 CrossRef CAS PubMed.
- Selected references on the TPE-based fluorescent materials: (a) H. Tong, Y. Hong, Y. Dong, M. Haeussler, Z. Li, J. W. Y. Lam, Y. Dong, H. H. Y. Sung, I. D. Williams and B. Z. Tang, J. Phys. Chem. B, 2007, 111, 11817–11823 CrossRef CAS PubMed; (b) M. Wang, G. Zhang, D. Zhang, D. Zhu and B. Z. Tang, J. Mater. Chem., 2010, 20, 1858–1867 RSC; (c) Y. Liu, C. Deng, L. Tang, A. Qin, R. Hu, J. Z. Sun and B. Z. Tang, J. Am. Chem. Soc., 2011, 133, 660–663 CrossRef CAS PubMed; (d) J. Wang, J. Mei, R. Hu, J. Z. Sun, A. Qin and B. Z. Tang, J. Am. Chem. Soc., 2012, 134, 9956–9966 CrossRef CAS PubMed; (e) Y. Hong, S. Chen, C. W. T. Leung, J. W. Y. Lam, J. Liu, N.-W. Tseng, R. T. K. Kwok, Y. Yu, Z. Wang and B. Z. Tang, ACS Appl. Mater. Interfaces, 2011, 3, 3411–3418 CrossRef CAS PubMed.
- (a) H. Xu, Y. Zhang, P. Jiao, J. Deng and H. Huang, China Patent, CN102964366A, 2013, p. 14; (b) Y. Zhang, H. Xu, P. Jiao and J. Deng, China Patent, CN104177389A, 2014, p. 23.
- M. Banerjee, S. J. Emond, S. V. Lindeman and R. Rathore, J. Org. Chem., 2007, 72, 8054–8061 CrossRef CAS PubMed.
- W. Z. Yuan, P. Lu, S. Chen, J. W. Y. Lam, Z. Wang, Y. Liu, H. S. Kwok, Y. Ma and B. Z. Tang, Adv. Mater., 2010, 22, 2159–2163 CrossRef CAS PubMed.
- (a) Y. Hong, S. Chen, C. W. T. Leung, J. W. Y. Lam, J. Liu, N.-W. Tseng, R. T. K. Kwok, Y. Yu, Z. Wang and B. Z. Tang, ACS Appl. Mater. Interfaces, 2011, 3, 3411–3418 CrossRef CAS PubMed; (b) Y. Xu, L. Chen, Z. Guo, A. Nagai and D. Jiang, J. Am. Chem. Soc., 2011, 133, 17622–17625 CrossRef CAS PubMed.
- R. Daik, W. J. Feast, A. S. Batsanov and J. A. K. Howard, New J. Chem., 1998, 22, 1047–1049 RSC.
- References on the fluorescent response of Tpy derivatives toward Zn2+: (a) G. Albano, V. Balzani, E. C. Constable, M. Maestri and D. R. Smith, Inorg. Chim. Acta, 1998, 277, 225–231 CrossRef CAS; (b) C. Goze, G. Ulrich, L. Charbonnière, M. Cesario, T. Prangè and R. Ziessel, Chem.–Eur. J., 2003, 9, 3748–3755 CrossRef CAS PubMed; (c) F. Barigelletti, L. Flamigni, G. Calogero, L. Hammarström, J. P. Sauvage and J. P. Collin, Chem. Commun., 1998, 2333–2334 RSC; (d) W. Goodall and J. A. Williams, Chem. Commun., 2001, 2514–2515 RSC.
Footnote |
| † Electronic supplementary information (ESI) available. See DOI: 10.1039/c6ra03724k |
| This journal is © The Royal Society of Chemistry 2016 |

