 Open Access Article
Creative Commons Attribution 3.0 Unported Licence
Photocatalytic H2 generation over In2TiO5, Ni substituted In2TiO5 and NiTiO3 – a combined theoretical and experimental study
A. M.
Banerjee
a,
M. R.
Pai
*a,
A.
Arya
b and
S. R.
Bharadwaj
a
a3-189 H Modular Labs, Fuel Cell Materials and Catalysis Section, Chemistry Division, Bhabha Atomic Research Centre, Trombay, Mumbai–400085, India. E-mail: mrinalr@barc.gov.in; mrinalpai9@gmail.com; Fax: +91 22 25505151; Tel: +91 22 25592288
bMaterial Science Division, Bhabha Atomic Research Centre, Trombay, Mumbai–400085, India
First published on 7th July 2015
Abstract
We report here the role of Ni substitution in modifying the crystal structure, optical absorption properties and electronic properties of indium titanate, In2(1−x)Ni2xTiO5−δ (0.0 ≤ 2x ≤ 0.4) and its consequent effect on the photocatalytic properties for H2 generation. Rietveld refinement of observed XRD patterns of the titanates revealed that Ni2+ substitution has led to a decrease in lattice cell parameters and cell volume, contraction of InO6 octahedra and consequently improved charge carrier properties. Furthermore, the conduction band maximum (CBM) was found to be a hybrid state between Ni, Ti and In orbitals in 10% Ni-doped sample, which suggests that the photo-induced charges can be better transported in the substituted samples from zigzag chains of [·Ni–O–Ti⋯In–O–Ti----]. The UV-visible diffuse reflectance spectra exhibited that the band gap of the indium titanate phase decreased sequentially with an increase in the extent of Ni substitution. The underlying cause for band gap narrowing on Ni substitution was evaluated from plane wave based DFT calculations using the GGA + U approach. The decreasing order of photocatalytic activity (as a percentage of Ni substitution) for hydrogen generation from water–methanol mixture is as follows: 10% > 5% > indium titanate > 15% > 20%. The fall in activity below indium titanate coincided with the appearance of ilmenite NiTiO3 phase. Plane wave based DFT calculations performed on NiTiO3 revealed that strong intermixing of Ni-3d with O-2p orbitals occurred in the valence band of NiTiO3 and resulted in generation of a pseudo band gap of 0.3 eV at 1.4 eV below the Fermi level. This pseudo band gap might act as a hindrance and may contribute to weakening the intensity of the electronic transition due to Ni2+ → Ti4+ charge transfer. We propose here that an optimal concentration of 10% Ni substitution in indium titanate modifies the structural and electronic properties favorably leading to better photocatalytic activity by reducing the band gap, enhancing of the electron–hole separation and improving charge carrier properties.
1. Introduction
The photocatalytic hydrogen generation from water using solar energy is a potentially clean and attractive method for solar energy conversion and storage. Since Honda and Fujishima first discovered titanium dioxide (TiO2) photoassisted electrochemical splitting of water in 1972,1 semiconductor photocatalysts have attracted much attention. Although much work has been conducted over the past three decades to exploit new photocatalysts responsive to UV and visible light irradiation, detailed research has been mainly focussed on titania (TiO2).2–5 Besides, multi-metal oxide systems fulfill the essential requirement of materials with better chemical stability and modified catalytic properties and this fact have been emphasized in recent years.6–8 So, in the search for efficient photocatalysts under visible light for hydrogen generation from water, a variety of mixed oxide semiconductors based tantalates, titanates nitrides, niobates, sulphides, oxysulfides, oxynitrides etc. have been studied and have been reviewed in details in several articles.9–11 A common structural feature of the mixed metal oxide photocatalysts is the presence of [BO6] (B = Ti, In, Nb, Ta, etc.) octahedral moiety in the crystal structure. The compound indium titanate (In2TiO5) contains both InO6 & TiO6 octahedra and is expected to be a suitable photocatalyst for hydrogen generation from the structural point of view, but it suffers from the disadvantage that it absorbs in the UV region of the solar spectrum.12 So it is relevant to investigate the photocatalytic properties of modified indium titanate by suitable adjustment of band gap, so that it absorbs in the visible region.With this perspective we initiated our study by investigating the photocatalytic properties of bulk and nano In2TiO5 and established that In2TiO5 possesses a suitable electronic and crystal structure for photocatalytic hydrogen generation reaction.13 Wang et al.12 first reported that indium titanate can serve as an active photocatalyst for the UV-induced photo-degradation of methyl orange dye. Besides, V-doped In2TiO5 were also investigated for photocatalytic splitting of water under UV-vis irradiation.14 We have also studied the effect of B-site15 (Ti4+) substitution by Fe3+ and Cr3+ and also A-site16 (In3+) substitution by Ni2+ on thermal properties and reduction behavior of In2TiO5. Recently, we carried out a systematic study on the relationship between the structure and the photocatalytic properties of Nd3+ doped In2TiO5.17 First principle investigations were carried out to analyze the distribution of valence states of the constituent atoms near the Fermi level of the In2TiO5 which revealed the suitability of In2TiO5 as a photocatalyst material and the role of Nd in decreasing the band gap.17 Bahers et al.18 have evaluated the ability of density functional theory (DFT) to compute the fundamental properties such as band gap, dielectric constant, the charge carrier effective masses, and the exciton binding energy, which decide the photocatalytic and photovoltaic properties of semiconductor oxides. They concluded that DFT is a reliable tool for the evaluation and prediction of these key properties. These interesting photoactivity results of hydrogen generation over pristine and rare earth (Nd3+) doped In2TiO5 prompted us to investigate the effect of transition metal like Ni2+ on the photocatalytic properties of In2TiO5. To the best of our knowledge, investigations of photocatalytic properties by experimental or first-principles electronic structure calculations on Ni-doped In2TiO5, have not been attempted earlier. The modified form of In2TiO5, In2(1−x)Ni2xTiO5−δ, is expected to have absorbance in the visible region in contrast to the pristine In2TiO5 (band gap ∼3.02 eV in UV region) as transition metals with partly filled d-orbital (e.g. Ni2+, Cr3+, Fe3+) are known to add impurity levels near the conduction band of titanates thereby decreasing its band gap and increasing its photoactivity.9–12,14,19,20 This phenomenon along with the basis of photocatalytic hydrogen generation has been dealt in details in our chapter in the book edited by Banerjee and Tyagi.21 Additionally, the ionic radius of Ni2+ (0.69 Å) being much smaller than that of In3+ (0.81 Å), substituting In3+ by Ni2+ is expected to reduce the volume of the InO6 octahedra, and thus also the cell volume in In2TiO5. Consequently, the metal–metal bonding is expected to be altered in the crystal lattice such that the In–In distance shortens, resulting in profound alterations of the charge carrier properties of the compounds and therefore the photocatalytic properties.20 So, in this article we report the effects of A-site substitution of Ni2+ ion on crystal structure, optical properties and on the photocatalytic behavior of In2TiO5 for hydrogen generation reaction from water–methanol mixture. For this purpose, In2(1−x)Ni2xTiO5−δ, (0.0 ≤ x ≤ 0.2) mixed oxide catalysts were synthesized using solid-state reaction and characterized by powder X-ray diffraction (XRD), SEM, DRUV and the photocatalytic properties were investigated for hydrogen generation reaction. To establish the contribution of secondary phase, NiTiO3 in photocatalytic activity of In2(1−x)Ni2xTiO5−δ, samples with higher Ni content (≥15%), a pure single phase sample of NiTiO3 was also prepared, characterized and evaluated for photocatalytic H2 generation. Plane-wave based first-principles calculations within the density functional theory (DFT) with projector augmented wave (PAW) potentials were employed using Vienna Ab initio Simulation Package (VASP) code for calculations of ground state properties of In2TiO5, In1.8Ni0.2TiO5−δ, and NiTiO3 to understand the role played by Ni dopant ions in modifying the electronic structure of In2TiO5 and photocatalytic activity. Finally, the photocatalytic H2 yield was correlated with the structure, optical and electronic properties of the material.
2. Experimental
Mixed oxides with nominal composition, In2(1−x)Ni2xTiO5−δ, for 0.0 ≤ 2x ≤ 0.4, were synthesized through ceramic route (similar to our earlier procedure16,17) using pre-dried In2O3, TiO2 and NiO (99.99% purity) as starting materials and mixing them in appropriate stoichiometry as depicted by following equation:| (1 − x)In2O3 + TiO2 + 2xNiO → In2(1−x)Ni2xTiO5−δ | (1) |
The pellets (∼2 g) of homogeneous mixtures were calcined at 900 °C for 24 h, 1000 °C for 24 h and finally at 1250 °C for 12 h in air, with intermittent grindings so as to ensure the uniformity and the completion of the reaction.
For evaluating the contribution of secondary phases in the photocatalytic activity of In2(1−x)Ni2xTiO5−δ, a sample consisting of single phased NiTiO3 was also synthesized by solid state route. Pre-dried NiO and TiO2 in the molar ratio of 1![[thin space (1/6-em)]](https://www.rsc.org/images/entities/char_2009.gif) :
:![[thin space (1/6-em)]](https://www.rsc.org/images/entities/char_2009.gif) 1 were weighed, grinded for 40 minutes and mechanical mixture was subjected to a heat treatment of 700 °C for 83 h and further heated to 1000 °C for 78 h in air. Sample was grinded at intermediate levels and reaction pathway was monitored by recording powder XRD.
1 were weighed, grinded for 40 minutes and mechanical mixture was subjected to a heat treatment of 700 °C for 83 h and further heated to 1000 °C for 78 h in air. Sample was grinded at intermediate levels and reaction pathway was monitored by recording powder XRD.
The powder XRD patterns were recorded on a Philips diffractometer (model PW 1710), equipped with a graphite monochromator and Ni-filtered Cu-Kα radiation.
Structural analysis has been done by using Rietveld refinement program Fullprof-2005.22 First of all, the background parameters and scale factor were adjusted. The background was fitted with sixth order polynomial. The diffraction peak profile was fitted with pseudo-Voigt profile function and then the FWHM parameters were adjusted. No absorption parameter was considered during refinement. Subsequently, individual thermal parameters were refined. Finally, positional parameters were refined. A Quantachrome Autosorb-1 analyzer was employed for measurement of N2-BET surface area by recording the nitrogen adsorption isotherms.
For microstructural examination under a scanning electron microscope, (SEM) a thin layer of gold (100 Å) was coated on the calcined and sintered pellets at 1250 °C by thermal evaporation in a vacuum coating unit. A measured quantity of gold wire (99.99% pure) was wrapped on a tungsten wire which in turn was heated to evaporate the gold wire. The images of gold coated samples were recorded on scanning electron microscope Mirero, Korea, model-AIS2100.
Band gap measurements of all semiconductor oxide samples was estimated by recording their Diffuse reflectance UV-visible spectra using spectrophotometer of JASCO model V-530, Japan, scanned in range of 200–1000 nm at the scanning speed of 200 nm min−1.
The photocatalytic activities of the samples for hydrogen generation from water–methanol mixture were carried out under irradiation of a medium-pressure mercury lamp (Hg, Ace Glass Inc., 450 W) placed in an outer irradiation-type quartz cell surrounded with water circulation jacket to absorb IR irradiation. The said lamp exhibits very broad range emission spectra having maxima at both UV and the visible range with the UV part being only 16% of the whole spectra.14,17 The activity measurements were carried out in a rectangular quartz cell (2.1 × 2.1 × 8 cm3) equipped with a sampling and evacuation ports, at room temperature, placed horizontally in a chamber close to a water-cooled medium pressure mercury vapor lamp (400 W). The catalyst (0.1 g) was suspended in distilled water (10 ml) and methanol (5 ml). The reaction mixture was evacuated and irradiated under the medium pressure mercury lamp. After irradiation, the amount of hydrogen evolved was analysed by gas chromatograph (TCD, molecular sieve, 5 m length and Ar carrier). The number of photons falling on the reaction cell or flux of the light was determined by light flux meter. The flux observed under sunlight-type lamp after 2 h, in horizontal geometry was 19 × 104 lux or 278.2 W m−2. The apparent quantum efficiency of the samples was determined using calculations mentioned in our earlier reports.17
First principle calculations
Plane-wave based first-principles calculations within the density functional theory (DFT) with projector augmented wave (PAW)23 potentials were employed using Vienna Ab initio Simulation Package (VASP) code24 for calculations of ground state properties of three structures, viz., In2TiO5 (orthorhombic, Pnma), NiTiO3 (rhombohedral, R-3) and a supercell (In, Ni)2TiO5 containing 18.75 at% of Ni. The PAW potentials used [3p4s3d] state of Ti atom, [2s2p] state of O atom, [5s5p] state of In atom and [3p3d4s] state of Ni atom as valence states. Generalized gradient approximation (GGA) for exchange and correlations potential as parameterized by J. P. Perdew, K. Burke and M. Enzerhof (PBE)25 were used. For Ni-doped In2TiO5 and NiTiO3, we employed spin-polarized calculations using GGA + Ueff approach, where Ueff is the strong intra-atomic (on-site) Hubbard term which was taken to be 3.5 eV for both the cases. The expansion of electronic wave functions in plane waves was set to a kinetic energy cut-off (Ecutoff) of 450 eV for all the structures. The Brillouin-zone was sampled using Monkhorst–Pack k-point mesh.26 For each structure, optimization was carried out with respect to a k-point mesh and Ecutoff to ensure convergence of the total energy to within a precision better than 1 meV per atom. The converged k-point meshes used were 6 × 12 × 3 (36 k-points in the irreducible Brillouin zone (IBZ)), 4 × 8 × 8 (36 k-points in the IBZ) and 9 × 9 × 3 (44 k-points in the IBZ) for ITO, Ni-doped ITO and NiTiO3, respectively. Methfessel–Paxton technique27 was used for free energy calculations with a modest smearing of 0.1 eV, which resulted in a very small entropy term (<0.1 meV per atom) in all the cases. The structural relaxations (b/a, c/a ratio and atomic positions) were performed for each structure using the conjugate gradient algorithm until the residual forces on the atom were less than 0.01 eV Å−1 and stresses in the equilibrium geometry were less than 5 × 10⁻² GPa. The total electronic energy and density of states (DOS) calculations were performed using the tetrahedron method with Blöchl corrections.283. Results
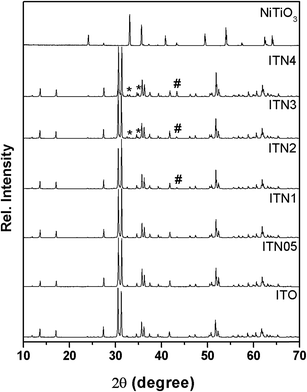
Table 1 lists the abbreviations and phases identified from the powder XRD patterns of all the In2(1−x)Ni2xTiO5−δ (0.0 ≤ 2x ≤ 0.4) samples prepared by the conventional solid state route.16 Henceforth, in this article, the samples will be designated by their abbreviations. Fig. 1 show the powder XRD patterns of In2TiO5 and corresponding patterns observed due to substitution of Ni2+ in place of In3+. The XRD pattern of ITO matches well with that of orthorhombic In2TiO5 (JCPDS card no. 82-0326, space group Pnma) oxide. The XRD patterns of ITN05 (In1.95Ni0.05TiO5−δ) and ITN1 (In1.9Ni0.1TiO5−δ) compositions closely matches with the XRD patterns of unsubstituted indium titanate indicating that lower extent of Ni substitution results in single phase materials due to formation of solid solution of Ni with the lattice of In2TiO5. However, peaks are shifted slightly towards higher 2θ values as compared to those of the pristine samples, which are attributed to the decrease in lattice spacing due to substitution of smaller Ni2+ ions in place of larger In3+ ions. On further Ni substitution i.e. samples having Ni content 2x ≥ 0.2 in In2(1−x)Ni2xTiO5−δ a very low intensity line (marked with #) was observed which corresponds to the 100% peak of NiO (JCPDS card no. 47-1049). Thus, for these compositions in addition to parent phase, NiO phase segregated in very small proportion. Further, for samples having higher Ni content i.e. 2x ≥ 0.3, a third phase of NiTiO3 (JCPDS card no. 33-0960, peaks marked with *) was also observed in addition to the NiO and ITO (Fig. 1). XRD pattern of single phased NiTiO3 sample prepared by solid state route calcined at 1000 °C for 78 h was also recorded and shown in Fig. 1. It matched with rhombohedral NiTiO3 phase (JCPDS Card no. 33-0960). Rutile TiO2 and NiO phase were also observed as impurities.| Sample no. | Nominal composition | Ni content (2x) | Abbreviation ITN (2x) | Phase identification by XRD | Tolerance factor t | Band gap (indirect) | Surface area (m2 g−1) |
|---|---|---|---|---|---|---|---|
| 1 | In2TiO5 | 0.00 | ITO | Single phase, In2TiO5 | 0.751 | 3.02 | 4.4 |
| 2 | In1.95Ni0.05TiO5−δ | 0.05 | ITN05 | Single phase, In2TiO5 | 0.75 | 3.00 | 4.6 |
| 3 | In1.9Ni0.1TiO5−δ | 0.1 | ITN1 | Single phase, In2TiO5 | 0.749 | 2.96 | 4.8 |
| 4 | In1.8Ni0.2TiO5−δ | 0.2 | ITN2 | In2TiO5 & NiO | 0.747 | 2.8 | 4.9 |
| 5 | In1.7Ni0.3TiO5−δ | 0.3 | ITN3 | In2TiO5, NiO & NiTiO3 | 0.745 | 2.75 | 4.5 |
| 6 | In1.6Ni0.4TiO5−δ | 0.4 | ITN4 | In2TiO5, NiO & NiTiO3 | 0.743 | 2.67 | 3.8 |
| 7 | NiTiO3 | NiTiO3, NiO & TiO2 | 3.6 |
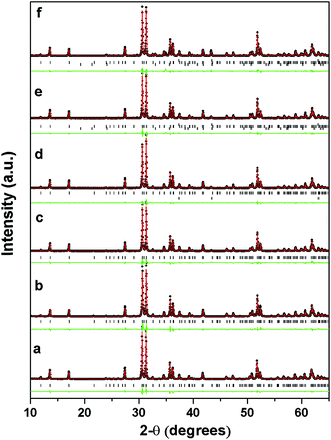
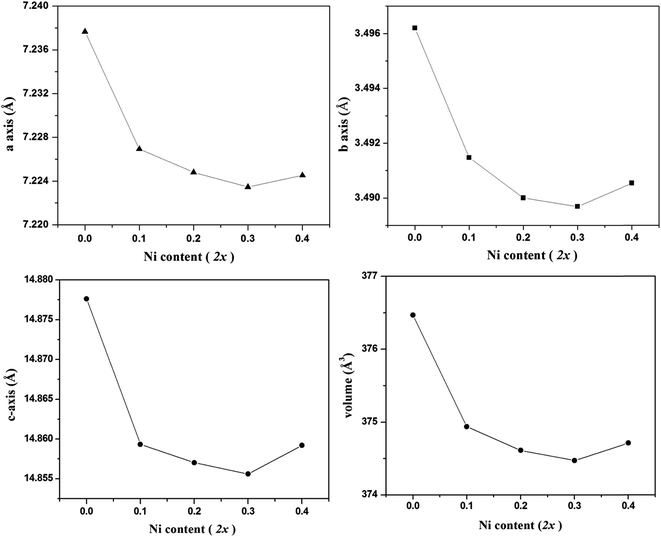
To determine the crystal structure under investigation and to confirm the site of dopant cation Ni2+ in the crystal lattice Rietveld refinement of the diffraction patterns were carried out. It is pertinent to mention here that the presence of a small amount of these secondary phases in the samples, as mentioned above, was taken into consideration for Rietveld analysis. The Rietveld refined profiles of X-ray diffraction data of various In2(1−x)Ni2xTiO5−δ samples as a function of doping are shown in Fig. 2. The substituted samples were found to be isostructural with the parent indium titanate phase and Ni2+ was found to substitute only at one of the 4c In3+ site. This was confirmed on the basis of minimization of Rietveld parameters. The typical variation in cell parameters and cell volume as a function of nickel content in In2(1−x)Ni2xTiO5−δ (0.0 ≤ 2x ≤ 0.4) samples, as deduced from the Rietveld analysis of corresponding powder XRD reflections, is shown in Fig. 3. As seen in Fig. 3d, the cell volume decreases as a function of nickel content (2x) as long as 2x < 0.3, with almost a linear decrease upto 2x < 0.2. Thereafter, the cell expands when Ni content 2x > 0.3. The lattice parameters a, b and c also shows a similar trend. Due to incorporation of smaller cation Ni2+ by substitution of a larger cation In3+ and consequent formation of single phase In2TiO5 (except for a negligible NiO phase for 2x = 0.2), there is a linear decrease in the values of cell parameters and cell volume initially upto 2x ≤ 0.2. But, in compounds with Ni doping content greater than 2x ≥ 0.3, the impurity phase of NiTiO3 also appears and increases its volume fraction significantly with an increase in Ni-content. The offset from linearity and then an increase in lattice parameters can be explained from the segregation of the impurity phases. Although, the occupancy of Ni2+ increases with doping, the parent lattice has a maximum capacity to substitute a large cation by a smaller cation. When the maximum capacity for such substitution exceeds, secondary phases appear keeping the parent crystal phase as the major phase. Such, segregation of secondary phases and its growth, due to substitution of In3+ by Ni2+ in oxide lattices was also observed in InTaO4 by Zou et al.20
It is known20 that the structural stability of oxides consisting of octahedra such as ABO3, can be estimated by calculating the tolerance factor defined as t = (rA + rO)/√2(rB + rO) where, rA, rB and rO are the radii of the respective ions and t is unity for an ideal cubic lattice, while greater the deviation in t from unity, more the distortion in structure. In this case, rA is a maximum for the undoped ITO compound and as a consequence, as shown in Table 1, the t value decreases with increasing Ni content 2x in In2(1−x)Ni2xTiO5−δ, the t value becoming smallest for ITN4, suggesting that ITO lattice is destabilized by smaller cation Ni2+ at In site. Rietveld refinement of the powder XRD reflections (Fig. 1–3, Table 1), clearly establish the structural changes arising out on nickel ion incorporation into lattice of ITO i.e. lattice contraction and secondary phase separation. This structural modification arising out of Ni ion substitution has a significant effect on photoactivity which is elaborated in “Discussion” section.
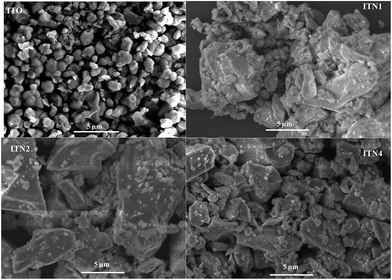
All samples are highly crystalline with large crystallite size (>100 nm) and very low N2-BET surface area (3–5 m2 g−1) as mentioned in Table 1. Fig. 4 shows the SEM images of the undoped ITO and doped samples. The ITO showed faceted structure with clear grain boundaries and Ni doping resulted in loss of faceted shape as we also observed earlier on Nd doping.17 The Ni doped samples also showed distinct grain boundaries but the particles exhibited non-uniform shape and size. All the particles were in the micrometer range.
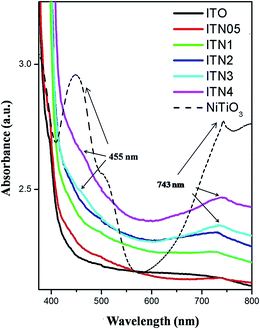
Fig. 5 illustrates the UV-visible absorption spectra of In2(1−x)Ni2xTiO5−δ (0.0 ≤ 2x ≤ 0.4), showing that the light absorption properties of these compounds are characteristic of photocatalysts able to respond to UV-visible light. Curve in black is the UV-vis absorption spectrum of indium titanate. It is evident from Fig. 5, that with the substitution of Ni, there is a progressive red shift in the absorption pattern of indium titanate. The indirect optical band gap of Ni substituted materials were estimated from plots of (αhν)1/2vs. the photon energy, hν and is listed in Table 1. One of the most characteristic features is that the bandgap is narrowed with Ni doping. There are two indirect band gap in indium titanate one is manifested (Eg = 3.02 eV) in its optical spectra whereas other (Eg = 1.6 eV) is observed as shoulder.12,14,17 On Ni substitution the band gap decreased to ∼2.8 eV in the 10% doped sample ITN2, while the most extreme sample ITN4 exhibited a band gap of ∼2.6 eV. As nickel content increases, a shoulder at 455 nm and a broad band at 735 nm were observed in ITN3 and ITN4 samples. These coincide with the reported absorption bands of NiTiO3 at 450 nm due to Ni2+ → Ti4+ charge transfer (CT)29 and a broad visible light absorption at 740 nm.30,31
Detailed electronic structure as deduced from density of states calculations for ITO, ITN2 and NiTiO3, using the DFT calculations will be shown later and explains that these optical transitions are arising from its electronic structure.
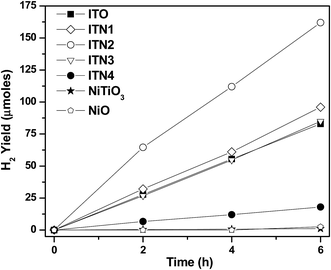
Results of photocatalytic activity of In2TiO5 and Ni substituted indium titanates, In2(1−x)Ni2xTiO5−δ (0.0 ≤ 2x ≤ 0.4) samples for hydrogen generation from water in presence of methanol as a sacrificial agent was evaluated. The hydrogen generated during different time courses for all the samples is shown in Fig. 6. The hydrogen yield increased linearly with time. Pristine indium titanate is able to generate hydrogen photocatalytically from water in presence of sacrificial agent methanol as reported in earlier publications.12,17 From the present study it is evident that Ni doping modifies the photoactivity to a great extent. On Ni-doping the photoactivity for hydrogen generation increases initially and the reaches a maximum at 10% doping and the again falls with the highest Ni-content sample of 20% doping showing lower activity than the base indium titanate itself. For comparison, photocatalytic activity of single phased NiTiO3 sample is also shown. A pure sample of NiO was also tested under identical conditions and was found to be a poor photocatalyst. Hydrogen yield of 2.5 μmol after 6 h of irradiation over 0.1 g of NiO was observed.
The rate of photocatalytic hydrogen generation as a function of Ni ion concentration is shown in Fig. 7. It is evident from Fig. 7 that an optimal dosage of 10% Ni2+ ion doping, ITN2 resulted in significant enhancement in rate of photocatalytic H2 yield (270 μmol g−1 h−1) while, In2TiO5 have shown 138 μmol g−1 h−1 of H2 generation rate. The decreasing order of catalytic activity is as follows: ITN2 > ITN1 > ITO > ITN3 > ITN4. Deterioration in H2 yield over ITN3 and ITN4 was observed which can be attributed to presence of NiTiO3 phase. To evaluate the contribution of NiTiO3 phase it was synthesized by solid state route and its photocatalytic activity was determined under UV-visible irradiation as shown in Fig. 6. NiTiO3 phase was found to be photocatalytically active and yielded H2 at a rate of 18 μmol g−1 h−1. It was observed that rate of hydrogen generation over NiTiO3 is ∼7.5 times and ∼15 times less than parent oxide ITO and ITN2 respectively. This phenomenon is in agreement with literature reports, viz. Melian et al. have demonstrated that NiTiO3 phase which appeared at higher calcinations temperature was detrimental to the photoactivity of highly efficient Ni/N modified TiO2 samples.32,33 The apparent quantum efficiency (η) calculated for different samples are depicted in Fig. 8. Maximum A.Q.E of 1.68% is obtained with ITN2 among all samples which is more than two fold when compared to undoped semiconductor ITO whose A.Q.E. was found to be 0.86%.
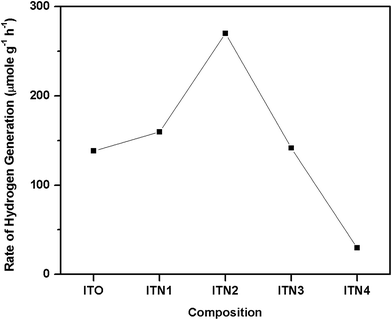 | ||
| Fig. 7 The rate of photocatalytic hydrogen generation in μmol g−1 h−1 from water–methanol mixture as a function of Ni ion content. | ||
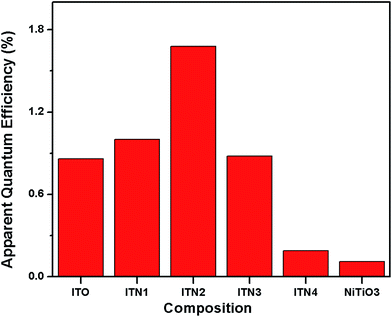 | ||
| Fig. 8 Plot of the apparent quantum efficiency (η) for the undoped and doped indium titanate samples and NiTiO3 for comparison. | ||
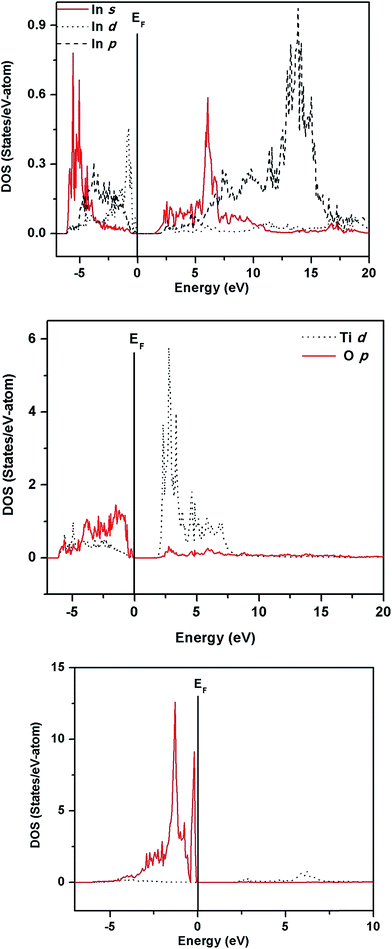
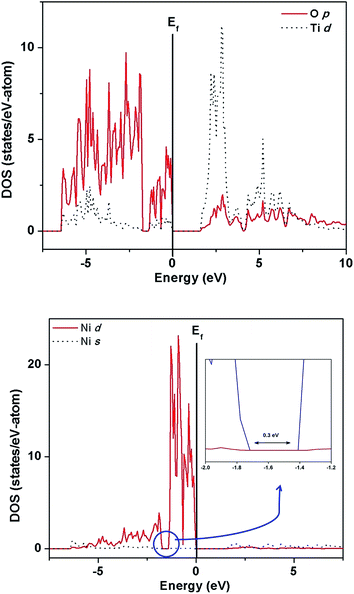
The electronic structure of ITO, ITN2 and NiTiO3 were calculated using VASP code in order to elucidate the distribution of valence states of Ti, In, O atoms near the Fermi level and to understand the role of Ni ions in modifying the band structure of indium titanate and improving the photocatalytic properties. In our earlier communication,17 isovalent doping of rare earth, neodymium ions (Nd3+) in ITO was investigated with an objective to suppress the formation of nonstoichiometric defects which would otherwise work as nonradiative recombination centers between photogenerated electrons and holes. Here, we have attempted to investigate the role of aliovalent substitution by transition metal ions, Ni2+ ions at A-site in In2TiO5 lattice. Since orbital energies of Ni, (transition metal d8, valence orbitals are 3d and 4s) and Nd (f block, valence orbitals, 4f, 6s and 5d) are very different and both belongs to different class of elements, the implications of the individual substitution in indium titanate was found to be markedly different. Fig. 9, 11 and 13 show calculated band structures along a few high-symmetry directions while Fig. 10, 12 and 14 show site- and l-projected partial density of states (DOS) of ITO, ITN2 and NiTiO3 respectively. The band structure of parent oxide, indium titanate has been discussed in details in our earlier publication by TBLMTO.17 Here we have calculated the band structure by VASP code and the findings are in good agreement with our earlier results. In brief, indium titanate was found to have two band gaps (Fig. 9), one direct band gap between the LUMO and HOMO at 1.6 eV and another indirect band gap of 3.2 eV (close to experimental 3.02 eV). Indium 5s states are of large dispersion with rather small DOS (Fig. 10), thus indirect band gap of 1.6 eV is not flat band to flat band transition, hence is less probable. Evidently, this transition manifests itself as a shoulder in the experimental optical spectrum.12 Band structure calculations on unsubstituted ITO also revealed the large dispersion of In-5s states in conduction band. This model is further used in the present study to understand the performance of Ni-doped indium titanate photocatalysts.
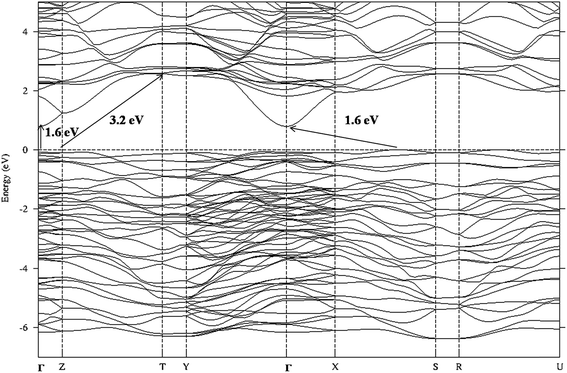 | ||
| Fig. 9 Band structure of ITO along high-symmetry Γ(0,0,0), X(1/4,0,0), Y(0,1/2,0), Z(0,0,1/8), S(1/4,1/2,0), R(1/4,1/2,1/8), T(0,1/2,1/8), and U(1/4,0,1/8) directions. | ||
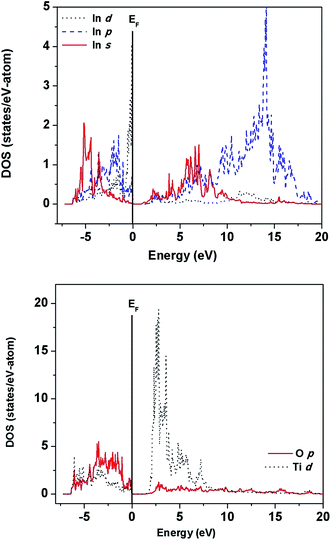 | ||
| Fig. 10 Site- and angular momentum-projected partial density of states for ITO showing the valence band to be mainly composed of O-p, Ti-d, and In-p,d states. We got almost similar results in our earlier calculations.17 | ||
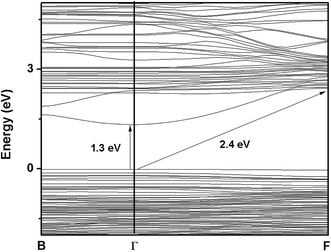
For ITN2, a 1 × 2 × 1 supercell of ITO having 18.75 atom% of Ni substituting indium sites, was considered. Fig. 11 shows the band structure of ITN2 plotted along high symmetry directions, viz., Γ(0,0,0), B(1/4,0,0) and F(0,1/2,0). As can be seen from Fig. 11 the band structure plot, the flat bands in the valence as well as conduction bands are found between Γ- and B-points and close to the F-point. The minimum direct band gap of ∼1.3 eV is observed along the Γ-point between a flat band in the valence band and that in the conduction band; while the maximum indirect band gap is ∼2.4 eV. The transition from highest occupied states at Γ point to the unoccupied states at B or F, exhibits an indirect gap of ∼1.6 and ∼2.4 eV respectively. The multi-peaked structure of the total DOS is indicative of strong hybridization and layered structure as evident from Fig. 12. The strong mixing of Ni-3d with In-4d states, close to the Fermi energy and with In-5p, in the middle part of the valence band was observed. The lower energy part of the conduction band shows weaker hybridization of In-5s and Ti-3d states as compared to that in ITO, while the O-2p states in the valence and the conduction band remain mostly unchanged on Ni-doping. We observed a rise in Fermi energy level by 0.42 eV and also a decrease in energy of the conduction band from our calculations by GGA + U method. This gives an illustration of how a change in functionality can be achieved by engineering the electronic structure through modification of structure and composition of a material.
Nickel substitution beyond 10% has resulted in segregation of NiTiO3 phase. The decrease in photocatalytic activity of ITN3 and ITN4 samples coincided with appearance of this new phase. Thus, to investigate the electronic properties and factors responsible for lowering the activity, the band calculations using VASP code were performed on single phase NiTiO3. The band structure and DOS plots of NiTiO3 are plotted in Fig. 13 and 14 respectively. Band structure of NiTiO3 are plotted along high symmetry directions, Γ(0,0,0), L(0,1/2,0), Z(1/2,1/2,1/2) and F(1/2,1/2,0). The flat bands in the valence as well as conduction bands are found between Γ- and Z- and close to the F-points. The minimum direct band gap of ∼1.7 eV is observed along the Γ-point; while the maximum direct band gap of ∼2.4 eV at Z-point is observed between a flat band in the valence band and that in the conduction band (Fig. 13). The site- and angular momentum density of states (DOS) plots shown in Fig. 14 exhibits mixing of O-2p and Ni-3d states in the valence band unlike ITN2 sample. It also exhibits a tiny pseudo band gap of about 0.3 eV at −1.4 eV as shown in inset of Fig. 14. This band gap separates the bonding and antibonding states in the valence band indicating strong mixing of Ni-3d and O-2p states attributed to the covalent character of Ni–O bonds. The lower energy part of the conduction band exhibits strong mixing of Ti-3d and O-2p states. Above calculations also reveals that NiTiO3 is a wider band gap material as compared to ITN2 sample.
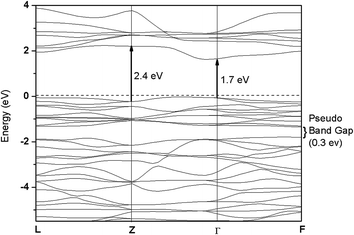 | ||
| Fig. 13 Band structure of ilmenite NiTiO3 along high-symmetry Γ(0,0,0), L(0,1/2,0), Z(1/2,1/2,1/2) and F(1/2,1/2,0) directions. | ||
4. Discussion
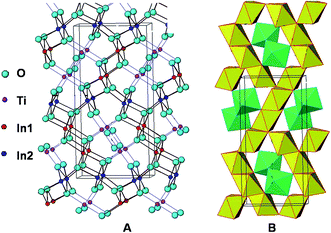
The detailed investigation of crystal structure by Rietveld refinement of the observed XRD patterns, optical absorption properties by DRUV-visible spectra, electronic properties by band calculations using first principles study and photocatalytic activity evaluation for H2 evolution over In2(1−x)Ni2xTiO5−δ (0.0 ≤ 2x≤ 0.4) compounds enabled us to emphasize the role of Ni substitution in ITO, in modifying the structural, optical and electronic properties and its consequent effect on photoactivity.As already discussed in our previous reports17,21 and by others12,14 the undoped oxide, orthorhombic In2TiO5, has a favourable crystal structure for the photocatalytic generation of hydrogen by virtue of its structure and electronic properties. A comparison of the Ti–O bond distance/angles in octahedral [TiO6], the density and crystal packing factor of In2TiO5 and TiO2 is shown in Table 2. It reveals that the coordination environment of Ti in In2TiO5 is more open and flexible than that in TiO2 – by virtue of the more distorted TiO6 octahedral units and a lesser value of the crystal packing factor. It is considered from structure–activity correlations that photocatalysts with more open structures are more catalytically active.2,12,13,21,34,35 The polyhedral arrangement of In2TiO5 as calculated from our Rietveld refinement results, is shown in Fig. 15, with the yellow octahedral being that of [InO6] and the green octahedral that of [TiO6]. The [InO6] octahedral units are edge shared and forms infinite chains while the [InO6] and [TiO6] octahedral units are corner shared. The presence of such octahedral InO6 polyhedra in the crystal structure has been found to have a positive effect on the photocatalytic properties in some compounds like InNbO4,33 InTaO4![[thin space (1/6-em)]](https://www.rsc.org/images/entities/char_2009.gif) 20,36,37 or even AgInW2O8
20,36,37 or even AgInW2O8![[thin space (1/6-em)]](https://www.rsc.org/images/entities/char_2009.gif) 38 and In6WO12.39 This is because the polyhedral units which are either edge or corner shared forming infinite chains, helps in charge transfer to the surface which is an important requirement for a proper photocatalyst.9,20 Further, our band calculations on In2TiO5 revealed large dispersion of In-5s states in the conduction band, and the presence of an indirect optical band gap. Upon photoabsorption in the semiconducting indium titanate the electron goes to the largely dispersed In-5s states and is transferred to the surface, via chains of InO6 octahedra, where reduction occurs resulting in hydrogen production. The presence of the optically indirect transition restricts the electron–hole recombination to a certain extent. Thus, both the crystal structure and band structure are in favour of photon energy storage to assist the photocatalytic activity of In2TiO5.17
38 and In6WO12.39 This is because the polyhedral units which are either edge or corner shared forming infinite chains, helps in charge transfer to the surface which is an important requirement for a proper photocatalyst.9,20 Further, our band calculations on In2TiO5 revealed large dispersion of In-5s states in the conduction band, and the presence of an indirect optical band gap. Upon photoabsorption in the semiconducting indium titanate the electron goes to the largely dispersed In-5s states and is transferred to the surface, via chains of InO6 octahedra, where reduction occurs resulting in hydrogen production. The presence of the optically indirect transition restricts the electron–hole recombination to a certain extent. Thus, both the crystal structure and band structure are in favour of photon energy storage to assist the photocatalytic activity of In2TiO5.17
| Name of the compound | Bond distance Ti–O (Å) | Bond angle O–Ti–O (°) | Crystal packing factor (%) |
|---|---|---|---|
| In2TiO5 (our results) | 1.8087, 1.8230 (×2), 2.0323, 2.0386, 2.1853 | 73.53–179.52 | 68.0 |
| Anatase TiO2 (ref. 2) | 1.964 (×2), 1.937 (×4) | 77.64–179.98 | 70.2 |
| Rutile TiO2 (ref. 2) | 1.988 (×2), 1.944 (×4) | 80.86–180.00 | 76.6 |
Effect of Ni2+ substitution on photocatalytic activity of indium titanate depends on the extent to which Ni is incorporated in the photocatalyst. An increase in photocatalytic activity for hydrogen generation upto 10% Ni2+ ion substitution in ITO lattice was observed which can be attributed to a combination of structural, optical and electronic factors, and is discussed in detail below.
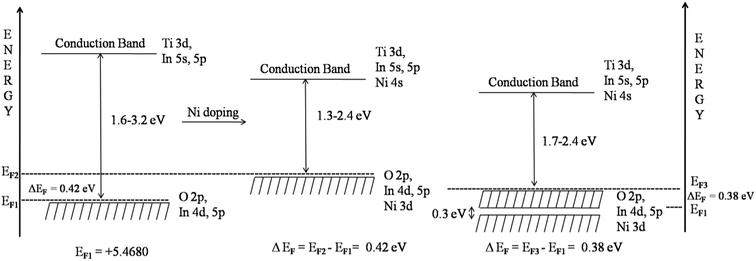
From the structural point of view, the substitution of smaller Ni2+ cation in place of the larger In3+ cation in the ITO lattice resulted in the decrease in In–In distance which is expected to decrease the volume of InO6 octahedra, and since they participate in charge transfer, rate of electron transfer to the surface must have enhanced as compared to pristine indium titanate. Thus, the photoactivity increased on substitution. Optically, there was a decrease in band gap of indium titanate on Ni-doping. The smaller band gap as seen from DRUV result facilitated the photoinduced electron excitation from the valence band to the conduction band in the doped oxide semiconductor, thus increasing the photocatalytic activity of the material. The electronic structure calculations revealed the underlying reasons for this decrease in band gap and also disclosed the benefits obtained in charge carrier properties of indium titanate on Ni doping. The In-4d and Ni-3d states in the valence band showed a sharp peak near the Fermi level representing their localized nature (smaller dispersion resulting in flat bands) as seen in Fig. 12. Thus, the strong optical transitions were due to flat bands from valence band to flat bands in conduction band (Fig. 11) and these are found along Γ to B or Γ to F point. These transitions are responsible for improved optical properties of ITN2 because of enhanced probabilities arising from these flat bands to flat band transitions. Further, the strong intermixing of Ni-3d states with In-4d and In-5p have increased the energy of valence band. Thus valence band is raised towards the conduction band by 0.42 eV in ITN2 sample as compared to ITO sample. Besides, a decrease in energy of the conduction band was also observed. Taking into account all these factors, the modified band structure of ITN2 is shown in Fig. 16. Narrowing in band gap on Ni substitution is attributed to rise in Fermi energy level by 0.42 eV, and decrease in energy of conduction band. Thus, a net lowering of band gap (Fig. 16) resulted on Ni doping. Whereas, in our earlier study17 we found Nd to be one of the elements that was able to make a valence-band position higher than O-2p orbitals considerably and resulted in narrowing the band gap in ITO by 0.82 eV. Regarding charge carrier properties, the density of states calculations showed strong hybridization of Ni-3d and In-4d states, and also Ni-3d and In-4p mixing. The conduction band maximum (CBM) was found to be a hybrid state between Ni, Ti and In orbitals. That is, the photo-induced charges can be transported from zigzag chains of [·Ni–O–Ti⋯In–O–Ti----]. The hybrid state in CBM and the substitution – induced specific connections among the local structures enhanced the mobility for the transportation and separation of electron–hole pairs. All the above factors helped in increase in photoactivity of indium titanate on Ni doping. One interesting fact was that the formation of secondary phase NiO was seen in ITN2 sample but it was not detrimental to the photocatalytic activity. NiO homogeneously distributed on the photocatalyst surface act as an electron trap and is suitable for photoreduction as reported by other authors.9,20,40,41
Further, 15–20% substitution of Ni resulted in segregation of another phase NiTiO3. As the appearance of this phase coincided with deterioration of photocatalytic activity, it may be responsible for lowering of photoactivity of indium titanate, a phenomenon also observed by other authors.32,33 The ilmenite structure of NiTiO3, consists of a pseudo close-packed-hexagonal array of O2− ions with two thirds of the octahedral sites of any basal plane occupied by like cations in an ordered hexagonal net.43 It is reported that traditional synthetic procedures yields large NiTiO3 particles with low surface areas and pore volumes due to inherent problems such as high reaction temperature and heterogeneous solid phase reactions.42,43 Co-formation of symmetric rhombohedral NiTiO3 phase along with flexible orthorhombic Ni-doped In2TiO5 imparts unfavourable photocatalytic properties to ITN3 and ITN4 particles. From the electronic properties and band calculations of NiTiO3, (Fig. 13 and 14), it is revealed that NiTiO3 is a wider band gap material as compared to ITN2 sample. Electronic transitions from O2− (2p6, valence band edge) → Ti4+ (conduction band) takes place under UV light illumination. Under visible light, Ni2+ → Ti4+ transitions takes place, but the geometry of the NiTiO3 ilmenite, makes the oscillator strength for the Ni2+ → Ti4+ charge transfer too weak to have an acceptable photoresponse to visible light. In NiTiO3 strong intermixing of Ni-3d with O-2p orbitals in valence band takes place (Fig. 14) unlike ITN2 where O-2p states in the valence and the conduction band remain mostly unchanged on Ni-doping in indium titanate lattice (Fig. 12). The pseudo band gap of 0.3 eV generated in the valence band of NiTiO3 at −1.4 eV (Fig. 14) is outcome of intermixing of orbitals due to strong covalent character of Ni–O bonds. This pseudo band gap might act as hindrance and may contribute in weakening the intensity of electronic transition due to Ni2+ → Ti4+ charge transfer. Therefore, presence of NiTiO3 phase in small amounts also affects the photoactivity adversely in ITN3 and ITN4. Other reports by Salvador et al.44 have also shown that NiTiO3 is not a good candidate for water photoelectrolysis in a photoelectrochemical cell, while Melian et al.32 has shown that the appearance of NiTiO3 phase was detrimental to the photoactivity of highly efficient Ni/N modified TiO2 samples. The combination of a proper band gap and crystal structure was present in the ITN2 sample for having the highest photocatalytic activity among these semiconductor oxides.
5. Conclusion
In the present communication, we have emphasized the suitability of indium titanate, In2TiO5 as a photocatalyst and investigated the role of Ni2+ ion substitution at A-site in modifying its crystal structure, optical and electronic properties leading to modified photocatalytic activities for hydrogen generation. From our investigations, we conclude that the optimal dosage of 10% Ni substitution in indium titanate has favourably tailored the crystal structure, optical and electronic properties for having the highest photocatalytic activity among these semiconductor oxides. This is noteworthy information needed in order to design new visible light-driven photocatalysts.Acknowledgements
The authors acknowledge Materials Chemistry Section, Chemistry Division, BARC for recording the SEM images. Research grant received from Department of Science and Technology (DST) New Delhi (No. DST/TSG/SH/2011/106) is gratefully acknowledged.References
- A. Fujishima and K. Honda, Nature, 1972, 238, 37 CrossRef PubMed.
- A. L. Linsebigler, G. Lu and J. T. Yates, Jr, Chem. Rev., 1995, 95, 735 CrossRef.
- T. Tachikawa, M. Fujitsuka and T. Majima, J. Phys. Chem. B, 2007, 111(14), 5259 Search PubMed.
- M. Kitano, M. Matsuoka, M. Ueshima and M. Anpo, Appl. Catal., A, 2007, 325, 1 CrossRef.
- M. Ni, M. K. H. Leung, D. Y. C. Leung and K. Sumathy, Renewable Sustainable Energy Rev., 2007, 11, 401 CrossRef.
- G. Busca, L. Lietti, G. Ramis and F. Berti, Appl. Catal., B, 1998, 18, 1 CrossRef.
- M. Woodhouse and B. A. Parkinson, Chem. Soc. Rev., 2009, 38, 197 RSC.
- A. M. Banerjee, A. R. Shirole, M. R. Pai, A. K. Tripathi, S. R. Bharadwaj, D. Das and P. K. Sinha, Appl. Catal., B, 2012, 127, 36 CrossRef; A. M. Banerjee, M. R. Pai, S. S. Meena, A. K. Tripathi and S. R. Bharadwaj, Int. J. Hydrogen Energy, 2011, 36, 4768 CrossRef.
- A. Kudo and Y. Miseki, Chem. Soc. Rev., 2009, 38, 253–278 RSC.
- K. Maeda and K. Domen, J. Phys. Chem. C, 2007, 111, 7851 Search PubMed.
- X. Chen, S. Shen, L. Guo and S. S. Mao, Chem. Rev., 2010, 110(11), 6503 CrossRef PubMed.
- W. D. Wang, F. Q. Huang, C. M. Liu, X. P. Lin and J. L. Shi, J. Mater. Sci. Eng. B, 2007, 139, 74 CrossRef.
- M. R. Pai, A. Singhal, A. M. Banerjee, R. Tiwari, G. K. Dey, A. K. Tyagi and S. R. Bharadwaj, J. Nanosci. Nanotechnol., 2012, 12, 1957 CrossRef PubMed.
- P. Shah, D. S. Bhange, A. S. Deshpande, M. S. Kulkarni and N. M. Gupta, Mater. Chem. Phys., 2009, 117, 399 CrossRef.
- M. R. Pai, A. M. Banerjee, S. R. Bharadwaj and S. K. Kulshreshtha, J. Mater. Res., 2007, 22, 1787 CrossRef.
- A. M. Banerjee, M. R. Pai, Jagannath and S. R. Bharadwaj, Thermochim. Acta, 2011, 516, 40 CrossRef.
- M. R. Pai, J. Majeed, A. M. Banerjee, A. Arya, S. Bhattacharya, R. Rao and S. R. Bharadwaj, J. Phys. Chem. C, 2012, 116, 1458 Search PubMed.
- T. L. Bahers, M. Rerat and P. Sautet, J. Phys. Chem. C, 2014, 118, 5997 Search PubMed.
- D. W. Hwang, H. G. Kim, J. S. Lee, J. Kim, W. Li and S. H. Oh, J. Phys. Chem. B, 2005, 109, 2093 CrossRef PubMed.
- Z. Zou, J. H. Ye, K. Sayama and H. Arakawa, Nature, 2001, 414, 625–627 CrossRef PubMed.
- M. R. Pai, A. M. Banerjee, A. K. Tripathi and S. R. Bharadwaj, Fundamentals and Appplications of the Photoctalytic Water Splitting Reaction, in Functional Materials: Preparations, Processing and Applications, ed. S. Banerjee andA. K. Tyagi, Elsevier Insights, USA, 2012, ch. 14, pp. 579–606 Search PubMed.
- J. Rodrıguez-Carvajal, WinPLOTR, Laboratorie Leon Brillouin (CEA-CNRS), April 2005(LLB-LCSIM) Search PubMed.
- P. E. Blöchl, Phys. Rev. B: Condens. Matter Mater. Phys., 1994, 50, 17953 CrossRef.
- G. Kresse and J. Furthmüller, Phys. Rev. B: Condens. Matter Mater. Phys., 1996, 54, 11169 CrossRef.
- J. P. Perdew, K. Burke and M. Enzerhof, Phys. Rev. Lett., 1996, 77, 3865 CrossRef PubMed.
- H. J. Monkhorst and J. D. Pack, Phys. Rev. B: Condens. Matter Mater. Phys., 1979, 13, 5188 CrossRef.
- M. Methfessel and A. T. Paxton, Phys. Rev. B: Condens. Matter Mater. Phys., 1989, 40, 3616 CrossRef.
- P. E. Blöchl, O. Jepsen and O. K. Andersen, Phys. Rev. B: Condens. Matter Mater. Phys., 1994, 49, 16223 CrossRef.
- Y. Qu, W. Zhou, Z. Ren, S. Du, X. Meng, G. Tian, K. Pan, G. Wang and H. Fu, J. Mater. Chem., 2012, 22, 16471 RSC.
- Yi-J. Lin, Y.-H. Chang, W.-D. Yang and B.-S. Tsai, J. Non-Cryst. Solids, 2006, 352, 789–794 CrossRef.
- T.-D. Nguyen-Phan, C. Nguyen-Huy and E. W. Shin, Mater. Lett., 2014, 131, 217–221 CrossRef.
- E. P. Melian, M. N. Suarez, T. Jardiel, J. M. Dona Rodriguez, A. C. Caballero, J. Arana, D. G. Calatayud and O. González Díaz, Appl. Catal., B, 2014, 152–153, 192 CrossRef.
- I. Ganesh, A. K. Gupta, P. P. Kumar, P. S. C. Sekhar, K. Radha, G. Padmanabham and G. Sundararajan, Sci. World J., 2012, 2012, 1–16 CrossRef PubMed.
- D. W. Kim, N. Enomoto, Z. Nakagawa and K. Kawamura, J. Am. Ceram. Soc., 1996, 79, 1099 Search PubMed.
- X. P. Lin, F. Q. Huang, W. D. Wang, Y. M. Wang, Y. J. Xia and J. L. Shi, Appl. Catal., A, 2006, 313, 218 CrossRef.
- Z. Zou, J. Ye and H. Arakawa, Chem. Phys. Lett., 2000, 332, 271 CrossRef.
- H. C. Chen, H. C. Chou, J. C. S. Wu and H. Y. Lin, J. Mater. Res., 2008, 23(5), 1364 CrossRef.
- J. Tang, Z. Zou and J. Ye, J. Phys. Chem. B, 2003, 107, 14265 CrossRef.
- H. Zhang, X. Chen, Z. Li, L. Liu, T. Yu and Z. Zou, J. Phys.: Condens. Matter, 2007, 19, 376213 CrossRef.
- W. Wang, S. Liu, L. Nie, B. Cheng and J. Yu, Phys. Chem. Chem. Phys., 2013, 15, 12033–12039 RSC.
- T. Sreethawong, Y. Suzuki and S. Yoshikawa, Int. J. Hydrogen Energy, 2005, 30, 1053 CrossRef.
- Y. M. Chiang, D. Birnie and W. D. Kingery, Physical Ceramics: Principles of Ceramic Science and Engineering, John Wiley & Sons Inc, New York, 1996 Search PubMed.
- Y. Ni, X. Wang and J. Hong, Mater. Res. Bull., 2009, 44, 1797–1801 CrossRef.
- P. Salvador, C. Gutierrez and J. B. Goodenough, J. Appl. Phys., 1982, 53, 7003 CrossRef.
| This journal is © The Royal Society of Chemistry 2015 |

