UV-assisted size sampling and antibacterial screening of Lantana camara leaf extract synthesized silver nanoparticles
Pradeep Kumar Singhab,
Kirti Bhardwajb,
Parul Dubeya and
Asmita Prabhune*a
aBiochemical Sciences Division, National Chemical Laboratory (NCL), Council of Scientific and Industrial Research (CSIR), Dr. HomiBhabha Road, Pashan, Pune 411008, India. E-mail: aa.prabhune@ncl.res.in
bPhysical and Materials Chemistry Division, National Chemical Laboratory (NCL), Council of Scientific and Industrial Research (CSIR), Dr. HomiBhabha Road, Pashan, Pune 411008, India
First published on 27th February 2015
Abstract
Green route synthesized silver nanoparticles are extremely toxic to multidrug resistant bacteria and have widespread applications in biomedical science. If the silver reducing weed extract possesses antimicrobial properties then it can additionally contribute to the medicinal activity. Herein, we present a synthesis of silver nanoparticles by using the weed plant Lantana camara's leaf extract. This study shows an easy, quick and cost-effective route to silver nanoparticle synthesis. Size controlled synthesis of Ag0 nanoparticles is studied and discussed based on optical absorption, photoluminescence, dynamic light scattering (DLS), zeta potential, infrared spectroscopy, X-ray diffraction measurements, FE-SEM and TEM analysis. The synthesis of silver nanoparticles via this green approach shows very high antibacterial activity against E coli (Gram −ve) and S. aureus (Gram +ve) bacteria at a very low concentration (50 ppm Ag nanoparticles). Use of such eco-friendly nanoparticles may open a door for a new range of bactericidal agents.
Introduction
There are several reports on synthesis of silver nanoparticles using plants as the green reducing sources. However owing to the diversity of the plant kingdom, many systems and phenomena remain unexplored. Plant extract-driven green synthesis of silver nanoparticles has been studied using variety of plants like Glycine max,1 Cinnamon zeylanicum,2 Camellia sinensis3 and Azadirachta indica.4 The benefits of green route are that it offers cost effective, environment friendly,5 and scalable options as compared to the established chemical and physical methods. Furthermore, the green synthesis route is advantageous as it does not involve use of toxic chemicals, high temperature, high pressure and energy. Presently however, chemical and physical methods are mainly employed.Despite that, there is persistent requirement for a commercially viable, economic and environment friendly route to silver nanoparticle synthesis.6–8 Silver nanoparticles find applications in disease prevention,9,10 material chemistry, electronics, catalysis,11 and plasmonics. These applications greatly depend upon the controlled size of silver nanoparticles and their assemblies. Quick and green synthesis is important to reduce investment and plan ecological costs for large scale production. Currently, large scale production involves chemical reactions in laboratories on a batch-scale.12 A few reports have made practical progress in the direction of cost effective nanoparticle synthesis by using bio-derived compound like plant extracts and polysaccharides of biomaterials.13 Presently, green route synthesis reactions at room temperature take several hours for completion and are therefore not suited for bulk production.
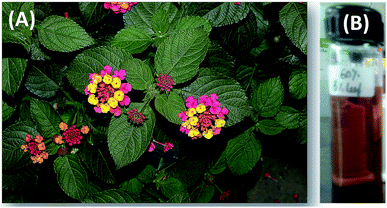
Lantana camara,14 a decorative garden plant is also considered as a notorious weed (Fig. 1A). It has various worldwide applications in the biomedical field. It is also identified as ‘Spanish Flag’, ‘Wild Sage’, ‘Ghaneri’. This herb has recently been recognized for its natural health care potential aimed at restoring and protecting health. It acts as antibacterial and antifungal agent and is also used in HIV patients for boosting of immune system. It also acts as potential anti-tumor agents due to the presence of flavonoids and phenylpropanoid.15,16 Glycosides extracted from Lantana camara leaves have been reported to show significant hypoglycemic effect in mice.17–19 Its methanolic extracts are active against Plasmodium falciparum both in vitro and in vivo.20
In this manuscript we report, a green route for synthesizing silver nanoparticles using Lantana camara leaf extract (polyphenol), which acts as both, the reducing and stabilizing agent.21 Earlier, Lantana camara extract had been used for Ag0 nanoparticles synthesis,22 while this is the report aimed at its application towards size-controlled green synthesis of Ag0 nanoparticles.
Result and discussion
It is well known that the aqueous solution of silver nanoparticles appears yellowish brown because of silver nanoparticles' surface plasmon in the excited state. The addition of leaf extract to the aqueous solution of silver ions (AgNO3 aqueous solution) results gradual change in the colour of the solution (from slightly green to yellowish) which indicates the reduction of silver ions (Ag+) and the formation of silver nanoparticles (Ag0) (Fig. 1B).This indicates the synthesis of silver nanoparticles, which was further confirmed by UV-visible spectroscopy. Fig. 2 shows the UV-Vis spectra of the reaction medium after 5 hours. Silver nanoparticles formed in the reaction medium possess maximum absorbance at 430 nm.23 After a reaction time of 5 hours, peak broadening at 430 nm is observed. This specifies that the particles are poly-dispersed. For optimization reaction parameters, various % of leaf extract and silver solution concentration were taken. Initially 5% leaf extract was added to four different concentrations (2, 3, 4 and 5 mM) of silver nitrate solution medium.
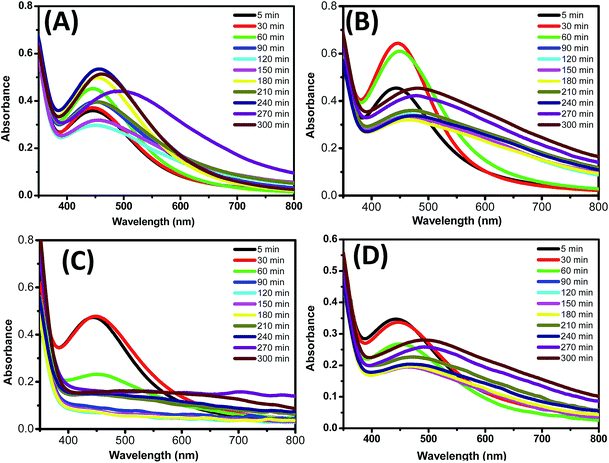 | ||
| Fig. 2 UV-visible spectra measurement of silver nanoparticles synthesis at different conc. of AgNO3. (A) 2 mM AgNO3 solution (B) 3 mM AgNO3 solution (C) 4 mM AgNO3 solution (D) 5 mM AgNO3 solution. | ||
Out of four different AgNO3 solution applied for nanoparticle synthesis, in the case of 3 mM conc., Ag0 nanoparticles synthesis was observed in just 30 minutes as can be seen in Fig. 2B. Based on our result we can say that 3 mM conc. of AgNO3 solution is best for better shape control and quick nanoparticle synthesis. Second parameter was optimized by keeping 3 mM silver solution as constant and varying % leaf extract (1, 5, 10 and 20%). Fig. 3 shows that 10% leaf extracts demonstrated best results out of four different concentrations used.24 Therefore based on above result, it was observed that 3 mM AgNO3 solution and 10% leaf extract was the most suitable combination for size controlled Ag0 nanoparticles synthesis. The morphology and formation of Ag0 nanoparticles (3 mM AgNO3 solution and 10% leaf extract) using Lantana camara leaf extract was further studied by characteristic absorption bands in FTIR spectrum, X-ray diffraction pattern, DLS, Zeta-potential scanning and transmission electron microscope images.25
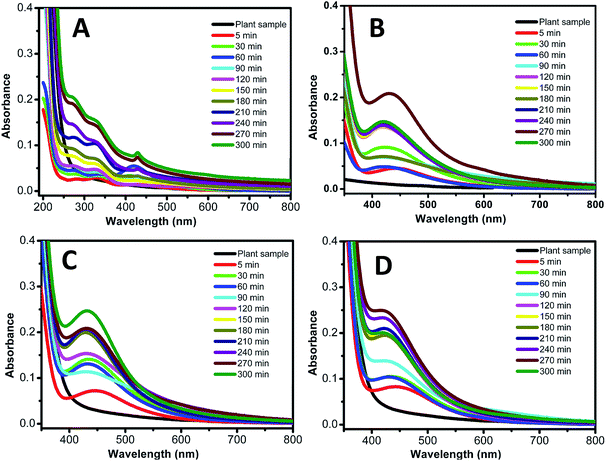 | ||
| Fig. 3 UV-visible spectra measurement of silver nanoparticles synthesis at different percent of leaf extract. (A) 1% leaf extract. (B) 5% leaf extract. (C) 10% leaf extract. (D) 20% leaf extract. | ||
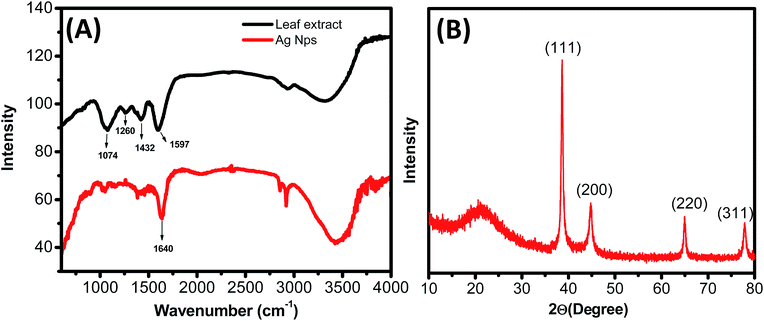
Fig. 4A shows FTIR absorption spectra of water soluble leaf extract and Ag0 nanoparticle. Major absorbance peaks of leaf extract were observed at 1074, 1260, 1432, 1597 cm−1. All above absorbance peaks are associated with the stretching vibrations for C–O (polyols), C–O (esters, ethers) –C–C–C–O, –C–C– [(in-ring) aromatic], and –C–C– [(in-ring) aromatic] respectively.26 Absorption peak at 1260 cm−1 appear due to the presence of C–O group of polyols. It is well known that polyols are mainly accountable for the reduction of Ag+ ions.
Contribution of polyol groups for Ag0 synthesis is verified by complete disappearance of this band in FTIR spectrum after the Ag+ ions bio-reduction. The oxidation of polyol groups to unsaturated carbonyl groups leads to a broad peak at 1640 cm−1 because of Ag+ ions reduction.
The study of crystalline nature and particles size analysis of as synthesized Ag0 nanoparticles was carried out by X-ray diffraction (XRD). The XRD exhibits peaks corresponding to the face centered cubic structure of Ag0 nanoparticles (Fig. 4B).
2θ peaks values at 38.06, 43.56, and 64.37, and 77.24 correspond to (111), (200), (220) and (311) planes, respectively.27 X-ray diffraction pattern confirms that the Ag0 nanoparticles formed by the reduction of Ag+ ions through lantana leaves extract are nano-crystalline in nature. Average size of Ag Nps calculated from XRD data by applying Debye–Scherer equation is ∼40 ± 2.8 nm.
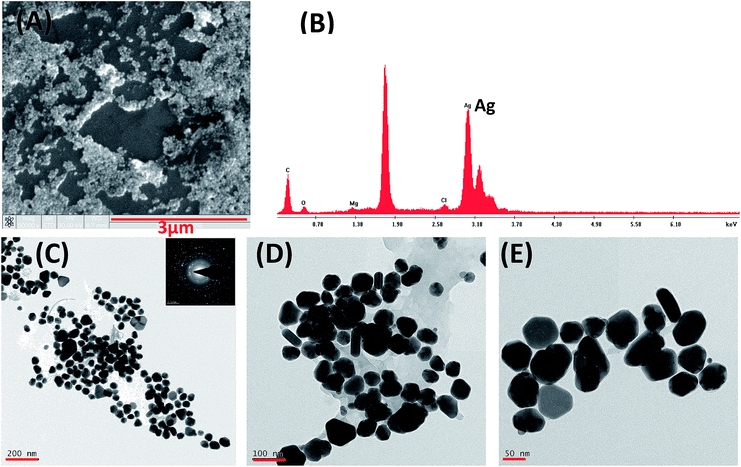
Ag0 nanoparticles sample was further examined by scanning electron microscopy (SEM). Ag0 nanoparticles appear as organized large assembly due to the resolution limitation of SEM (Fig. 5A). Edax analysis of Ag0 nanoparticles SEM shows presence of Ag0 (Fig. 5B). The organized large assembly of Ag0 nanoparticles in SEM evolves due to solution drying process and do not represent the situation in the solution. To better understand the morphologies of Ag0 nanoparticles transmission electron microscopy (TEM) was performed (Fig. 5C–E) that illustrate the round and rod-needle type shape anisotropy. Fig. 5C (inset) demonstrates the diffraction pattern of TEM image which evident of crystalline nature of Ag0 nanoparticles (identical with XRD). As seen in Fig. 5D, a thin layer of Lantana leaf extract surrounds the Ag0 nanoparticles surface, adding to its stability.28
Hydrodynamic radius of Ag0 nanoparticles was analyzed at a constant shutter opening diameter in the DLS apparatus. DLS measurements for Ag0 nanoparticles exhibit hydrodynamic radii of about ∼41.8 nm (Fig. 6A). This hydrodynamic radius was also confirmed by analysis of XRD and TEM results. Polydispersity index of Ag0 nanoparticles in DLS experiment was 0.297, which is considered as excellent for their biomedical applications.
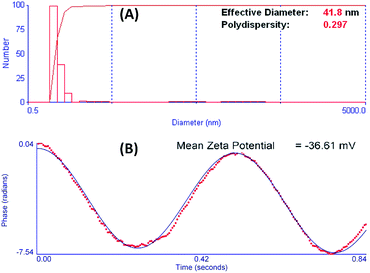 | ||
| Fig. 6 (A) DLS and zeta Potential results for Ag Nps showing hydrodynamic radius of ∼41.8 nm and (B) zeta potential value of Ag Nps showing −36.61 mV. | ||
Stability of Ag0 nanoparticles was measured by using zeta potential measurement. The zeta potential states the electrical potential on nanoparticle boundary and can be used to determine the nanoparticle surface charge. The zeta potential value for this sample was −36.61 mV.29 Zeta potential value of −36.61 mV in solution state is considered as excellent to prevent agglomeration; hence were highly stable.
These Ag0 nanoparticles synthesized by green approach were found to be extremely toxic to two pathogenic multidrug resistant bacteria (E. coli and S. aureus).
Lowest concentration of compound which inhibits the visible growth of microbes on the culture plate is called minimum inhibitory concentration (MIC). Initially the minimum inhibitory concentration (MIC) of Ag0 nanoparticles was studied by treating both the microorganisms with different concentrations (10, 20, 30, 40, 50, 60, 70, 80, 90, 100 ppm) of Ag nanoparticles.
Minimum inhibitory concentrations of Ag nanoparticles were determined on both bacterial cultures. Optical density of both bacterial suspensions was measured at 600 nm wavelength, and same absorbance of bacterial suspension was fixed and preserved throughout the process. MIC against E. coli was found to be 50 ppm, whereas it was 60 ppm for S. aureus.30
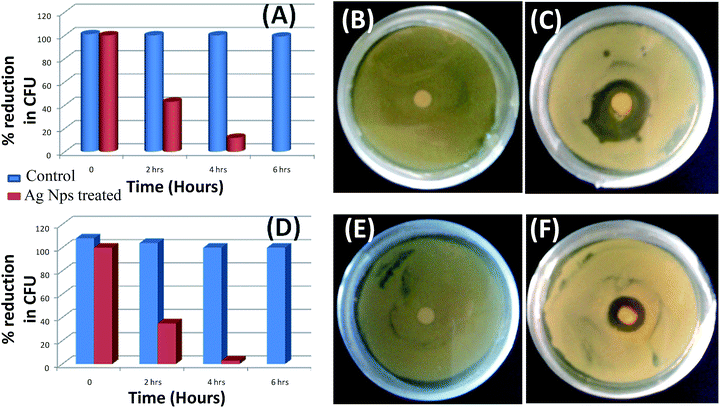
Based on the MIC concentration, antibacterial activity of Ag+ nanoparticles was performed on both the bacterial culture, which shows that it took 6 hours for the complete inhibition in contact mode method (Fig. 7A and D). Antibacterial effects of Ag0 nanoparticle obeyed zone growth inhibition action mechanism over both bacterial cell cultures. Control plates of both bacterial cultures showed no inhibition zone (Fig. 7B and E), whereas Ag0 nanoparticle loaded disk exhibited antibacterial activity against E. coli and S. aureus (Fig. 7C and F) respectively.
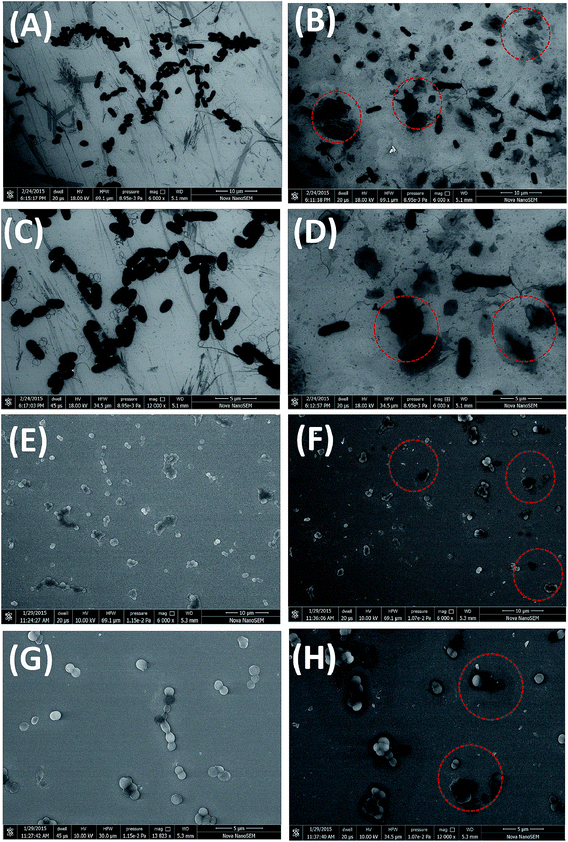
Fig. 8 shows the SEM images of the both bacterial cells culture treated with Ag0 nanoparticle. Control E. coli cells (without Ag0 nanoparticles) are illustrated in Fig. 8A and C expressing clear defined bacterial morphology.31
Ag0 nanoparticles treated E. coli cells show a damage undefined cellular morphology. Effect of the Ag0 nanoparticles on the E coli cell membrane damage and releasing cellular contents are confirmed by SEM image (Fig. 8B and D). Fig. 8C and D shows the resolution SEM images of Fig. 8A and B for better understanding of the effect of Ag0 nanoparticles on bacterial cell morphology. When E. coli cells come in contact with Ag0 nanoparticles they damage E. coli cell membrane resulting in the excretion of the cellular components. Cellular content of E coli cells can be clearly seen in Fig. 8D.32,33
Antibacterial activity of Ag0 nanoparticles was observed on Gram (+) bacteria S. aureus. Fig. 8E exhibits the control S. aureus cells while Fig. 8F shows the Ag0 nanoparticles antibacterial effect. Fig. 8G and H illustrated the resolution SEM image of Fig. 8E and F respectively. Both bacterial cell membranes are found to be damaged and extracellular material released.34 The consequences of damaged cell membrane integrity might be due to the formation of membrane pores leading to leakage of cytoplasmic contents and accumulation of cell debris were also noted (red circle in Fig. 8B, D, F and H).
Conclusion
Leaf extract of the Lantana camara plant has been reported for the bio-reduction of aqueous Ag+ ions to Ag0 metal ions which lead to the formation of well-defined Ag0 nanoparticles. Size control of nanoparticles has been done by analysing various concentrations of silver solution and leaf extract. UV-Vis, FTIR spectroscopy, XRD, SEM and TEM analysis was used to investigate shape and size control of nanoparticles.Analysis of FTIR spectra shows that the polyols present in leaf extract are responsible for reduction of Ag+ ions to Ag0 nanoparticles synthesis. Particle size of nanoparticle around ∼41.8 nm was confirmed by XRD, DLS, and zeta-potential analysis as well as by TEM images. Green synthesized Ag0 nanoparticle show excellent antibacterial activity against Gram (+) and Gram (−) bacteria at fairly low concentration.
Materials and methods
Plant material and preparation of the leaf extract
Lantana camara's aqueous leaf extract was used for nanoparticle synthesis. 25 g leaves of Lantana camara were weighed and thoroughly washed in distilled water to remove dirt and other adherent material. Then the leave were crushed and boiled in 100 mL distilled water for 10 minutes. After it was cooled to room temperature, filtered using Whatman filter paper 1 (pore size 25 μm) followed by 0.45 μm syringe filter. Filtrate solution was referred as stock solution and used directly of Ag0 nanoparticles synthesis.Synthesis of silver nanoparticle
2–5 mM Silver nitrate (AgNO3) aqueous solution was prepared for the synthesis of silver nanoparticles. Lantana camara leaf extract at varying concentration from 1% to 20% v/v was added to silver nitrate solution at room temperature and incubated for 5 hours. Reduction of Ag+ ions to Ag0 nanoparticles into size controlled nanoparticles was optimized by varying the concentration of silver nitrate aqueous solution from 2 mM to 5 mM.UV-visible spectra analysis
Synthesis of Ag nanoparticles was monitored by recording the UV-visible spectrum at different time interval of the reaction medium. Samples were diluted into distilled water before measuring UV spectra. 10 mm quartz cell at 25 ± 0.1 °C was used for UV-Vis spectral analysis on Varian CARY 100 Bio UV-Vis spectrophotometer. Appropriate controls were used wherever required.FTIR measurement
The unreacted biomass filtrate was removed by centrifuging 100 mL of residual solution after synthesis at 5000 rpm for 10 minutes. Then 10 mL sterile distilled water was used for making final sample suspension. Washing process mentioned above was repeated thrice. Subsequently, the final suspension was freeze dried to powder and analysed by FTIR.SEM and TEM analysis of silver nanoparticles
Field emission scanning electron microscopy images were acquired on FEI QUANTA 200 microscope, equipped with a tungsten filament gun, operating at WD 10.6 mm and 20 kV. The samples were dried overnight at room temperature and images were recorded without gold coating. TEM measurements were performed on Tecnai F 30 instrument operated at an accelerating voltage of 300 kV. Fine films of the nanoparticles were prepared by drop casting method on a carbon coated copper grid.DLS measurements
DLS measurements were carried out on Brookhaven Instrument model 90 Plus Particle Size Analyzer.Zeta potential
The surface charges of the Ag Nps were determined using a Zeta potential analyzer (Brookhaven Instruments Corporation, NY). The average zeta potentials of the dispersions were determined without any dilution.Antibacterial assays
The minimum inhibitory concentration (MIC) and antibacterial assays were performed on Escherichia coli (ATCC 8739) and Staphylococcus aureus (ATCC 6358) by contact and disc diffusion method. Both the microorganisms were grown in Luria–Bertani (LB) medium. A contact mode inhibition method assures positive interaction between silver nanoparticles and bacteria. Silver nanoparticles were added into bacterial suspension (104 to 106 CFU mL−1) and incubated at 30 °C for 6 h. 100 μL sample was withdrawn after every 2 h to check viability of bacteria. To calculate minimum inhibitory concentration (MIC), different concentration of Ag0 nanoparticles were added to ∼1 × 10⁵ cells per mL (E. coli and S. aureus respectively) and incubated at 28 °C. Defined amount of aliquots were removed at different time interval (0, 2, 4, 6, 8, 10 h) and plated on nutrient agar, incubated at 28 °C for 18–24 h to achieved visible colony forming units. For checking zone of inhibition, overnight grown inoculums of both cultures (5 × 10⁶ CFU mL−1) were applied on plate of LB agar respectively. 6 mm diameter size discs of sterile Whatman paper were loaded with 50 μg mL−1 (50 ppm) silver nanoparticle and placed on previously seeded bacterial culture respectively.Acknowledgements
This work is financially supported by the Council of Scientific and Industrial Research, New Delhi India.Notes and references
- S. Agnihotri, S. Mukherji and S. Mukherji, RSC Adv., 2014, 4(8), 3974–3983 RSC.
- J. L. Gardea-Torresdey, E. Gomez, J. R. Peralta-Videa, J. G. Parsons, H. Troiani and M. Jose-Yacaman, Langmuir, 2003, 19(4), 1357–1361 CrossRef CAS.
- S. Iravani, Green Chem., 2011, 13(10), 2638–2650 RSC.
- P. Raveendran, J. Fu and S. L. Wallen, J. Am. Chem. Soc., 2003, 125(46), 13940–13941 CrossRef CAS PubMed.
- U. K. Parashar, V. Kumar, T. Bera, P. S. Saxena, G. Nath, S. K. Srivastava, R. Giri and A. Srivastava, Nanotechnology, 2011, 22(41) CrossRef CAS PubMed.
- I. Ahmad and A. Z. Beg, J. Ethnopharmacol., 2001, 74(2), 113–123 CrossRef CAS.
- W. Ding and X. P. Hu, Insect Sci., 2010, 17(5), 427–433 Search PubMed.
- S. S. Shankar, A. Ahmad, R. Pasricha and M. Sastry, J. Mater. Chem., 2003, 13(7), 1822–1826 RSC.
- B. Ankamwar, C. Damle, A. Ahmad and M. Sastry, J. Nanosci. Nanotechnol., 2005, 5(10), 1665–1671 CrossRef CAS PubMed.
- J. L. Huang, Q. B. Li, D. H. Sun, W. Y. Shao, N. He, J. Q. Hong and C. X. Chen, Nanotechnology, 2007, 18(10) Search PubMed.
- Z. L. Xue, A. D. Terepka and Y. Hong, Nano Lett., 2004, 4(11), 2227–2232 CrossRef.
- N. R. Jana, L. Gearheart and C. J. Murphy, Adv. Mater., 2001, 13(18), 1389–1393 CrossRef CAS.
- T. M. d. A. Alves, A. F. Silva, A. Smânia Júnior and C. L. Zani, Mem. Inst. Oswaldo Cruz, 2000, 95, 367–373 CrossRef CAS PubMed.
- A. S. Shaukat and I. A. Siddiqui, Phytopathol. Mediterr., 2001, 40, 245–325 Search PubMed.
- S. S. Shankar, A. Ahmad and M. Sastry, Biotechnol. Prog., 2003, 19(6), 1627–1631 CrossRef CAS PubMed.
- N. Misra, M. Sharma, K. Raj, A. Dangi, S. Srivastava and S. Misra-Bhattacharya, Parasitol. Res., 2007, 100(3), 439–448 CrossRef PubMed.
- S. Begum, A. Wahab, B. S. Siddiqui and F. Qamar, J. Nat. Prod., 2000, 63(6), 765–767 CrossRef CAS PubMed.
- B. M. Pour, L. Y. Latha and S. Sasidharan, Molecules, 2011, 16(5), 3663–3674 CrossRef CAS PubMed.
- J. Carrión-Tacuri, A. E. Rubio-Casal, A. de Cires, M. E. Figueroa and J. M. Castillo, Photosynthetica, 2011, 49(3), 321–329 CrossRef PubMed.
- R. Geethalakshmi and D. V. L. Sarada, Int. J. Nanomed., 2012, 7, 5375–5384 CrossRef CAS PubMed.
- R. Pala, R. Pathipati Usha and S. Bojja, J. Nanopart. Res., 2010, 12(5), 1711–1721 CrossRef.
- D. Kumarasamyraja and N. S. Jeganathan, Int. Res. J. Pharm., 2013, 4(5), 203–207 CrossRef CAS.
- C. Jayaseelan, A. Rahuman, G. Rajakumar, A. Zahir and G. Elango, Parasitol. Res., 2011, 109(1), 185–194 CrossRef PubMed.
- P. Mukherjee, A. Ahmad, R. Kumar and M. Sastry, Nano Lett., 2001, 1(10), 515–519 CrossRef CAS.
- P. K. Jain, K. S. Lee, I. H. El-Sayed and M. A. El-Sayed, J. Phys. Chem. B, 2006, 110(14), 7238–7248 CrossRef CAS PubMed.
- K. B. Narayanan and N. Sakthivel, Mater. Lett., 2008, 62(30), 4588–4590 CrossRef CAS PubMed.
- H. Bar, D. K. Bhui and A. Misra, Colloids Surf., A, 2009, 339(1–3), 134–139 CrossRef CAS PubMed.
- J. Zhang, M. R. Langille and C. A. Mirkin, Nano Lett., 2011, 11(6), 2495–2498 CrossRef CAS PubMed.
- S. Marimuthu, A. Rahuman, G. Elango and C. Kamaraj, Parasitol. Res., 2011, 108(6), 1541–1549 CrossRef PubMed.
- K. J. Navare and A. Prabhune, BioMed Res. Int., 2013, 2013, 512495 Search PubMed.
- C. Jayaseelan, A. A Rahuman and G. Elango, Parasitol Res., 2011, 109, 185–194 CrossRef PubMed.
- M. Saravanan and A. Nanda, Colloids Surf., B, 2010, 77, 214–218 CrossRef CAS PubMed.
- M. Saravanan, A. K. Vemu and S. K. Barik, Colloids Surf., B, 2011, 88, 325–331 CrossRef CAS PubMed.
- P. Prakash, P. Gnanaprakasam and M. Saravanan, Colloids Surf., B, 2013, 108, 255–259 CrossRef CAS PubMed.
| This journal is © The Royal Society of Chemistry 2015 |

