DOI:
10.1039/C3RA44191A
(Paper)
RSC Adv., 2014,
4, 82-90
Facile fabrication of the visible-light-driven Bi2WO6/BiOBr composite with enhanced photocatalytic activity†
Received
6th August 2013
, Accepted 21st October 2013
First published on
29th October 2013
Abstract
Novel Bi2WO6/BiOBr composite photocatalysts were prepared by a one-pot EG-assisted solvothermal process in the presence of reactable ionic liquid 1-hexadecyl-3-methylimidazolium bromide ([C16mim]Br). Multiple techniques, such as X-ray diffraction (XRD), X-ray photoemission spectroscopy (XPS), scanning electron microscopy (SEM), transmission electron microscopy (TEM), energy dispersive X-ray spectrometry (EDS), Fourier transform infrared spectroscopy (FT-IR), UV-vis diffuse reflection spectroscopy (DRS), photoluminescence (PL), photocurrent and electrochemical impedance spectroscopy (EIS) were applied to investigate the structures, morphology and photocatalytic properties of as-prepared samples. Compared with bare Bi2WO6 and BiOBr, the Bi2WO6/BiOBr composites exhibited significantly enhanced photocatalytic activity for rhodamine B (RhB) degradation under visible light irradiation. The 50 at% Bi2WO6/BiOBr showed the highest photocatalytic activity under visible light irradiation, which was about 26.6 times and 1.8 times than that of the bare Bi2WO6 and BiOBr, respectively. The Bi2WO6/BiOBr composites also exhibited enhanced photocatalytic activity for bisphenol A (BPA) and methylene blue (MB) degradation under visible light irradiation. The results of PL, photocurrent and EIS indicated that Bi2WO6 and BiOBr could combine well to form a heterojunction structure which facilitated electron–hole separation, and led to the increasing photocatalytic activity. On the basis of the experimental results and estimated energy band positions, the mechanism of enhanced photocatalytic activity was proposed.
1. Introduction
Photocatalysts used for removing environmental pollutants and converting solar energy has attracted more and more attention.1,2 Among numerous Aurivillius-based compounds, Bi2WO6 has attracted much attention for its good photocatalytic performance under visible light irradiation. A variety of methods have been developed to prepare Bi2WO6 photocatalysts, such as solid-state,3 microwave solvothermal4 and hydrothermal reactions.5 In order to further enhance the photocatalytic performance of the Bi2WO6, many methods have been used, for example the doping Bi2WO6 with noble metals6 or with metal-free material g-C3N4,7 C60,8 graphene9 as well as combining Bi2WO6 with semiconductors like Fe2O3,10 Bi2S3,11 CaWO4,12 ZnWO4.13 The results indicate that coupling is an effective means to improve the photocatalytic activity. In particular, the idea of forming heterojunction structures between two photocatalysts may provides a feasible method to promote the separation of photogenerated carriers, leading to an increasing photocatalytic performance.
Bismuth oxyhalides (BiOX, X = Cl, Br, I), an important class of ternary compounds, has caused much attention due to their potential photocatalytic abilities.14–17 It belongs to the family of main group multicomponent metal oxyhalides V–VI–VII, which crystallize in the tetragonal matlockite structure. Among these BiOX catalysts, BiOBr is of great research interest owing to its stability, suitable band gaps and relatively superior photocatalytic abilities. However, photocatalytic activity of the pure BiOBr has been limited by the high recombination of the photogenerated electron–hole pairs, it is still necessary to further enhance its photocatalytic activity for practical applications. Many materials have been coupled with BiOBr, such as AgBr,18 BiOCl,19 ZnFe2O4,20 Ag,21 Fe,22 g-C3N423 or graphene.24 The results indicate that coupling with other materials can enhance the photocatalytic activity of the bare BiOBr. There are few reports about Bi2WO6 coupled with BiOBr to enhance the photocatalytic activity. Depend on estimated energy band positions, it can be speculated that the Bi2WO6 and BiOBr may form suitable VB and CB, which contributing to the separation and transfer of photogenerated electron–hole pairs. At the same time, if we can use applicable approach to prepare uniform Bi2WO6/BiOBr composites, it can be expected that the Bi2WO6/BiOBr composites would have enhanced photocatalytic activity.
In recent years, ionic liquids (ILs) have received more and more attention due to its high ionic conductivity, low melting temperature, thermal stability, wide electrochemical window, high boiling temperature and nearly zero vapor pressures. Because of these advantages of ILs for materials chemistry, a variety of different kinds of materials have been successfully synthesized in ILs, such as metal elementary substance,25 metal oxides,26–28 metal chalcogenides,29 metal inorganic salts.30–32 The research showed that ILs was good dispersing agent, solvent and template, conducive to the synthesis of functional materials. Our group has previously reported BiOBr and BiOI hollow microspheres14,33 synthesized in the presence of reactable ionic liquid [C16mim]Br and [Bmim]I, respectively. The reactable ionic liquids played important roles of solvent, reactant and template at the same time. Therefore, if the Bi2WO6/BiOBr composites can be controlled synthesized in the presence of ionic liquid, it can be expected that the Bi2WO6/BiOBr composites would have enhanced photocatalytic activity.
In this study, we report the novel composites comprising of Bi2WO6 and BiOBr. The Bi2WO6/BiOBr composites have been prepared by a facile one-pot solvothermal method in the presence of reactable ionic liquid [C16mim]Br. During the reactive process, ionic liquid [C16mim]Br act as solvent, reactant and template at the same time, leading the Bi2WO6 and BiOBr coupled well to form microspheres. The photocatalytic degradation of RhB evaluation under the irradiation of visible light, demonstrated that the Bi2WO6/BiOBr composite exhibits much improved photocatalytic activity than bare Bi2WO6 or BiOBr. According to the estimated energy band positions, the mechanism of improved photocatalytic activity for the Bi2WO6/BiOBr composite was also proposed.
2. Experimental
2.1. Material and sample preparation
All the reagents were of analytical purity and were used as received. The ionic liquid [C16mim]Br (1-hexadecyl-3-methylimidazolium bromide) (99%) was purchased from Shanghai Chengjie Chemical Co. Ltd.
2.2. Fabrication of Bi2WO6/BiOBr composite photocatalysts
A typical synthetic procedure for preparing Bi2WO6/BiOBr composite photocatalyst (mole ratio of Bi2WO6/BiOBr samples at 1![[thin space (1/6-em)]](https://www.rsc.org/images/entities/char_2009.gif) :2) was as follows: a mixture of Na2WO4·2H2O (0.25 mmol) and [C16mim]Br (0.5 mmol) was dissolved in 20 mL ethylene glycol under constant stirring. Then 1 mmol of Bi(NO3)3·5H2O was added into the solution and the mixture was stirred for 30 min at room temperature. After that, the suspension was transferred into a 25 mL Teflon-lined stainless steel autoclave up to 80% of the total volume. The autoclave was heated at 140 °C for 24 h, and then cooled down to room temperature naturally. The resulting products were separated by centrifugation, washed with deionized water and alcohol for three times, and then dried under vacuum at 50 °C for 24 h before photocatalytic reaction and further characterizations. According to this method, different mole ratios of Bi2WO6/BiOBr samples at 1:2, 1:1, and 4:1 were obtained and denoted as 33.3 at% Bi2WO6/BiOBr, 50 at% Bi2WO6/BiOBr, and 80 at% Bi2WO6/BiOBr, respectively. For comparison, bare Bi2WO6 and BiOBr were also prepared by the solvothermal method under the same conditions as mentioned above.
:2) was as follows: a mixture of Na2WO4·2H2O (0.25 mmol) and [C16mim]Br (0.5 mmol) was dissolved in 20 mL ethylene glycol under constant stirring. Then 1 mmol of Bi(NO3)3·5H2O was added into the solution and the mixture was stirred for 30 min at room temperature. After that, the suspension was transferred into a 25 mL Teflon-lined stainless steel autoclave up to 80% of the total volume. The autoclave was heated at 140 °C for 24 h, and then cooled down to room temperature naturally. The resulting products were separated by centrifugation, washed with deionized water and alcohol for three times, and then dried under vacuum at 50 °C for 24 h before photocatalytic reaction and further characterizations. According to this method, different mole ratios of Bi2WO6/BiOBr samples at 1:2, 1:1, and 4:1 were obtained and denoted as 33.3 at% Bi2WO6/BiOBr, 50 at% Bi2WO6/BiOBr, and 80 at% Bi2WO6/BiOBr, respectively. For comparison, bare Bi2WO6 and BiOBr were also prepared by the solvothermal method under the same conditions as mentioned above.
2.3. Characterization
X-ray powder diffraction (XRD) analysis was carried out on a Bruker D8 diffractometer with high-intensity Cu-Kα (λ = 1.54 Å). X-ray photoemission spectroscopy (XPS) was recorded on a VG MultiLab 2000 system with a monochromatic Mg Kα source operated at 20 kV. The field-emission scanning electron microscopy (FE-SEM) measurements were carried out with a field-emission scanning electron microscope (JEOL JSM-7001F) equipped with an energy-dispersive X-ray spectroscope (EDS) operated at an acceleration voltage of 10 kV. Transmission electron microscopy (TEM) micrographs were taken with a JEOL-JEM-2010 (JEOL, Japan) operating at 200 kV. UV-vis diffuse reflectance spectroscopy was recorded on an UV-2450 spectrophotometer (Shimadzu Corporation, Japan) using BaSO4 as the reference. The structural information for samples was measured by Fourier transform infrared spectrophotometer (FT-IR, Avatar 470, Thermo Nicolet) using the standard KBr disk method. The photoluminescence (PL) spectra of the photocatalysts were detected using a Varian Cary Eclipse spectrometer. Photocurrent and electrochemical impedance spectroscopy (EIS) were performed on an electrochemical workstation (CHI 660B Chen Hua Instrument Company, Shanghai, China).
2.4. Photocurrent and EIS measurements
The photocurrent and EIS measurements were conducted by using an electrochemical analyzer (CHI660B, Chen Hua Instruments, Shanghai, China) with a standard three-electrode configuration, which employed a Pt wire as a counter electrode, a saturated Ag/AgCl electrode as a reference electrode and indium tin oxide (ITO) as working electrode. A 500 W Xe lamp was used as photosource. The ITO glass was cut into 3 cm × 1 cm slices and successively bathed in 1 M NaOH solution for 10 min and acetone for 30 min, then washed with water and dried prior to use. 10 mg of samples was dispersed ultrasonically in 2 mL of absolute ethanol, and 20 μL of the resulting colloidal dispersion (5 mg mL−1) was drop-cast onto a piece of ITO slice with a fixed area of 0.5 cm2 and dried in air at room temperature to form Bi2WO6/BiOBr modified ITO electrode. The electrolyte solution of photocurrent was phosphate buffered saline (0.1 mol L−1). The EIS were performed in a 0.1 M KCl solution containing 5 mM Fe(CN)63−/Fe(CN)64−. Sunless conditions were ensured when experiments were carried out.
2.5. Photocatalytic activity measurement
To compare the photocatalytic activity of bare Bi2WO6, bare BiOBr and Bi2WO6/BiOBr with different percentage, a series of photodegradation experiments were carried out by using RhB as target pollutant under the irradiation of visible-light. A 300 W Xe lamp with a 400 nm cutoff filter was used as the light source. Experiments were carried out in a Pyrex photocatalytic reactor with a circulating water system to prevent thermal catalytic effects. In a typical photocatalytic experiment, 0.02 g of Bi2WO6/BiOBr powders was dispersed into 100 mL of RhB (20 mg L−1) solutions. Prior to irradiation, the suspensions were magnetically stirred for 30 min in the dark to achieve a saturated RhB absorption onto the photocatalyst surface. During every irradiation time intervals of 0.5 h, 3 mL suspension was collected and centrifuged to remove the photocatalyst particles. The RhB and MB concentrations were analyzed with a UV-vis spectrophotometer (UV-2450, Shimadzu) at the absorption wavelength 553 nm and MB (664 nm).
The BPA was detected by two Varian ProStar 210 pumps, an Agilent TC-C (18) column, and a Varian ProStar 325 UV-Vis Detector at 230 nm. A solution of methanol and H2O in the ratio 75:25 (v/v) was used as the mobile phase at 1 mL min−1, and 20 μL of the sample solution was injected.
3. Results and discussion
3.1. XRD and XPS analysis
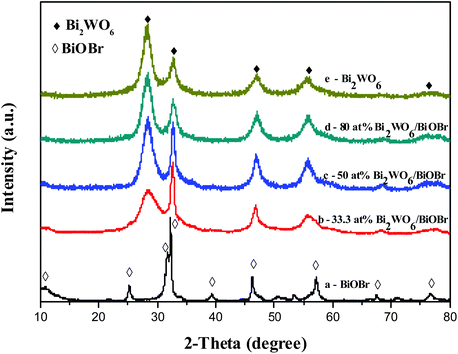
The crystal structure of the products was investigated by the XRD method, as shown in Fig. 1. The results show that the diffraction peaks of the pure Bi2WO6 sample and pure BiOBr sample are in good agreement with the orthorhombic phase of Bi2WO6 (JCPDS card no. 39-0256) and the tetragonal phase of BiOBr (JCPDS card no. 09-0393), respectively. For the Bi2WO6/BiOBr composites, all the Bi2WO6 diffraction peaks were found at Bi2WO6/BiOBr composites. The characteristic peaks of BiOBr (67.4°) can be found at Bi2WO6/BiOBr composites. With the increase of Bi2WO6, the diffraction peaks intensity of Bi2WO6 become stronger, while the characteristic peaks of BiOBr decrease in intensity. The characteristic peak of BiOBr (25.2°) disappeared when the Bi2WO6 content was more than 33.3 at%. While the Bi2WO6 content increased to 80 at%, the characteristic peaks of BiOBr (10.9°) disappeared. This may due to the better crystallinity of Bi2WO6 material, and some of the characteristic peaks of BiOBr coincide with that of Bi2WO6. This result suggests that Bi2WO6 and BiOBr coupled together successfully. Additionally, the peaks of the Bi2WO6/BiOBr composites are broad, which seems to be that the particles of the samples are quite small.
 |
| | Fig. 1 The XRD pattern of the as-prepared Bi2WO6, BiOBr and Bi2WO6/BiOBr hierarchical architectures synthesized at different conditions. | |
To investigate the states of the ions, the 50 at% Bi2WO6/BiOBr composite was studied by X-ray photoelectron spectroscopy (XPS) (Fig. S1†). The XPS results show that the composites were composed of elements of Bi, O, Br, W and C (Fig. S1a†). The carbon peak probably came from the adventitious carbon on the surface of the composite. The high-resolution spectra of Fig. S1b† shows that the two peaks at 159.0 eV and 164.4 eV are assigned to Bi 4f7/2 and Bi 4f5/2, respectively, which is assigned to Bi3+ in the composites. Fig. S1c† shows that the peak at binding energies of 530.0 eV was assigned to O 1s, which is characteristic of oxygen in BiOBr and Bi2WO6 materials. The Br 3d peak is associated with binding energy at 68. 2 eV (Fig. S1d†), which is assigned to Br− in the composites. The binding energies of W 4f5/2 and W 4f7/2 are 37.4 and 35.2 eV, which could be characteristic of W species in the WO6 octahedron (Fig. S1e†). As a result, it can be confirmed that the Bi2WO6/BiOBr composites have been successfully synthesized.
3.2. SEM, TEM and EDS analysis
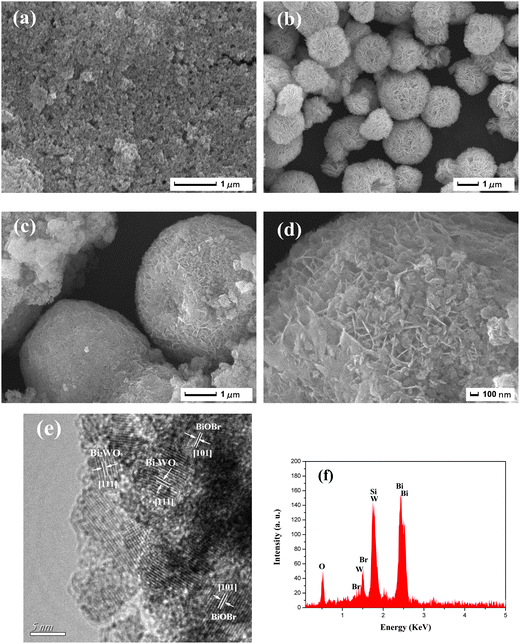
The morphologies of the Bi2WO6, BiOBr and 50 at% Bi2WO6/BiOBr composite were revealed by SEM. Fig. 2a shows the SEM micrographs of pure Bi2WO6 sample. The pure Bi2WO6 exhibits a number of ruleless nanoparticles with sizes about dozens of nanometers. Fig. 2b exhibits the typically sphere-like BiOBr structures with an average diameter of 1–2 μm. The entire sphere-like BiOBr structures consisted of massive BiOBr nanosheets. After the coupling of Bi2WO6 and BiOBr, the 50 at% Bi2WO6/BiOBr composite (Fig. 2c) shows sphere-like BiOBr structures with numerous Bi2WO6 nanoparticles cover on the surface. As can be seen clearly from the high magnification SEM image (Fig. 2d), it is different from the sphere-like BiOBr (Fig. 2b). It is clearly that Bi2WO6 and BiOBr combined well, leading to the formation of a heterostructure. The detailed structure was also characterized by HRTEM (Fig. 2e). By carefully measuring the lattice parameters using a digital micrograph and comparing with the data in JCPDS, the (111) crystallographic plane of Bi2WO6 and (101) crystallographic plane of BiOBr can be found clearly. It indicates that Bi2WO6 and BiOBr have been coupled together to form the heterostructure successfully. Our previous works shows that ionic liquid [C16mim]Br act as solvent, reactant and soft-template at the same time, which play an important role for the synthesis of porous Bi2WO6/BiOBr microspheres.33 The NaBr cannot fulfill the same function of ionic liquid. The EDS pattern (Fig. 2f) indicates that the Bi2WO6/BiOBr composite contains O, Br, W and Bi elements. It proves that the microspheres prepared is the composite of Bi2WO6 and BiOBr.
 |
| | Fig. 2 SEM images of (a) Bi2WO6, (b) BiOBr and (c) 50 at% Bi2WO6/BiOBr composite; (d) the high magnification SEM image of 50 at% Bi2WO6/BiOBr composite; (e) HRTEM images of 50 at% Bi2WO6/BiOBr; (f) EDS of the 50 at% Bi2WO6/BiOBr composite. | |
3.3. FT-IR spectra analysis
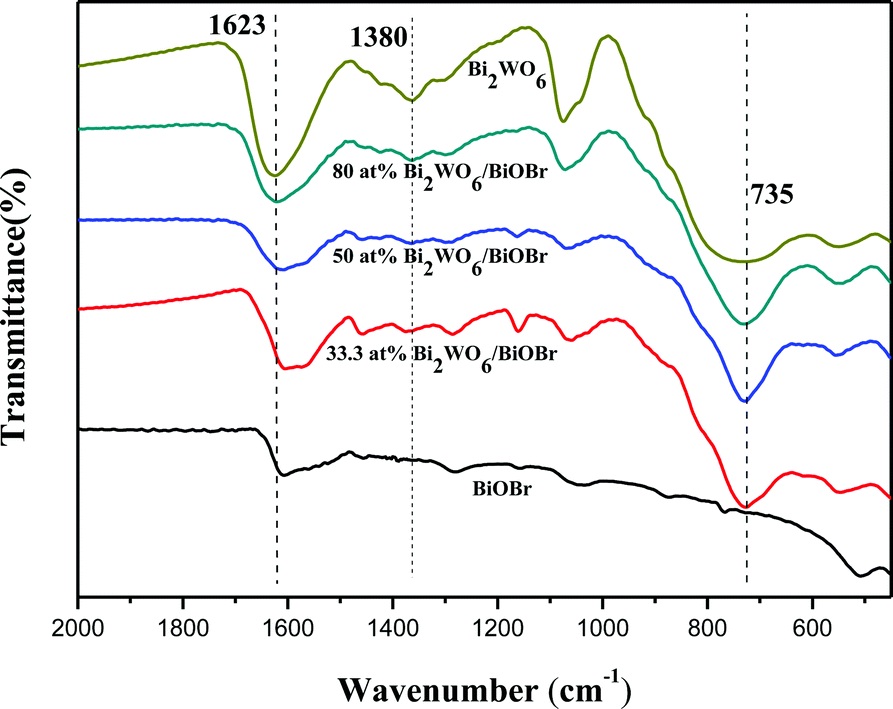
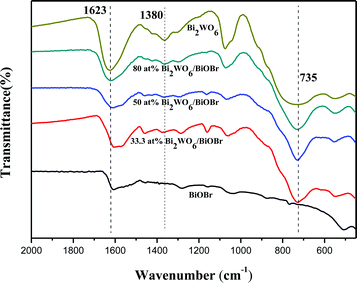
The infrared spectrum of Bi2WO6/BiOBr composites is shown in Fig. 3. The main characteristic peaks of Bi2WO6 and BiOBr are in accordance with the reported results respectively.23,34 The absorption peak existing at 1623 cm−1 is attributed to bending vibrations of O–H, which is ascribed to the water adsorbed. The peak at 735 cm−1 and 1380 cm−1 are attributed to W–O stretching and W–O–W bridging stretching modes which indicating the existence of Bi2WO6. No characteristic absorption peak of the ionic liquids is found in the FT-IR spectra, it shows that the ionic liquid can be easily removed from the surface of the material by washing with deionized water and alcohol. The result of FT-IR spectra analysis is consistent with the result of the EDS analysis.
 |
| | Fig. 3 FT-IR analysis of Bi2WO6, BiOBr and Bi2WO6/BiOBr materials. | |
3.4. Optical absorption properties
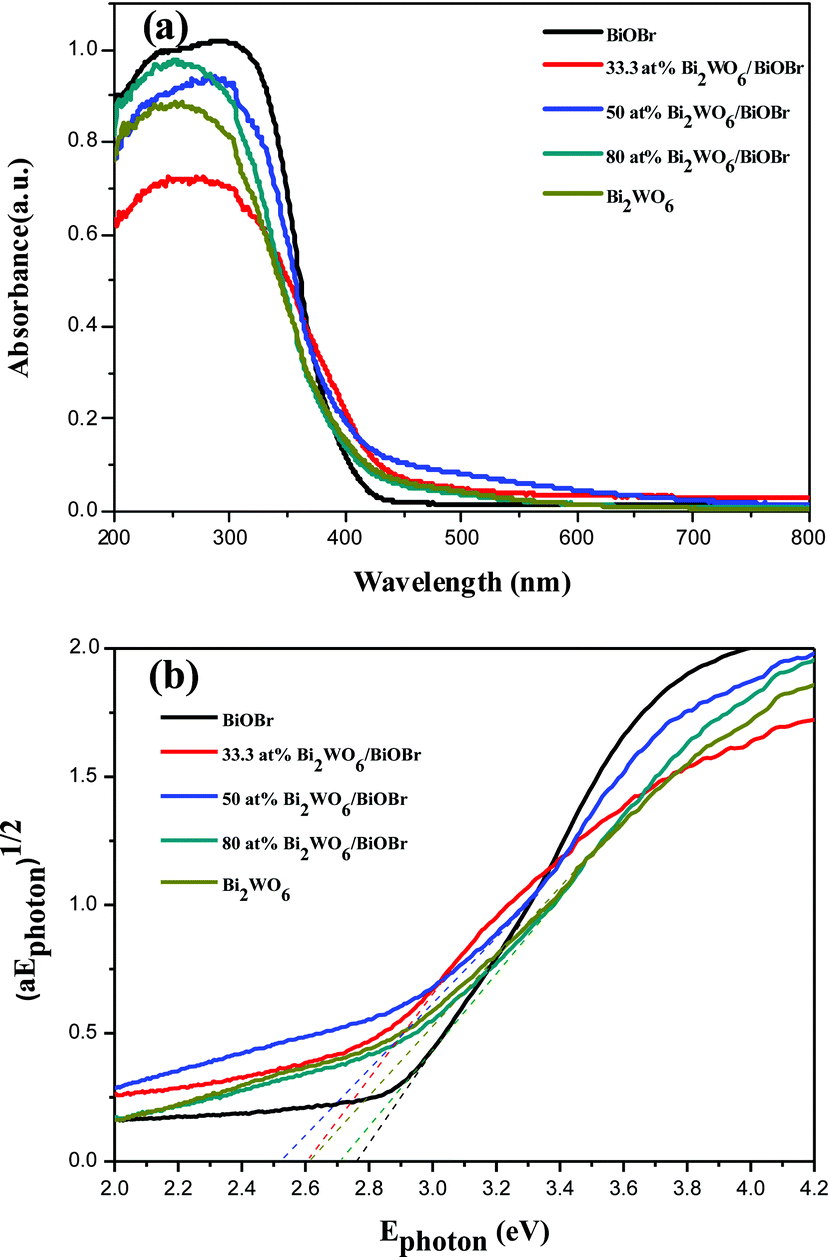
The DRS of the as-prepared samples was shown in Fig. 4. According to the spectrum, bare Bi2WO6 and BiOBr samples present the photoresponse properties from the UV light region to visible light until 400 nm and 390 nm, respectively. Compared with bare BiOBr, the light absorption ability of the Bi2WO6/BiOBr composites is enhanced. The light absorption ability of the composites is the synergistic effect of Bi2WO6 and BiOBr crystal. In the UV-vis spectra, the Bi2WO6/BiOBr composites are red shift when compared with BiOBr. It can be assumed that the red shift of composites is due to the introduction of Bi2WO6 and the coupled together of the two materials. The morphology of the Bi2WO6 and BiOBr are nanoparticles and porous microspheres, respectively. When the content of Bi2WO6 is up 50 at%, the light absorption of the composites is lower than 50 at% Bi2WO6/BiOBr composite. It could be due to the cover of more and more Bi2WO6 on the surface of BiOBr crystal, which will also stop the UV-vis light contacting with BiOBr catalyst. It will reduce the generation of electron–hole pairs under the same visible light irradiation. Taking into account the efficient use of visible light in a large part of the solar spectrum, we believe that the Bi2WO6/BiOBr composite, with its long wavelength absorption band, is an attractive photocatalyst for pollutant degradation. Fig. 4b shows that the band gaps of Bi2WO6/BiOBr composites are about 2.53–2.71 eV. Therefore, when the composite material system was irradiated with visible light, the Bi2WO6 and BiOBr in the composite photocatalysts both absorbed photons, as well as excited electron and hole pairs.
 |
| | Fig. 4 (a) UV-vis diffuse reflectance spectra of the as-prepared samples and (b) (αEphoton)1/2vs. Ephoton curves of the as-prepared samples. | |
3.5. Photoluminescence spectra analysis
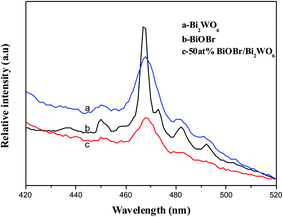
PL spectra is a useful technique to survey the separation efficiency of the photogenerated electron–hole pairs in a semiconductor. After the irradiation happened to the photocatalyst, electron–hole pairs recombination occurs, photons are emitted, leading to photoluminescence. The lower the PL intensity, the smaller probability the photogenerated electron–hole pairs recombination. Fig. 5 presents the PL spectra of Bi2WO6, BiOBr and 50 at% Bi2WO6/BiOBr with an excitation wavelength of 360 nm. It is found that PL emission intensity of the 50 at% Bi2WO6/BiOBr composite is dramatically weakened compared with that of bare Bi2WO6 and BiOBr which clearly indicates that the recombination of photogenerated charge carriers is greatly restrained by the coupling of Bi2WO6 and BiOBr. In other words, the separation efficiency of photogenerated electrons and holes in 50 at% Bi2WO6/BiOBr is higher than those in the bare Bi2WO6 and BiOBr. It can be inferred that the prepared 50 at% Bi2WO6/BiOBr composite having a higher photocatalytic activity than bare Bi2WO6 or BiOBr.
 |
| | Fig. 5 PL spectra of Bi2WO6, BiOBr and 50 at% Bi2WO6/BiOBr materials. | |
3.6. Photocurrent
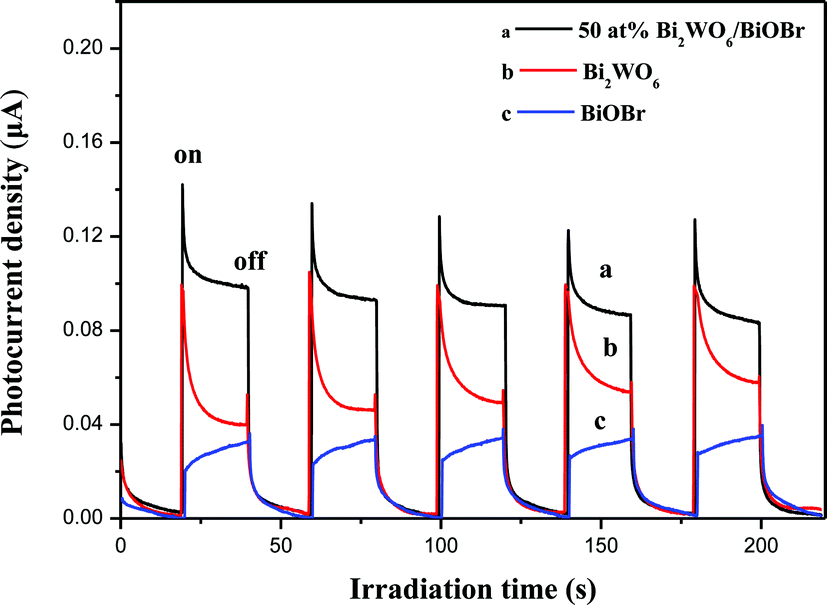
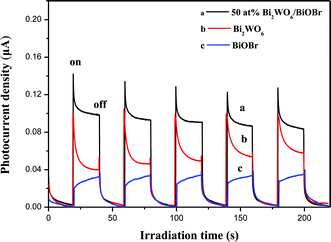
To give further evidence to support the separation efficiency of photogenerated electrons and holes, the transient photocurrent responses of bare Bi2WO6, BiOBr and 50 at% Bi2WO6/BiOBr composite samples were recorded for several on–off cycles of irradiation. Upon light irradiation, the semiconductor generate electrons in the conduction band and holes in the valence band. It was widely accepted that the separation efficiency of electrons and holes played a vital role in the photocatalytic reaction:35 a higher photocurrent would mean the presence of longer living photogenerated electrons and holes and hence the higher the photocatalytic activity would be.36Fig. 6 shows the I–t curves for the three samples with several on–off cycles of intermittent irradiation. As can be seen, the current increased sharply reaching a steady state quickly upon light irradiation. Subsequently, the current returned quickly to its darkcurrent state when the light is turned off. In comparison with bare Bi2WO6 and BiOBr, 50 at% Bi2WO6/BiOBr composite exhibited an increased current density, about 1.8 times and 3 times than that of the bare Bi2WO6 and BiOBr, respectively. The increased current density indicated an enhancing photoinduced electrons and holes separation efficiency, which could be attributed to the junction between BiOBr and Bi2WO6.37
 |
| | Fig. 6 Transient photocurrent response for the bare Bi2WO6, BiOBr and 50 at% Bi2WO6/BiOBr. | |
3.7. Electrochemical impedance spectroscopy
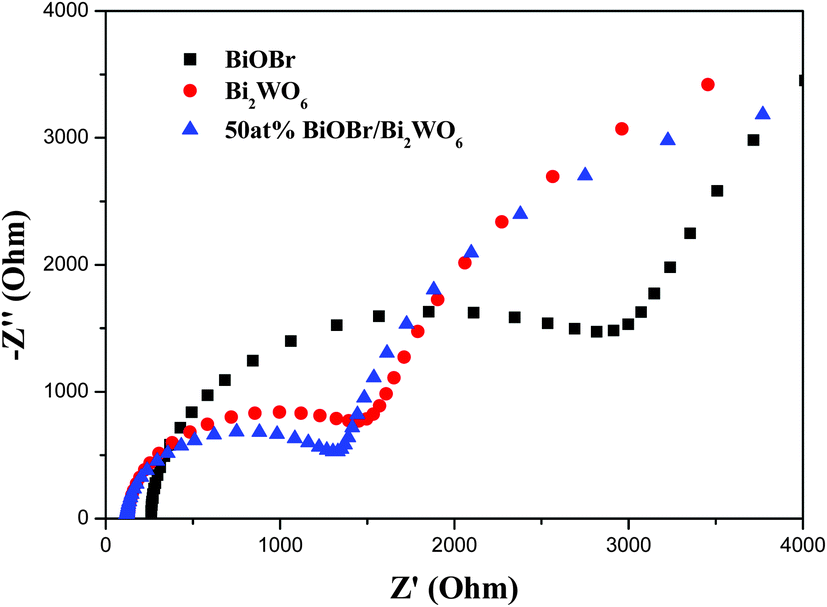
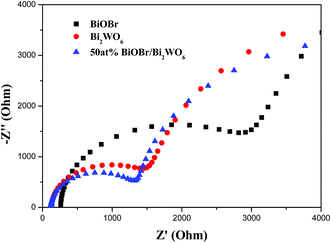
EIS measurement was also used to investigate the charge transfer resistance and the separation efficiency between the photogenerated electrons and holes. Fig. 7 shows EIS Nyquist plots of Bi2WO6, BiOBr and 50 at% Bi2WO6/BiOBr. It can be seen that the arc radius on EIS Nyquist plot of 50 at% Bi2WO6/BiOBr film was smaller than that of Bi2WO6 or BiOBr samples, which meant a fast interfacial charge-transfer process and effective separation of photogenerated electron–hole pairs. This result indicated that the coupling of Bi2WO6 with BiOBr could remarkably enhance the separation efficiency and interfacial charge transfer efficiency of photogenerated electron–hole pairs,38 which then contributing to the enhancing photocatalytic activity. The results of the PL, photocurrent and EIS are consistent.
 |
| | Fig. 7 Electrochemical impedance spectroscopy of bare Bi2WO6, BiOBr and 50 at% Bi2WO6/BiOBr. | |
3.8. Photocatalytic performance
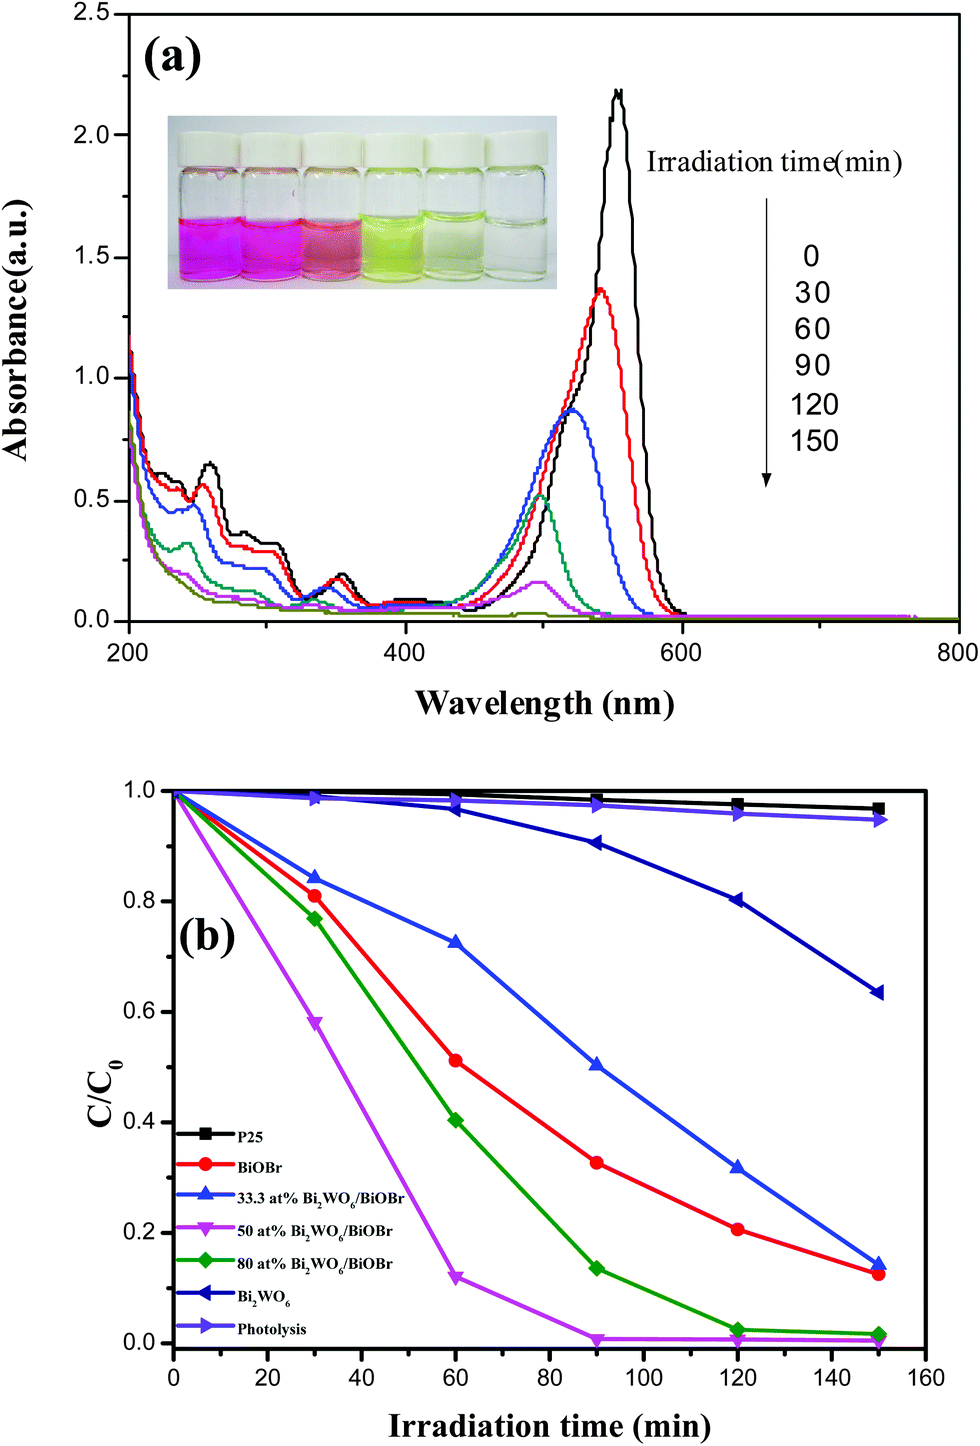
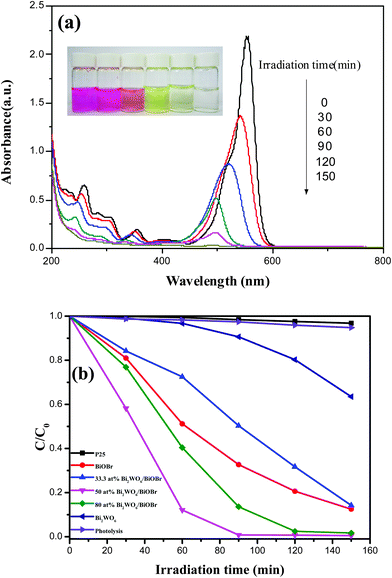
In order to compare the photocatalytic activity of bare Bi2WO6, BiOBr and Bi2WO6/BiOBr with different Bi2WO6 contents, photodegradation experiments were carried out by using RhB as a target pollutant under visible-light irradiation (λ > 400 nm). Fig. 8a showed the temporal UV-vis absorption spectral changes during the photocatalytic degradation of RhB in aqueous solution in the presence of 50 at% Bi2WO6/BiOBr. An evident decrease in RhB absorption at λ = 553 nm was observed, accompanied by a shift in the absorption band toward the blue region. The shift can be attributed to the step-by-step de-ethylation process and the RhB dye was photodegraded into four intermediates which have been definitely determined with LC-MS technique in the previous works.24,33 After the irradiation for 150 min, both the maximum absorption peak and absorption at λ = 553 nm disappeared, which indicates that RhB could be completely decolorized by using 50 at% Bi2WO6/BiOBr. As it can be seen clearly that the color of RhB solution changed from a starting red to light yellow and become colourless at last. Fig. 8b displays the photocatalytic activities of different catalysts in the degradation of RhB under visible-light irradiation. Simple RhB photolysis was also performed for comparison. As Fig. 8b shown, the blank experiment in the absence of photocatalysts demonstrated that photolysis of RhB can be ignored under the visible light irradiation. The commercial P25 was also used as the photocatalyst and the photocatalytic activity is poor, it also can be ignored under the visible light irradiation. As is shown that the Bi2WO6/BiOBr catalysts exhibit much higher photocatalytic activities than the bare Bi2WO6 and the 50 at% Bi2WO6/BiOBr shows the highest photocatalytic activity. It can be seen that the RhB degradation over bare Bi2WO6 and BiOBr are 3.3% and 48.8% after 60 min of visible-light irradiation, respectively. While the RhB degradation over 50 at% Bi2WO6/BiOBr is 87.9% after 60 min of visible-light irradiation, about 26.6 and 1.8 times greater than that of Bi2WO6 and BiOBr, respectively. It indicated that the coupling of Bi2WO6 and BiOBr increases the photocatalytic activity. However, the contents of Bi2WO6 and BiOBr have a significant effect on the photocatalytic performance of the Bi2WO6/BiOBr composite photocatalysts. When the Bi2WO6 content is higher than 50 at%, a further increase of Bi2WO6 content causes a decrease in the photocatalytic activity of RhB degradation. Although the coupling of Bi2WO6 and BiOBr is beneficial for charge separation of the Bi2WO6/BiOBr photocatalyst, but too many Bi2WO6 cover on the surface of BiOBr will hinder the BiOBr absorb visible light. This could lead to the decrease of light absorption with the too much increasing content of Bi2WO6. Similar results were reported in the literatures.23,39 In order to further test the photocatalytic ability of the Bi2WO6/BiOBr composites, the bisphenol A (BPA) and methylene blue (MB) were chosen as the representative model organic pollutants. Fig. S2† shows the photocatalytic degradation of BPA and MB in the presence of BiOBr, Bi2WO6, 50 at% Bi2WO6/BiOBr under visible light irradiation. The blank experiment without photocatalyst indicated that direct photolysis of BPA and MB under the same conditions could almost be neglected. The 50 at% Bi2WO6/BiOBr composite also exhibits higher photocatalytic activity than pure Bi2WO6 and BiOBr. The composite is beneficial to improve the photocatalytic activity.
 |
| | Fig. 8 (a) Temporal UV-vis absorption spectral changes during the photocatalytic degradation of RhB in aqueous solution in the presence of 50 at% Bi2WO6/BiOBr, (b) effects of P25, Bi2WO6, BiOBr and Bi2WO6/BiOBr with different Bi2WO6 contents on RhB photocatalytic degradation efficiency. | |
3.9. The proposed mechanism
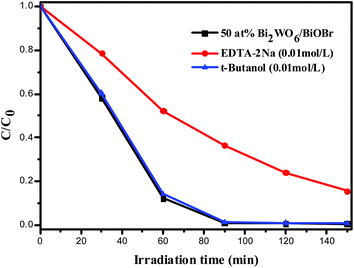
In order to investigate the possible mechanisms involved in RhB photodegradation over the Bi2WO6/BiOBr sample, EDTA-2Na was used as a hole scavenger,40 and t-BuOH was used as an electron acceptor.41 It turned out that the rate of RhB photodegradation decreased notably in the presence of EDTA-2Na, and it was slightly depressed upon addition of t-BuOH (Fig. 9). This result indicated that the photogenerated holes were the main oxidative species of the Bi2WO6/BiOBr system. The nitrogen adsorption and desorption isotherms was carried out to characterize the specific surface areas of Bi2WO6/BiOBr composite. The BET specific surface area of Bi2WO6, 33.3 at% Bi2WO6/BiOBr, 50 at% Bi2WO6/BiOBr, 80 at% Bi2WO6/BiOBr and BiOBr was calculated to be 89.91 m2 g−1, 36.39 m2 g−1, 59.95 m2 g−1, 62.83 m2 g−1 and 19.14 m2 g−1, respectively. The BET of the composites are increased with the contents of Bi2WO6 increased. It is known that the larger specific surface areas can absorb more active species and reactants on its surface. But in this system, the most efficient photocatalyst is 50 at% Bi2WO6/BiOBr, not the Bi2WO6 which own the largest BET. It can be assumed that BET is not the main influence factor for the photocatalytic activity of the Bi2WO6/BiOBr composites. In order to analysis the mechanism of the improved photocatalytic activity of the Bi2WO6/BiOBr composite, the potentials of the conduction band (CB) and valence band (VB) edges of Bi2WO6 and BiOBr were investigated, since the band-edge potential levels play a important role in determining the flowchart of photogenerated electrons and holes in a heterojunction. The potentials of the CB and VB edges of Bi2WO6 and BiOBr were evaluated by Mulliken electronegativity theory42ECB = X + E0 − 0.5Eg, where ECB is the conduction band edge potential, X is the electronegativity of the semiconductor, which can be expressed as the geometric mean of the absolute electronegativity of the constituent atoms. The X values of Bi2WO6 and BiOBr are calculated to be 6.36 and 6.176 eV, respectively.11,43E0 is the energy of free electrons on the hydrogen scale (ca. −4.5 eV). Eg is the band gap energy of the photocatalyst, and the Eg values of Bi2WO6 and BiOBr are about 2.6 and 2.76 eV from the DRS, respectively. The ECB of Bi2WO6 and BiOBr were calculated to be 0.56 eV and 0.296 eV, respectively. The valence band edge potential (EVB) can be acquired by formula ECB = EVB − Eg. Therefore, the EVB of Bi2WO6 and BiOBr were estimated to be 3.16 eV and 3.056 eV, respectively.
 |
| | Fig. 9 Comparison of photocatalytic activities of 50 at% Bi2WO6/BiOBr catalyst for the degradation of RhB with or without adding EDTA-2Na and t-butanol under visible light irradiation. | |
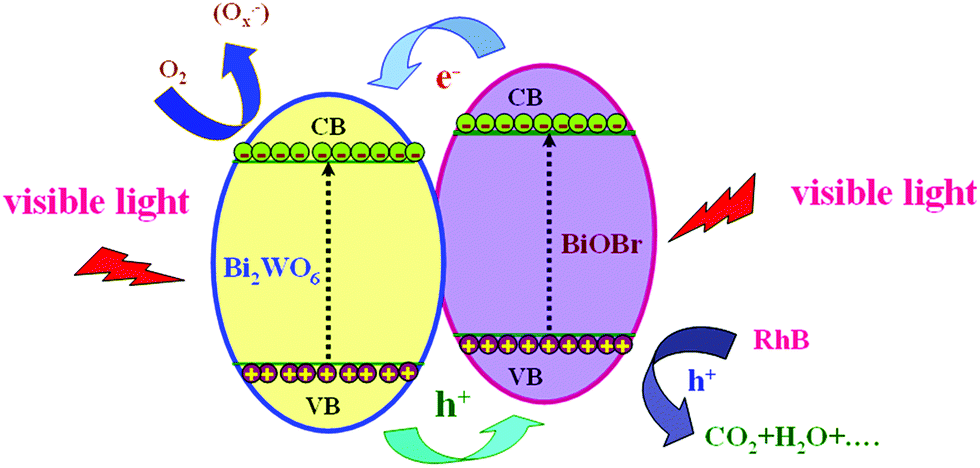
Based on the experimental and theoretical results, the reaction mechanism diagram of Bi2WO6/BiOBr composites was presented in Fig. 10. Both Bi2WO6 and BiOBr could be easily excited under visible light irradiation and corresponding photoinduced electron–hole pairs are generated. Due to the CB edge potential of BiOBr (0.296 eV) being more negative than that of Bi2WO6 (0.56 eV), and the VB of Bi2WO6 (3.16 eV) being more positive than that of BiOBr (3.056 eV), the local electric field at the Bi2WO6/BiOBr interface pushes the photogenerated electrons toward the CB of Bi2WO6, and holes on the VB of Bi2WO6 migrate to that of BiOBr at the same time. This band offset could lead to the retardation of the photogenerated electron–hole recombination rate. In such a way, the photogenerated electrons can be effectively collected by Bi2WO6 and holes can be effectively collected by BiOBr. Therefore, the efficiently separation of photogenerated electrons and holes can be achieved, and the recombination process of electron–hole pairs can be hindered, in accordance with the result of the PL, photocurrent and EIS. Therefore, the Bi2WO6/BiOBr composite exhibits enhanced performance as compared to bare Bi2WO6 and BiOBr.
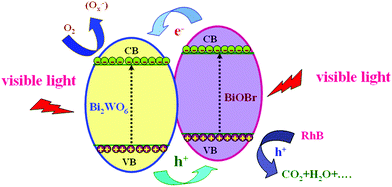 |
| | Fig. 10 A schematic illustration of rhodamine B degradation over Bi2WO6/BiOBr composite photocatalysts under visible light irradiation. | |
4. Conclusions
Novel visible-light-driven Bi2WO6/BiOBr composite photocatalysts have been successfully synthesized by a facile one-pot solvothermal method in the presence of reactable ionic liquid [C16mim]Br. The Bi2WO6/BiOBr composites show sphere-like structures with numerous Bi2WO6 nanoparticles cover on the surface. The Bi2WO6/BiOBr composites also exhibit enhanced photocatalytic activity for RhB, BPA and MB degradation under visible light irradiation. The highest degradation efficiency of RhB was observed for the 50 at% Bi2WO6/BiOBr sample, about 26.6 and 1.8 times than that of Bi2WO6 and BiOBr, respectively. The PL, EIS and photocurrent analysis shown that 50 at% Bi2WO6/BiOBr sample has lower PL intensity, smaller electron transfer resistance and higher photocurrent intensity than bare Bi2WO6 and BiOBr. The radicals trap experiment demonstrates that hole was the main reactive species for the degradation of pollutants. Based on the analysis results, a photocatalytic mechanism was proposed as well as discussed. The high photocatalytic activity of the heterojunction materials could be attributed to the strong coupling between Bi2WO6 and BiOBr, which facilitated interfacial charge transfer and inhibited electron–hole recombination. This novel heterojunction materials may have potential applications in pollutant removal as highly efficient photocatalysts.
Acknowledgements
This work was financially supported by the National Nature Science Foundation of China (no. 21206060, 21007021 and 21177050), China Postdoctoral Science Foundation (2012M510125), Jiangsu Province (1102118C), and the Special Financial Grant from the China Postdoctoral Science Foundation (2013T60506).
References
- Z. G. Zou, J. H. Ye, K. Sayama and H. Arakawa, Nature, 2001, 414, 625 CrossRef CAS PubMed.
- R. Asahi, T. Morikawa, T. Ohwaki, K. Aoki and Y. Taga, Science, 2001, 293, 269 CrossRef CAS PubMed.
- A. Kudo and S. Hijii, Chem. Lett., 1999, 1103 CrossRef CAS.
- L. Wu, J. H. Bi, Z. H. Li, X. X. Wang and X. Z. Fu, Catal. Today, 2008, 131, 15 CrossRef CAS.
- C. Zhang and Y. F. Zhu, Chem. Mater., 2005, 17, 3537 CrossRef CAS.
- D. J. Wang, G. L. Xue, Y. Z. Zhen, F. Fu and D. S. Li, J. Mater. Chem., 2012, 22, 4751 RSC.
- Y. J. Wang, X. J. Bai, C. S. Pan, J. He and Y. F. Zhu, J. Mater. Chem., 2012, 22, 11568 RSC.
- S. B. Zhu, T. G. Xu, H. B. Fu, J. C. Zhao and Y. F. Zhu, Environ. Sci. Technol., 2007, 41, 6234 CrossRef CAS PubMed.
- J. Zhang, Z. H. Huang, Y. Xu and F. Y. Kang, J. Am. Ceram. Soc., 2013, 96, 1562 CrossRef CAS.
- Y. D. Guo, G. K. Zhang, J. Liu and Y. L. Zhang, RSC Adv., 2013, 3, 2963 RSC.
- Z. J. Zhang, W. Z. Wang, L. Wang and S. M. Sun, ACS Appl. Mater. Interfaces, 2012, 4, 593 CAS.
- Y. D. Guo, G. K. Zhang, H. H. Gan and Y. L. Zhang, Dalton Trans., 2012, 41, 12697 RSC.
- D. Q. He, L. L. Wang, D. D. Xu, J. L. Zhai, D. J. Wang and T. F. Xie, ACS Appl. Mater. Interfaces, 2011, 3, 3167 CAS.
- J. X. Xia, S. Yin, H. M. Li, H. Xu, Y. S. Yan and Q. Zhang, Langmuir, 2011, 27, 1200 CrossRef CAS PubMed.
- Y. Y. Liu, W. Son, J. B. Lu, B. B. Huang, Y. Dai and M. H. Whangbo, Chem.–Eur. J., 2011, 17, 9342 CrossRef CAS PubMed.
- J. Y. Xiong, G. Cheng, G. F. Li, F. Qin and R. Chen, RSC Adv., 2011, 1, 1542 RSC.
- J. Y. Xiong, G. Cheng, F. Qin, R. M. Wang, H. Z. Sun and R. Chen, Chem. Eng. J., 2013, 220, 228 CrossRef CAS.
- L. Kong, Z. Jiang, H. H. Lai, R. J. Nicholls, T. C. Xiao, M. O. Jones and P. P. Edwards, J. Catal., 2012, 293, 116 CrossRef CAS.
- H. Gnayem and Y. Sasson, ACS Catal., 2013, 3, 186 CrossRef CAS.
- L. Kong, Z. Jiang, T. C. Xiao, L. F. Lu, M. O. Jones and P. P. Edwards, Chem. Commun., 2011, 47, 5512 RSC.
- L. F. Lu, L. Kong, Z. Jiang, H. H. C. Lai, T. C. Xiao and P. P. Edwards, Catal. Lett., 2012, 142, 771 CrossRef CAS.
- G. H. Jiang, X. H. Wang, Z. Wei, X. Li, X. G. Xi, R. B. Hu, B. L. Tang, R. J. Wang, S. Wang, T. Wang and W. X. Chen, J. Mater. Chem. A, 2013, 1, 2406 CAS.
- J. Fu, Y. L. Tian, B. B. Chang, F. N. Xi and X. P. Dong, J. Mater. Chem., 2012, 22, 21159 RSC.
- X. M. Tu, S. L. Luo, G. X. Chen and J. H. Li, Chem.–Eur. J., 2012, 18, 14359 CrossRef CAS PubMed.
- Z. H. Li, Z. M. Liu, J. L. Zhang, B. X. Han, J. M. Du, Y. N. Gao and T. Jiang, J. Phys. Chem. B, 2005, 109, 14445 CrossRef CAS PubMed.
- K. L. Ding, Z. J. Miao, Z. M. Liu, Z. F. Zhang, B. X. Han, G. M. An, S. D. Miao and Y. Xie, J. Am. Chem. Soc., 2007, 129, 6362 CrossRef CAS PubMed.
- E. Kowsari and G. Faraghi, Mater. Res. Bull., 2010, 45, 939 CrossRef CAS.
- I. Yavari, A. R. Mahjoub, E. Kowsari and M. Movahedi, J. Nanopart. Res., 2009, 11, 861 CrossRef CAS.
- L. Ge, X. Y. Jing, J. Wang, S. B. Jamil, Q. Liu, D. L. Song, J. Wang, Y. Xie, P. P. Yang and M. L. Zhang, Cryst. Growth Des., 2010, 10, 1688 CAS.
- W. W. Wang and Y. J. Zhu, Cryst. Growth Des., 2005, 5, 505 CAS.
- A. Taubert, Angew. Chem., Int. Ed., 2004, 43, 5380 CrossRef CAS PubMed.
- Y. Sun and W. J. Zheng, Dalton Trans., 2010, 39, 7098 RSC.
- J. X. Xia, S. Yin, H. M. Li, H. Xu, L. Xu and Y. G. Xu, Dalton Trans., 2011, 40, 5249 RSC.
- G. K. Zhang, F. Lu, M. Li, J. L. Yang, X. Y. Zhang and B. B. Huang, J. Phys. Chem. Solids, 2010, 71, 579 CrossRef CAS.
- H. Xu, J. Yan, Y. G. Xu, Y. H. Song, H. M. Li, J. X. Xia, C. J. Huang and H. L. Wan, Appl. Catal., B, 2013, 129, 182 CrossRef CAS.
- Q. J. Xiang, J. G. Yu and M. Jaroniec, J. Phys. Chem. C, 2011, 115, 7355 CAS.
- J. Jiang, X. Zhang, P. B. Sun and L. Z. Zhang, J. Phys. Chem. C, 2011, 115, 20555 CAS.
- X. J. Bai, L. Wang and Y. F. Zhu, ACS Catal., 2012, 2, 2769 CrossRef CAS.
- Y. J. Wang, R. Shi, J. Lin and Y. F. Zhu, Energy Environ. Sci., 2011, 4, 2922 CAS.
- X. K. Li, N. Kikugawa and J. H. Ye, Adv. Mater., 2008, 20, 3816 CrossRef CAS.
- H. Lee and W. Choi, Environ. Sci. Technol., 2002, 36, 3872 CrossRef CAS PubMed.
- J. G. Yu, J. F. Xiong, B. Cheng, Y. Yu and J. B. Wang, J. Solid State Chem., 2005, 178, 1968 CrossRef CAS.
- H. F. Cheng, B. B. Huang, P. Wang, Z. Y. Wang, Z. Z. Lou, J. P. Wang, X. Y. Qin, X. Y. Zhang and Y. Dai, Chem. Commun., 2011, 47, 7054 RSC.
Footnote |
| † Electronic supplementary information (ESI) available. See DOI: 10.1039/c3ra44191a |
|
| This journal is © The Royal Society of Chemistry 2014 |