 Open Access Article
Measuring the Brønsted acid strength of zeolites – does it correlate with the O–H frequency shift probed by a weak base?†
Carlos O.
Arean
*a,
Montserrat R.
Delgado
a,
Petr
Nachtigall
b,
Ho Viet
Thang
b,
Miroslav
Rubeš
b,
Roman
Bulánek
c and
Pavla
Chlubná-Eliášová
d
aDepartment of Chemistry, University of the Balearic Islands, 07122 Palma de Mallorca, Spain. E-mail: co.arean@uib.es; Fax: +34 971173426; Tel: +34 971173251
bDepartment of Physical and Macromolecular Chemistry, Faculty of Science, Charles University of Prague, Hlavova 2030, Prague 2, 128 00, Czech Republic
cDepartment of Physical Chemistry, Faculty of Chemical Technology, University of Pardubice, 532 10 Pardubice, Czech Republic
dJ. Heyrovsky Institute of Physical Chemistry, Academy of Sciences of the Czech Republic, 182 23 Prague, Czech Republic
First published on 30th January 2014
Abstract
Brønsted-acid zeolites are currently being used as catalysts in a wide range of technological processes, spanning from the petrochemical industry to biomass upgrade, methanol to olefin conversion and the production of fine chemicals. For most of the involved chemical processes, acid strength is a key factor determining catalytic performance, and hence there is a need to evaluate it correctly. Based on simplicity, the magnitude of the red shift of the O–H stretching frequency, Δν(OH), when the Brønsted-acid hydroxyl group of protonic zeolites interacts with an adsorbed weak base (such as carbon monoxide or dinitrogen) is frequently used for ranking acid strength. Nevertheless, the enthalpy change, ΔH0, involved in that hydrogen-bonding interaction should be a better indicator; and in fact Δν(OH) and ΔH0 are often found to correlate among themselves, but, as shown herein, that is not always the case. We report on experimental determination of the interaction (at a low temperature) of carbon monoxide and dinitrogen with the protonic zeolites H-MCM-22 and H-MCM-56 (which have the MWW structure type) showing that the standard enthalpy of formation of OH⋯CO and OH⋯NN hydrogen-bonded complexes is distinctively smaller than the corresponding values reported in the literature for H-ZSM-5 and H-FER, and yet the corresponding Δν(OH) values are significantly larger for the zeolites having the MWW structure type (DFT calculations are also shown for H-MCM-22). These rather unexpected results should alert the reader to the risk of using the O–H frequency shift probed by an adsorbed weak base as a general indicator for ranking zeolite Brønsted acidity.
1. Introduction
By virtue of their relatively strong Brønsted acidity, zeolites containing the structural unit [Si(OH)Al] (where a proton is attached to an oxygen atom that bridges skeletal tetrahedrally coordinated Si and Al atoms) have a wide range of applications as solid acid catalysts in a broad range of chemical processes. Examples can be found, inter alia, in the petrochemical industry, methanol to olefin conversion and production of fine chemicals.1–12 The strength of their (catalytically active) Brønsted acid sites is a main factor determining the catalytic performance (regarding both activity and selectivity) of protonic zeolites, hence the importance of having a reliable method to evaluate relative acidity, which would help to increase the understanding and optimize the performance of these versatile solid acid catalysts; but quantifying the strength of solid acids can be a delicate task to perform.At variance with aqueous acid solutions for which the corresponding pKa provides a quantitative measure of acid strength, no clear-cut measurements have yet been found for solid acids. Initial attempts at measuring acid strength of protonic zeolites by using amine-based Hammett indicators did not yield consistent results,13,14 and indeed some objections to the use of that method were raised.15,16 Currently, several instrumental techniques are used to gather increasing information on the (relative) Brønsted acidity of protonic zeolites. Among them, calorimetry of an adsorbed base, temperature programmed desorption, IR spectroscopy and solid state NMR17–28 are sometimes combined with catalytic tests of acid strength.
Due (in part) to the ease of its usage, IR spectroscopy of an adsorbed weak base is (arguably) the most widely used technique nowadays for measuring Brønsted acid strength of protonic zeolites, carbon monoxide being the preferred base molecule, although dinitrogen could equally well be used.29–34 In principle, proton transfer between an acid zeolite, ZOH, and a sufficiently strong (adsorbed) base, B, would involve both, hydrogen-bonded and ion-paired intermediates, following eqn (1) below.
| ZOH + B ⇆ ZOH⋯B ⇆ ZO−⋯HB+ ⇆ ZO− + BH+ | (1) |
However, for weak bases the process stops before the ion pair is formed, yielding only the hydrogen-bonded species, ZOH⋯B, which can easily be monitored by IR spectroscopy because hydrogen bonding brings about a distinctive bathochromic shift, Δν(OH), of the O–H stretching mode of the zeolite Brønsted-acid hydroxyl group. Moreover, one would expect that the stronger the Brønsted acid site, the larger should be the value of Δν(OH) (for any given weak base). Hence, direct measurement of Δν(OH) in the infrared spectrum of the hydrogen-bonded complex could, in principle, afford ranking of zeolite acidity. This method was pioneered some time ago by Paukshtis and Yurchenko,35 and more recently reviewed in some detail by Dwyer et al.36 and by Rigby et al.,37 who confirmed the previously proposed logarithmic relationship between Δν(OH) and zeolite acid strength, as probed by adsorbed CO or dinitrogen. On account of its simplicity, direct correlation of Δν(OH) with acid strength is broadly invoked to rank zeolite acidity. However, this method is not free from a number of possible pitfalls, as pointed out by several authors.38–43
Recently, we found out a notable discrepancy in the apparent Brønsted acidity of H-MCM-22 (a zeolite belonging to the MWW structure type) when results obtained by (i) the Δν(OH) method and (ii) direct measurement of the enthalpy of hydrogen-bonding formation with adsorbed CO and dinitrogen were compared with those reported in the literature for other protonic zeolites.44 Herein, we revise those experimental results, and compare them with corresponding calorimetric measurements and DFT calculations. In addition, we report experimental measurements on another H-MCM-22 sample having a different Si![[thin space (1/6-em)]](https://www.rsc.org/images/entities/char_2009.gif) :
:![[thin space (1/6-em)]](https://www.rsc.org/images/entities/char_2009.gif) Al ratio, as well as on H-MCM-56, which is another zeolite having the MWW structure type. The whole set of experimental results is discussed in the broader context of corresponding available data for other protonic zeolites having different structure types, with a particular reference to H-FER.
Al ratio, as well as on H-MCM-56, which is another zeolite having the MWW structure type. The whole set of experimental results is discussed in the broader context of corresponding available data for other protonic zeolites having different structure types, with a particular reference to H-FER.
2. Materials and methods
2.1. Samples
Samples of the isostructural zeolites MCM-22 (Si![[thin space (1/6-em)]](https://www.rsc.org/images/entities/char_2009.gif) :
:![[thin space (1/6-em)]](https://www.rsc.org/images/entities/char_2009.gif) Al = 24.5
Al = 24.5![[thin space (1/6-em)]](https://www.rsc.org/images/entities/char_2009.gif) :
:![[thin space (1/6-em)]](https://www.rsc.org/images/entities/char_2009.gif) 1 and 16.4
1 and 16.4![[thin space (1/6-em)]](https://www.rsc.org/images/entities/char_2009.gif) :
:![[thin space (1/6-em)]](https://www.rsc.org/images/entities/char_2009.gif) 1) and MCM-56 (Si
1) and MCM-56 (Si![[thin space (1/6-em)]](https://www.rsc.org/images/entities/char_2009.gif) :
:![[thin space (1/6-em)]](https://www.rsc.org/images/entities/char_2009.gif) Al = 16
Al = 16![[thin space (1/6-em)]](https://www.rsc.org/images/entities/char_2009.gif) :
:![[thin space (1/6-em)]](https://www.rsc.org/images/entities/char_2009.gif) 1) were prepared, in their sodium form, following procedures described in detail elsewhere,45–47 and checked by powder X-ray diffraction, which confirmed good crystallinity and the absence of any diffraction line not assignable to the corresponding MWW structure type. The Si
1) were prepared, in their sodium form, following procedures described in detail elsewhere,45–47 and checked by powder X-ray diffraction, which confirmed good crystallinity and the absence of any diffraction line not assignable to the corresponding MWW structure type. The Si![[thin space (1/6-em)]](https://www.rsc.org/images/entities/char_2009.gif) :
:![[thin space (1/6-em)]](https://www.rsc.org/images/entities/char_2009.gif) Al ratio was determined by XRF analysis. These parent samples were ion-exchanged into their corresponding NH4+ forms by treating them repeatedly with a 1.0 M aqueous solution of NH4NO3 for 4 hours at room temperature, 100 mL of solution per gram of zeolite. From the ammonium form, the corresponding protonic form was obtained by in situ thermal treatment inside an IR cell, as described below.
Al ratio was determined by XRF analysis. These parent samples were ion-exchanged into their corresponding NH4+ forms by treating them repeatedly with a 1.0 M aqueous solution of NH4NO3 for 4 hours at room temperature, 100 mL of solution per gram of zeolite. From the ammonium form, the corresponding protonic form was obtained by in situ thermal treatment inside an IR cell, as described below.
2.2. Variable-temperature IR (VTIR) spectroscopy: determination of the standard adsorption enthalpy and entropy involved in hydrogen bonding
For IR spectroscopy, a thin self-supported wafer of each zeolite sample (in its ammonium form) was prepared and subjected to thermal treatment in a dynamic vacuum (residual pressure smaller than 10−4 mbar) for 4 h at 673 K inside an IR cell which allowed in situ sample treatment, gas dosage and variable-temperature IR spectroscopy to be carried out.48 After thermal treatment, 0.2 mbar of helium was admitted into the sample compartment (to improve thermal contact between the cell body and the sample wafer) and cooled with liquid nitrogen before recording the zeolite background spectrum at liquid nitrogen temperature; no bands of ammonium ions were seen in any of the spectra, thus proving complete transformation of the ammonium zeolites into their corresponding protonic forms during thermal treatment. The IR cell was then dosed with a fixed amount of either CO or N2 and closed, and series of IR spectra were recorded upon gradual warming up of the cell, while simultaneously registering temperature and gas equilibrium pressure. For that purpose, the cell was equipped with a platinum resistance thermometer (Tinsley) and a capacitance pressure gauge (MKS, Baratron). Pressure correction (for helium) was determined from a calibration plot, as described elsewhere.49 Precision of measurements was better than ±10−2 mbar and ±2 K for pressure and temperature, respectively. Transmission FTIR spectra were recorded, at 2 cm−1 resolution, on a Bruker IFS66 instrument, accumulating 64 scans for each spectrum.It is well known that for both carbon monoxide and dinitrogen, adsorption at a low temperature in protonic zeolites results in hydrogen bonding because of localized interaction of the gas molecules with the Brønsted-acid [Si(OH)Al] groups of the zeolite. Such a process results in progressive erosion of the characteristic O–H stretching band, which is red-shifted when forming the corresponding OH⋯CO or OH⋯N2 complex; simultaneously, the characteristic IR absorption band of the hydrogen-bonded molecule builds up. A set of IR spectra obtained over a temperature range while simultaneously recording IR absorbance, temperature and gas equilibrium pressure inside a closed IR cell can be used to determine the standard enthalpy, ΔH0, and entropy, ΔS0, of the (localized) gas adsorption process.50 The method, termed VTIR spectroscopy, was explained in detail elsewhere,51 and tested not only for hydrogen bonding but also for studying the thermodynamics of gas adsorption on a large number of alkaline zeolites.52,53 However, in order to facilitate understanding of the results reported here, an abridged account is given below.
Referring to hydrogen bonding, let eqn (2) below represent the adsorption equilibrium of a molecule, M, on the adsorption centre, ZOH, representing a zeolite Brønsted-acid site:
| ZOH(s) + M(g) ⇆ ZOH⋯M(ads) | (2) |
| θ = K(T)p/[1 + K(T)p] | (3) |
| K(T) = exp(−ΔH0/RT)exp(ΔS0/R) | (4) |
| ln{θ/[(1 − θ)p]} = (−ΔH0/RT) + (ΔS0/R) | (5) |
| ln{A/[(AM − A)p]} = (−ΔH0/RT) + (ΔS0/R) | (6) |
2.3. Adsorption calorimetry
As a cross-check of the ΔH0 values obtained by VTIR spectroscopy, we performed adsorption calorimetry of carbon monoxide on H-MCM-22 (Si![[thin space (1/6-em)]](https://www.rsc.org/images/entities/char_2009.gif) :
:![[thin space (1/6-em)]](https://www.rsc.org/images/entities/char_2009.gif) Al = 24.5
Al = 24.5![[thin space (1/6-em)]](https://www.rsc.org/images/entities/char_2009.gif) :
:![[thin space (1/6-em)]](https://www.rsc.org/images/entities/char_2009.gif) 1), as well as on a H-FER sample (Si
1), as well as on a H-FER sample (Si![[thin space (1/6-em)]](https://www.rsc.org/images/entities/char_2009.gif) :
:![[thin space (1/6-em)]](https://www.rsc.org/images/entities/char_2009.gif) Al = 27.5
Al = 27.5![[thin space (1/6-em)]](https://www.rsc.org/images/entities/char_2009.gif) :
:![[thin space (1/6-em)]](https://www.rsc.org/images/entities/char_2009.gif) 1) for which VTIR measurements and theoretical (periodic DFT) calculations were already available.54 Calorimetric measurements were performed at a constant temperature of 303 K using a Tian–Calvet type microcalorimeter (Seratam BT2.15) connected to a volumetric apparatus. The sample cell contained 400 mg of the sample, whereas the reference cell was left empty. Before measurements, the zeolite sample was outgassed by slowly increasing the temperature under a dynamic vacuum up to 700 K, after which it was kept at this temperature and a pressure of 10−4 mbar overnight. After this activation of the sample, the cell was placed inside the calorimeter and outgassed to the pressure of 10−6 mbar using a turbo-molecular pump. The CO gas used (99.997% Linde) was further purified by means of freeze–pump–thaw cycles before dosing it into the cell. CO dosing was done via a computer controlled valve following a designed program. After each dose the system was allowed to equilibrate for 45 min. Data of heat flow and pressure–time dependence were collected throughout the whole measurement run, thus allowing calculation of the differential heat of adsorption as a function of the adsorbed amount for each step.
1) for which VTIR measurements and theoretical (periodic DFT) calculations were already available.54 Calorimetric measurements were performed at a constant temperature of 303 K using a Tian–Calvet type microcalorimeter (Seratam BT2.15) connected to a volumetric apparatus. The sample cell contained 400 mg of the sample, whereas the reference cell was left empty. Before measurements, the zeolite sample was outgassed by slowly increasing the temperature under a dynamic vacuum up to 700 K, after which it was kept at this temperature and a pressure of 10−4 mbar overnight. After this activation of the sample, the cell was placed inside the calorimeter and outgassed to the pressure of 10−6 mbar using a turbo-molecular pump. The CO gas used (99.997% Linde) was further purified by means of freeze–pump–thaw cycles before dosing it into the cell. CO dosing was done via a computer controlled valve following a designed program. After each dose the system was allowed to equilibrate for 45 min. Data of heat flow and pressure–time dependence were collected throughout the whole measurement run, thus allowing calculation of the differential heat of adsorption as a function of the adsorbed amount for each step.
2.4. Theoretical calculations
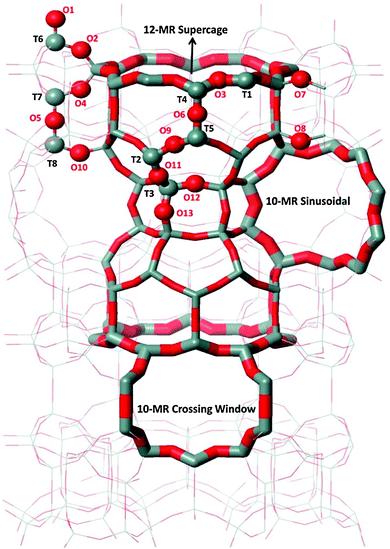
The MCM-22 framework has a hexagonal unit cell, space group P6/mmm (T72O144, where T is either a Si or Al atom), in which there are eight non-equivalent T sites and thirteen non-equivalent framework oxygen atoms. This structure and the atom numbering scheme (following the Database of Zeolite Structures55) are shown in Fig. 1. The channel system including two 10-membered rings (MR) (10-MR sinusoidal and 10-MR crossing windows), as well as the 12-MR supercage are also shown. Calculations were performed with the unit cell (UC) parameters obtained from the Database of Zeolite Structures.55 All calculations were carried out with one framework Al atom (and charge-compensating H+) in the UC, which corresponds to a Si![[thin space (1/6-em)]](https://www.rsc.org/images/entities/char_2009.gif) :
:![[thin space (1/6-em)]](https://www.rsc.org/images/entities/char_2009.gif) Al ratio of 71
Al ratio of 71![[thin space (1/6-em)]](https://www.rsc.org/images/entities/char_2009.gif) :
:![[thin space (1/6-em)]](https://www.rsc.org/images/entities/char_2009.gif) 1; Al was substituted to each of the eight non-equivalent T sites, and all possible symmetrically non-equivalent Brønsted-acid sites were considered.
1; Al was substituted to each of the eight non-equivalent T sites, and all possible symmetrically non-equivalent Brønsted-acid sites were considered.
All calculations were performed with the periodic model using the VASP program package.56,57 The Perdew–Burke–Ernzerhof (PBE) exchange–correlation functional,58,59 the projector augmented wave approximation (PAW)60,61 and the plane wave basis set with a kinetic energy cut-off of 400 eV were used; the Brillouin-zone sampling was restricted to the Γ-point. Geometry optimizations were performed with fixed UC volume and shape, while relaxing the positions of all atoms. At this PBE-optimized geometry the interaction energies were also calculated with dispersion-corrected DFT methods, PBE-D2,62 PBE-D3,63 and vdW-DF2,64 in particular. The C–O stretching frequency of carbon monoxide adsorbed on Brønsted acid sites and the O–H stretching frequencies were evaluated using the ωCO/rCO and νOH/rOH correlation schemes, respectively, described in detail in ref. 54. Only the PBE exchange–correlation functional was used for calculations of vibrational frequencies within the ω/r correlation scheme, since this correlation is with respect to an accurate coupled cluster, CCSD(T), the level of theory following the method previously established.65
Zero-point energies (ZPE) were calculated within the harmonic approximation considering 6 degrees of freedom for CO and 6 degrees of freedom for the Brønsted-acid OH group for the case of Al atoms in the T1 position. Two displacement steps in each direction, with a step size of 0.005 Å, were used to calculate numerically the corresponding second derivatives. Our previous investigation of CO interaction with H-FER54 justifies the use of this ZPE correction for all of the Brønsted-acid sites investigated herein. Adsorption enthalpies are reported for 0 K only.
The substitution energy, ΔE(Al,H), was evaluated following the same strategy as that used by Li et al.66 Therefore, substitution energies calculated herein within the periodic DFT model can be directly compared with those obtained previously based on cluster models.66
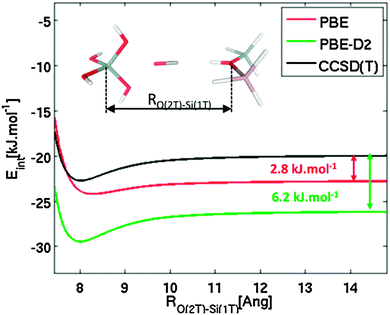
To verify the accuracy of various density functional theory-type methods, accurate CCSD(T) calculations were performed on the cluster model shown in Fig. 2. Interaction energies were calculated for CO interacting primarily with the Brønsted-acid site (represented by the 2T cluster model) and simultaneously with a model of zeolite framework represented by a 1T cluster model; CS symmetry constrain was applied and CO was fixed along the OB(2T) and Si(1T) axis as indicated in Fig. 2. Interaction energies are plotted as a function of separation, RO(2T)–Si(1T), between the two cluster models. Reported CCSD(T) interaction potentials are extrapolated to the complete basis set limit, DFT interaction potentials were obtained using the quadruple-ζ basis set with polarization functions.67,68
3. Results
3.1. Calculations
Interaction energies of CO with Brønsted-acid sites in H-MCM-22 were calculated at PBE-optimized geometries using several exchange correlation functionals, including the GGA-type PBE, semi-empirically dispersion-corrected PBE-D2 and PBE-D3, and the non-local vdW-DF2 functional. Results reported in Table 1 indicate that dispersion interactions are relatively large, ranging from 4 to 15 kJ mol−1. Note also that interaction energies obtained with different dispersion corrected methods for a particular adsorption complex do not agree in some cases (discrepancies as large as 6 kJ mol−1 were found).| Al position | Brønsted site | Interaction energy | |||
|---|---|---|---|---|---|
| PBE | PBE-D2 | PBE-D3 | vdW-DF2 | ||
| T1 | O3 | −28.0 | −36.1 | −34.9 | −31.7 |
| T2 | O10 | −28.1 | −42.1 | −43.8 | −42.3 |
| T3 | O13 | −26.8 | −41.4 | −42.2 | −39.0 |
| T4 | O3 | −28.6 | −36.8 | −35.5 | −32.6 |
| T5 | O8 | −20.7 | −34.2 | −38.9 | −40.5 |
| T6 | O2 | −23.2 | −35.8 | −35.3 | −33.5 |
| T7 | O4 | −3.5 | −13.2 | −14.3 | −18.1 |
| T8 | O10 | −28.6 | −42.6 | −44.4 | −43.4 |
Results reported in Table 1 are truly disappointing in the light of the experimentally determined CO adsorption enthalpy value of ΔH0 = −22.5 kJ mol−1 (see below). Even when the ZPE correction is accounted for (less than 4 kJ mol−1) adsorption enthalpies calculated with dispersion-corrected methods are about 50% overestimated with respect to reliable experimental data. Even the results obtained at the PBE level (not accounting for dispersion interactions) appear to be overestimated with respect to experiment.
To understand the discrepancy between calculated and experimental results, accurate CCSD(T) calculations were carried out for the cluster model that mimics the simultaneous interaction of CO with a Brønsted-acid site and with the zeolite framework at the opposite side of the channel or cavity (Fig. 2). Results obtained at the PBE level for large RO(2T)–Si(1T) indicate that the local interaction of CO with just the Brønsted-acid site is overestimated by 2.8 kJ mol−1, and this overestimation becomes significantly smaller (about 1 kJ mol−1) for RO(2T)–Si(1T) ≈ 8 Å, which is a typical situation for zeolites. In contrast, results obtained at the PBE-D2 level clearly show that the interaction energy is largely overestimated (6.2–6.7 kJ mol−1) for the whole range of RO(2T)–Si(1T) distance investigated. These results show that the PBE functional gives a more accurate description of this system than dispersion-corrected functionals. Although the relatively good performance of PBE should result from fortuitous error cancellations, its use for describing the CO–H-MWW system seems to be justified. Results reported below were all obtained at the PBE level.
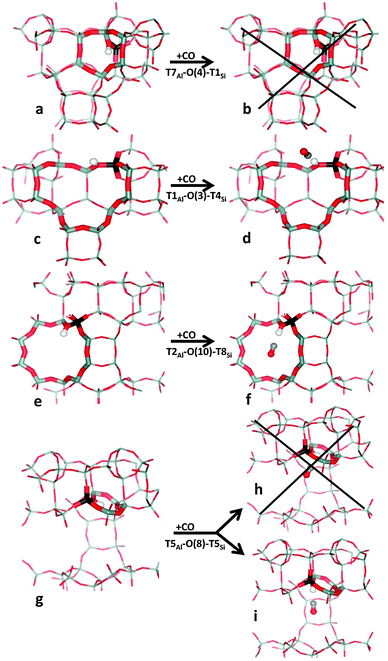
Relevant geometrical parameters describing the Brønsted-acid site (BA site) with and without adsorbed CO, O–H and C–O stretching frequencies, and CO adsorption enthalpy are reported in Table 2 for all eight distinguishable framework Al positions. Only the results obtained for the energetically most stable BA sites in the vicinity of each framework Al are reported in this table; the complete set of results obtained for all non-equivalent BA sites in H-MCM-22 is reported in the ESI† (Table S1). A representative set of BA sites with and without adsorbed CO is depicted in Fig. 3.
| Al position | Brønsted site | ΔE(Al,H)a | Geometrical data | Stretching frequencies | ||||||
|---|---|---|---|---|---|---|---|---|---|---|
| Al–O–Sib | r(OH) | r(OH) + COc | ΔH0 (0 K) | ν(OH) | ν(OH) + COc | Δν(OH) | ν(CO)c | |||
| a Relative energies for framework Si substitution with Al/H with respect to the substitution in the T7 position. b Al–O–Si angle (in deg) for the BA site. c For the CO adsorption complex on the BA site. d BA sites involved in intra-zeolite hydrogen bonding. e Not corrected for ZPE. | ||||||||||
| T1 | O3 | 17 | 128.1 | 0.9755 | 1.0020 | −24.4 | 3629 | 3280 | 349 | 2183 |
| T2 | O10 | 18 | 129.2 | 0.9756 | 0.9994 | −24.5 | 3628 | 3314 | 314 | 2181 |
| T3 | O13 | 21 | 132.4 | 0.9765 | 1.0022 | −23.2 | 3617 | 3278 | 339 | 2179 |
| T4 | O3 | 20 | 129.0 | 0.9759 | 1.0031 | −25.0 | 3624 | 3266 | 358 | 2183 |
| T5d | O8 | 12 | 138.4 | 0.9919 | 0.9994 | −17.1 | 3414 | 3315 | 100 | 2178 |
| T6 | O2 | 13 | 127.7 | 0.9761 | 0.9968 | −19.6 | 3621 | 3349 | 272 | 2177 |
| T7d | O4 | 0 | 128.2 | 0.9919 | 0.9923 | −3.5e | 3413 | 3408 | 5 | 2139 |
| T8 | O10 | 24 | 131.6 | 0.9753 | 0.9985 | −25.0 | 3633 | 3326 | 306 | 2180 |
3.2. Variable-temperature IR spectroscopy and calorimetry
The blank IR spectrum, in the O–H stretching region, of H-MCM-22 (Si![[thin space (1/6-em)]](https://www.rsc.org/images/entities/char_2009.gif) :
:![[thin space (1/6-em)]](https://www.rsc.org/images/entities/char_2009.gif) Al = 24.5
Al = 24.5![[thin space (1/6-em)]](https://www.rsc.org/images/entities/char_2009.gif) :
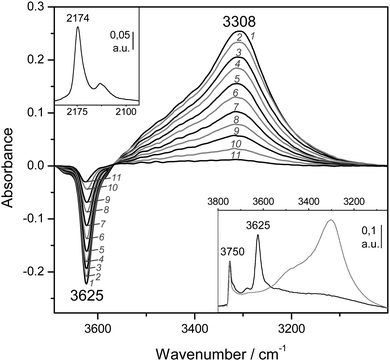
:![[thin space (1/6-em)]](https://www.rsc.org/images/entities/char_2009.gif) 1) is shown in Fig. 4A (inset). The IR absorption band seen at 3750 cm−1 arises from silanols, which are of no concern here, whereas that appearing at 3625 cm−1 is the characteristic O–H stretching band of the zeolite Brønsted acid sites. The main body of Fig. 4A depicts representative VTIR spectra in the difference mode (i.e., after subtracting the blank zeolite spectrum) of adsorbed CO; they were obtained after dosing a fixed amount of carbon monoxide into the IR cell, small enough to avoid saturation (full monolayer coverage) at the lowest temperature. It is clearly seen how interaction of the zeolite with adsorbed CO results in an intensity decrease of the IR absorption band at 3625 cm−1 to an extent that is a function of temperature. Simultaneously, a much broader band corresponding to the hydrogen bonded OH⋯CO species gradually builds up, showing its maximum at about 3305 cm−1. Therefore, the corresponding bathochromic shift, Δν(OH), upon hydrogen bonding amounts to −320 cm−1; measured as the peak-to-peak distance in the difference spectra. From the whole set of VTIR spectra, which covered the temperature range 154–214 K, the corresponding van't Hoff plot of eqn (5) shown in Fig. 5 was obtained. Note that, in this case, the integrated intensity of the 3625 cm−1 band divided by its maximum gives directly the fraction (1 − θ) of free OH sites, from which the corresponding value of θ needed for plotting eqn (5) was obtained. From that linear plot, the value of ΔH0 = −22 kJ mol−1 was derived for the standard enthalpy of H-bond formation (OH⋯CO complexes) in H-MCM-22 (Si
1) is shown in Fig. 4A (inset). The IR absorption band seen at 3750 cm−1 arises from silanols, which are of no concern here, whereas that appearing at 3625 cm−1 is the characteristic O–H stretching band of the zeolite Brønsted acid sites. The main body of Fig. 4A depicts representative VTIR spectra in the difference mode (i.e., after subtracting the blank zeolite spectrum) of adsorbed CO; they were obtained after dosing a fixed amount of carbon monoxide into the IR cell, small enough to avoid saturation (full monolayer coverage) at the lowest temperature. It is clearly seen how interaction of the zeolite with adsorbed CO results in an intensity decrease of the IR absorption band at 3625 cm−1 to an extent that is a function of temperature. Simultaneously, a much broader band corresponding to the hydrogen bonded OH⋯CO species gradually builds up, showing its maximum at about 3305 cm−1. Therefore, the corresponding bathochromic shift, Δν(OH), upon hydrogen bonding amounts to −320 cm−1; measured as the peak-to-peak distance in the difference spectra. From the whole set of VTIR spectra, which covered the temperature range 154–214 K, the corresponding van't Hoff plot of eqn (5) shown in Fig. 5 was obtained. Note that, in this case, the integrated intensity of the 3625 cm−1 band divided by its maximum gives directly the fraction (1 − θ) of free OH sites, from which the corresponding value of θ needed for plotting eqn (5) was obtained. From that linear plot, the value of ΔH0 = −22 kJ mol−1 was derived for the standard enthalpy of H-bond formation (OH⋯CO complexes) in H-MCM-22 (Si![[thin space (1/6-em)]](https://www.rsc.org/images/entities/char_2009.gif) :
:![[thin space (1/6-em)]](https://www.rsc.org/images/entities/char_2009.gif) Al = 24.5
Al = 24.5![[thin space (1/6-em)]](https://www.rsc.org/images/entities/char_2009.gif) :
:![[thin space (1/6-em)]](https://www.rsc.org/images/entities/char_2009.gif) 1). The corresponding value of ΔS0 was found to be −130 J mol−1 K−1. The estimated error limits are ±2 kJ mol−1 for enthalpy and ±10 J mol−1 K−1 for entropy. For comparison, Fig. 4B shows previously reported difference IR spectra of CO adsorbed on H-FER (Si
1). The corresponding value of ΔS0 was found to be −130 J mol−1 K−1. The estimated error limits are ±2 kJ mol−1 for enthalpy and ±10 J mol−1 K−1 for entropy. For comparison, Fig. 4B shows previously reported difference IR spectra of CO adsorbed on H-FER (Si![[thin space (1/6-em)]](https://www.rsc.org/images/entities/char_2009.gif) :
:![[thin space (1/6-em)]](https://www.rsc.org/images/entities/char_2009.gif) Al = 27.5
Al = 27.5![[thin space (1/6-em)]](https://www.rsc.org/images/entities/char_2009.gif) :
:![[thin space (1/6-em)]](https://www.rsc.org/images/entities/char_2009.gif) 1),54 as well as the corresponding van't Hoff plot (inset). For this zeolite, Δν(OH) = −297 cm−1, a bathochromic shift which is smaller than that shown by H-MCM-22 (Δν(OH) = −320 cm−1), and yet the corresponding enthalpy value for H-FER resulted to be ΔH0 = −28.4 kJ mol−1, which is significantly larger (in absolute value) than that of ΔH0 = −22 kJ mol−1 shown by H-MCM-22.
1),54 as well as the corresponding van't Hoff plot (inset). For this zeolite, Δν(OH) = −297 cm−1, a bathochromic shift which is smaller than that shown by H-MCM-22 (Δν(OH) = −320 cm−1), and yet the corresponding enthalpy value for H-FER resulted to be ΔH0 = −28.4 kJ mol−1, which is significantly larger (in absolute value) than that of ΔH0 = −22 kJ mol−1 shown by H-MCM-22.
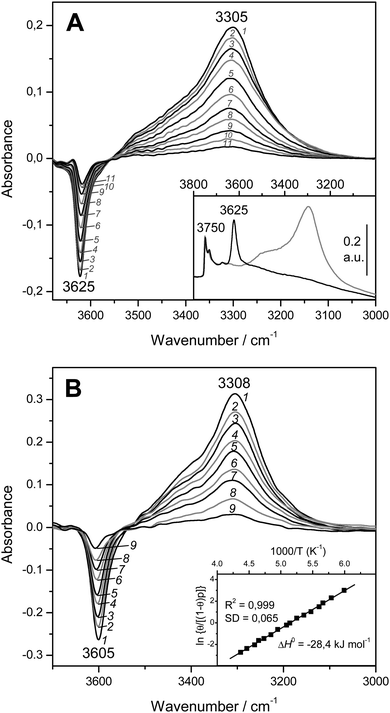 | ||
Fig. 4 (A) Representative variable-temperature IR spectra (O–H stretching region) of CO adsorbed on H-MCM-22 (Si![[thin space (1/6-em)]](https://www.rsc.org/images/entities/char_2009.gif) : :![[thin space (1/6-em)]](https://www.rsc.org/images/entities/char_2009.gif) Al = 24.5 Al = 24.5![[thin space (1/6-em)]](https://www.rsc.org/images/entities/char_2009.gif) : :![[thin space (1/6-em)]](https://www.rsc.org/images/entities/char_2009.gif) 1). The spectra are shown in the difference mode (zeolite blank subtracted). Temperature (in K) and equilibrium pressure (mbar, in brackets) as follows: 1, 154 (6.52); 2, 160 (6.99); 3, 166 (7.37); 4, 172 (7.72); 5, 178 (8.01); 6, 184 (8.29); 7, 190 (8.55); 8, 196 (8.75); 9, 202 (8.93); 10, 208 (9.11); 11, 214 (9.24). The inset shows the blank zeolite spectrum (black) and the effect of dosing with CO at 77 K (grey). (B) Representative variable-temperature IR spectra (O–H stretching region) of CO adsorbed on H-FER (Si 1). The spectra are shown in the difference mode (zeolite blank subtracted). Temperature (in K) and equilibrium pressure (mbar, in brackets) as follows: 1, 154 (6.52); 2, 160 (6.99); 3, 166 (7.37); 4, 172 (7.72); 5, 178 (8.01); 6, 184 (8.29); 7, 190 (8.55); 8, 196 (8.75); 9, 202 (8.93); 10, 208 (9.11); 11, 214 (9.24). The inset shows the blank zeolite spectrum (black) and the effect of dosing with CO at 77 K (grey). (B) Representative variable-temperature IR spectra (O–H stretching region) of CO adsorbed on H-FER (Si![[thin space (1/6-em)]](https://www.rsc.org/images/entities/char_2009.gif) : :![[thin space (1/6-em)]](https://www.rsc.org/images/entities/char_2009.gif) Al = 27.5 Al = 27.5![[thin space (1/6-em)]](https://www.rsc.org/images/entities/char_2009.gif) : :![[thin space (1/6-em)]](https://www.rsc.org/images/entities/char_2009.gif) 1). The spectra are shown in the difference mode (zeolite blank subtracted). From 1 to 9, temperature goes from 167 to 224 K; and the equilibrium pressure from 0.57 to 1.75 mbar. The inset shows the corresponding van't Hoff plot (ref. 52). 1). The spectra are shown in the difference mode (zeolite blank subtracted). From 1 to 9, temperature goes from 167 to 224 K; and the equilibrium pressure from 0.57 to 1.75 mbar. The inset shows the corresponding van't Hoff plot (ref. 52). | ||
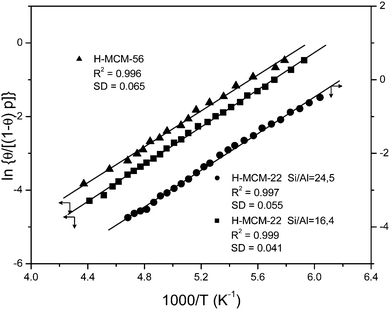 | ||
Fig. 5 Plot of the left-hand side of eqn (5) against the reciprocal of the temperature for CO adsorbed on H-MCM-22 (Si![[thin space (1/6-em)]](https://www.rsc.org/images/entities/char_2009.gif) : :![[thin space (1/6-em)]](https://www.rsc.org/images/entities/char_2009.gif) Al = 24.5 Al = 24.5![[thin space (1/6-em)]](https://www.rsc.org/images/entities/char_2009.gif) : :![[thin space (1/6-em)]](https://www.rsc.org/images/entities/char_2009.gif) 1 and 16.4 1 and 16.4![[thin space (1/6-em)]](https://www.rsc.org/images/entities/char_2009.gif) : :![[thin space (1/6-em)]](https://www.rsc.org/images/entities/char_2009.gif) 1) and H-MCM-56; data obtained from the O–H stretching bands. R, linear regression coefficient; SD, standard deviation. 1) and H-MCM-56; data obtained from the O–H stretching bands. R, linear regression coefficient; SD, standard deviation. | ||
A comment on how band intensity was measured seems pertinent here. Several authors have pointed out that the clearly dissymmetric (and rather broad) O–H stretching band assigned to the Brønsted acid hydroxyl groups of H-MCM-22 (IR absorption band at 3625 cm−1 in Fig. 4A) can be resolved into two or more components.69–72 And in fact, Garrone et al.69 used computer procedures to simulate the band envelope by adding up three bands peaking at 3628, 3618 and 3585 cm−1; the first two having nearly the same intensity, and a much weaker third one. However, our attempts at band resolution did not produce quantitatively reliable results (because of inherent uncertainty about how the band should be subdivided) regarding calculation of CO adsorption enthalpy. Therefore, for the corresponding van't Hoff plot we decided to use the integrated intensity of the hydroxyl band (at 3625 cm−1) as it appears in the VTIR spectra of Fig. 4A. As a matter of fact, the rather regular shape of this band across the whole series of VTIR spectra, together with the fact that the derived van't Hoff plot (Fig. 5) fits to a straight line, strongly suggest that the molar absorption coefficients of the main OH species adding up to the overall band profile should not differ much from each other.
Fig. 6 depicts the C–O stretching region of the same VTIR spectra shown in Fig. 4A. The set of IR absorption bands seen at 2174 cm−1 corresponds to the C–O stretching mode of carbon monoxide involved in OH⋯CO complexes. The weaker and broader band at about 2138 cm−1, which comes (mainly) from weakly physisorbed (liquid-like CO),28,29 is of no concern here. The inset to Fig. 6 shows the van't Hoff plot obtained by applying eqn (6) to the whole set of spectra recorded (band at 2174 cm−1). From this linear plot, the values of ΔH0 = −23(±2) kJ mol−1 and ΔS0 = −140(±10) J mol−1 K−1 were obtained. As expected, these values practically coincide (within experimental error) with those derived from the O–H stretching band of the same OH⋯CO hydrogen-bonded species; and such a close agreement between both sets of results provides further reliability on the methods used. The average of both sets of results gives the final values of ΔH0 = −22.5(±2) kJ mol−1 and ΔS0 = −135(±10) J mol−1 K−1 for the standard enthalpy and entropy of formation of the hydrogen-bonded CO complexes under study.
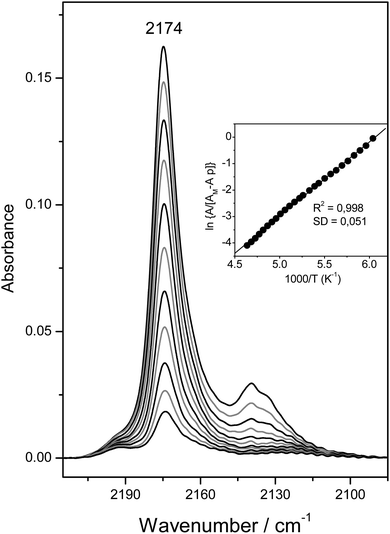 | ||
Fig. 6 Representative IR spectra (C–O stretching region) of CO adsorbed on H-MCM-22 (Si![[thin space (1/6-em)]](https://www.rsc.org/images/entities/char_2009.gif) : :![[thin space (1/6-em)]](https://www.rsc.org/images/entities/char_2009.gif) Al = 24.5 Al = 24.5![[thin space (1/6-em)]](https://www.rsc.org/images/entities/char_2009.gif) : :![[thin space (1/6-em)]](https://www.rsc.org/images/entities/char_2009.gif) 1). From top to bottom, temperature goes from 154 to 214 K; and equilibrium pressure from 6.52 to 9.24 mbar. The inset shows the corresponding plot of the left-hand side of eqn (6) against the reciprocal of the temperature. R, linear regression coefficient; SD, standard deviation. 1). From top to bottom, temperature goes from 154 to 214 K; and equilibrium pressure from 6.52 to 9.24 mbar. The inset shows the corresponding plot of the left-hand side of eqn (6) against the reciprocal of the temperature. R, linear regression coefficient; SD, standard deviation. | ||
As stated in the Introduction, adsorption calorimetry was also used to measure the enthalpy change in hydrogen-bonding of CO with the Brønsted-acid hydroxyl groups of both, H-MCM-22 (Si![[thin space (1/6-em)]](https://www.rsc.org/images/entities/char_2009.gif) :
:![[thin space (1/6-em)]](https://www.rsc.org/images/entities/char_2009.gif) Al = 24.5
Al = 24.5![[thin space (1/6-em)]](https://www.rsc.org/images/entities/char_2009.gif) :
:![[thin space (1/6-em)]](https://www.rsc.org/images/entities/char_2009.gif) 1) and H-FER (Si
1) and H-FER (Si![[thin space (1/6-em)]](https://www.rsc.org/images/entities/char_2009.gif) :
:![[thin space (1/6-em)]](https://www.rsc.org/images/entities/char_2009.gif) Al = 27.5
Al = 27.5![[thin space (1/6-em)]](https://www.rsc.org/images/entities/char_2009.gif) :
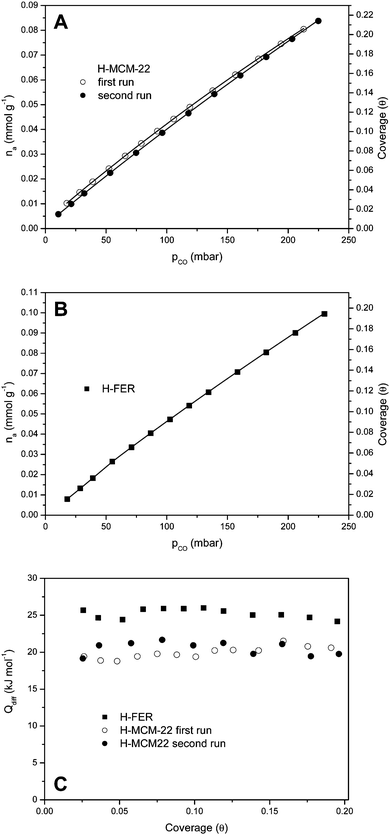
:![[thin space (1/6-em)]](https://www.rsc.org/images/entities/char_2009.gif) 1). CO adsorption isotherms, at 303 K, are shown in Fig. 7A and B, respectively, while Fig. 7C shows the corresponding differential heat of adsorption (in the low coverage range). Note that, in order to test reproducibility, two independent sets of measurements were performed for carbon monoxide adsorption on H-MCM-22. The average of the results thus obtained gives the adsorption heat value of 21(±2) kJ mol−1, which agrees (within experimental error) with the value of ΔH0 = −22.5(±2) kJ mol−1 obtained by VTIR spectroscopy. Regarding H-FER, Fig. 7C shows an adsorption heat of about 26(±2) kJ mol−1, to be compared with the corresponding value of ΔH0 = −28.4(±2) kJ mol−1 previously determined by VTIR spectroscopy.54 It is also noteworthy that (up to the coverage of about 0.2) the CO adsorption heat is (very approximately) independent of coverage for both zeolites.
1). CO adsorption isotherms, at 303 K, are shown in Fig. 7A and B, respectively, while Fig. 7C shows the corresponding differential heat of adsorption (in the low coverage range). Note that, in order to test reproducibility, two independent sets of measurements were performed for carbon monoxide adsorption on H-MCM-22. The average of the results thus obtained gives the adsorption heat value of 21(±2) kJ mol−1, which agrees (within experimental error) with the value of ΔH0 = −22.5(±2) kJ mol−1 obtained by VTIR spectroscopy. Regarding H-FER, Fig. 7C shows an adsorption heat of about 26(±2) kJ mol−1, to be compared with the corresponding value of ΔH0 = −28.4(±2) kJ mol−1 previously determined by VTIR spectroscopy.54 It is also noteworthy that (up to the coverage of about 0.2) the CO adsorption heat is (very approximately) independent of coverage for both zeolites.
Fig. 8 (bottom inset) depicts the IR spectrum in the O–H stretching region of the zeolite H-MCM-22 (Si![[thin space (1/6-em)]](https://www.rsc.org/images/entities/char_2009.gif) :
:![[thin space (1/6-em)]](https://www.rsc.org/images/entities/char_2009.gif) Al = 16.4
Al = 16.4![[thin space (1/6-em)]](https://www.rsc.org/images/entities/char_2009.gif) :
:![[thin space (1/6-em)]](https://www.rsc.org/images/entities/char_2009.gif) 1). The IR absorption bands corresponding to silanols (3750 cm−1) and to Brønsted-acid hydroxyl groups (3625 cm−1) appear at the same wavenumbers as those of the previous H-MCM-22 (Si
1). The IR absorption bands corresponding to silanols (3750 cm−1) and to Brønsted-acid hydroxyl groups (3625 cm−1) appear at the same wavenumbers as those of the previous H-MCM-22 (Si![[thin space (1/6-em)]](https://www.rsc.org/images/entities/char_2009.gif) :
:![[thin space (1/6-em)]](https://www.rsc.org/images/entities/char_2009.gif) Al = 24.5
Al = 24.5![[thin space (1/6-em)]](https://www.rsc.org/images/entities/char_2009.gif) :
:![[thin space (1/6-em)]](https://www.rsc.org/images/entities/char_2009.gif) 1) sample. Representative VTIR spectra of adsorbed CO are shown (in the difference mode) in the main body of Fig. 8, whereas the top inset depicts the characteristic C–O stretching mode of the OH⋯CO hydrogen-bonded adsorption complex. From the whole set of the obtained VTIR spectra, the van't Hoff plot shown in Fig. 5 was derived. This linear plot gave the values ΔH0 = −21(±2) kJ mol−1 and ΔS0 = −128(±10) J mol−1 K−1 for the standard adsorption enthalpy and entropy (respectively) of formation of the hydrogen-bonded OH⋯CO species. Note that the ΔH0 value is slightly smaller than that of −22.5 kJ mol−1 obtained for H-MCM-22 (Si
1) sample. Representative VTIR spectra of adsorbed CO are shown (in the difference mode) in the main body of Fig. 8, whereas the top inset depicts the characteristic C–O stretching mode of the OH⋯CO hydrogen-bonded adsorption complex. From the whole set of the obtained VTIR spectra, the van't Hoff plot shown in Fig. 5 was derived. This linear plot gave the values ΔH0 = −21(±2) kJ mol−1 and ΔS0 = −128(±10) J mol−1 K−1 for the standard adsorption enthalpy and entropy (respectively) of formation of the hydrogen-bonded OH⋯CO species. Note that the ΔH0 value is slightly smaller than that of −22.5 kJ mol−1 obtained for H-MCM-22 (Si![[thin space (1/6-em)]](https://www.rsc.org/images/entities/char_2009.gif) :
:![[thin space (1/6-em)]](https://www.rsc.org/images/entities/char_2009.gif) Al = 24.5
Al = 24.5![[thin space (1/6-em)]](https://www.rsc.org/images/entities/char_2009.gif) :
:![[thin space (1/6-em)]](https://www.rsc.org/images/entities/char_2009.gif) 1), which could be correlated with the slightly smaller value of Δν(OH): −317 cm−1 for H-MCM-22 (Si
1), which could be correlated with the slightly smaller value of Δν(OH): −317 cm−1 for H-MCM-22 (Si![[thin space (1/6-em)]](https://www.rsc.org/images/entities/char_2009.gif) :
:![[thin space (1/6-em)]](https://www.rsc.org/images/entities/char_2009.gif) Al = 16.4
Al = 16.4![[thin space (1/6-em)]](https://www.rsc.org/images/entities/char_2009.gif) :
:![[thin space (1/6-em)]](https://www.rsc.org/images/entities/char_2009.gif) 1) and −320 cm−1 for H-MCM-22 (Si
1) and −320 cm−1 for H-MCM-22 (Si![[thin space (1/6-em)]](https://www.rsc.org/images/entities/char_2009.gif) :
:![[thin space (1/6-em)]](https://www.rsc.org/images/entities/char_2009.gif) Al = 24.5
Al = 24.5![[thin space (1/6-em)]](https://www.rsc.org/images/entities/char_2009.gif) :
:![[thin space (1/6-em)]](https://www.rsc.org/images/entities/char_2009.gif) 1). Although it is true that such a small difference in wavenumber can hardly be assessed experimentally, particularly when dealing with IR absorption bands as broad as those shown by the hydrogen-bonded adsorption complexes.
1). Although it is true that such a small difference in wavenumber can hardly be assessed experimentally, particularly when dealing with IR absorption bands as broad as those shown by the hydrogen-bonded adsorption complexes.
The IR spectra corresponding to the zeolite H-MCM-56 (Si![[thin space (1/6-em)]](https://www.rsc.org/images/entities/char_2009.gif) :
:![[thin space (1/6-em)]](https://www.rsc.org/images/entities/char_2009.gif) Al = 16
Al = 16![[thin space (1/6-em)]](https://www.rsc.org/images/entities/char_2009.gif) :
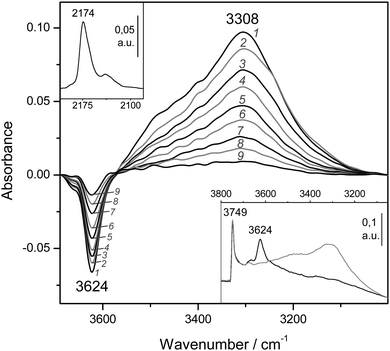
:![[thin space (1/6-em)]](https://www.rsc.org/images/entities/char_2009.gif) 1) are depicted in Fig. 9. The blank spectrum of the zeolite wafer shows the characteristic silanol and Brønsted-acid hydroxyl group bands at 3749 and 3624 cm−1, respectively (very close to the corresponding values of H-MCM-22). The bathochromic shift of the latter band upon CO adsorption is Δν(OH) = −316 cm−1, as seen in the main body of Fig. 9. From the whole series of VTIR spectra of adsorbed CO (some of which are shown in Fig. 9), the corresponding van't Hoff plot (shown in Fig. 5) was obtained, which gave the values of ΔH0 = −20(±2) kJ mol−1 and ΔS0 = −120(±10) J mol−1 K−1 for the formation of hydrogen-bonded OH⋯CO species in H-MCM-56.
1) are depicted in Fig. 9. The blank spectrum of the zeolite wafer shows the characteristic silanol and Brønsted-acid hydroxyl group bands at 3749 and 3624 cm−1, respectively (very close to the corresponding values of H-MCM-22). The bathochromic shift of the latter band upon CO adsorption is Δν(OH) = −316 cm−1, as seen in the main body of Fig. 9. From the whole series of VTIR spectra of adsorbed CO (some of which are shown in Fig. 9), the corresponding van't Hoff plot (shown in Fig. 5) was obtained, which gave the values of ΔH0 = −20(±2) kJ mol−1 and ΔS0 = −120(±10) J mol−1 K−1 for the formation of hydrogen-bonded OH⋯CO species in H-MCM-56.
VTIR spectra of adsorbed dinitrogen, which can also be used for testing Brønsted acidity of protonic zeolites, will now be considered. As examples, we show series of such spectra in Fig. 10 (for H-MCM-22 having a Si![[thin space (1/6-em)]](https://www.rsc.org/images/entities/char_2009.gif) :
:![[thin space (1/6-em)]](https://www.rsc.org/images/entities/char_2009.gif) Al ratio of 16.4
Al ratio of 16.4![[thin space (1/6-em)]](https://www.rsc.org/images/entities/char_2009.gif) :
:![[thin space (1/6-em)]](https://www.rsc.org/images/entities/char_2009.gif) 1) and in Fig. 12 (H-MCM-56, Si
1) and in Fig. 12 (H-MCM-56, Si![[thin space (1/6-em)]](https://www.rsc.org/images/entities/char_2009.gif) :
:![[thin space (1/6-em)]](https://www.rsc.org/images/entities/char_2009.gif) Al = 16
Al = 16![[thin space (1/6-em)]](https://www.rsc.org/images/entities/char_2009.gif) :
:![[thin space (1/6-em)]](https://www.rsc.org/images/entities/char_2009.gif) 1). Corresponding VTIR spectra of dinitrogen adsorbed on H-MCM-22 (Si
1). Corresponding VTIR spectra of dinitrogen adsorbed on H-MCM-22 (Si![[thin space (1/6-em)]](https://www.rsc.org/images/entities/char_2009.gif) :
:![[thin space (1/6-em)]](https://www.rsc.org/images/entities/char_2009.gif) Al = 24.5
Al = 24.5![[thin space (1/6-em)]](https://www.rsc.org/images/entities/char_2009.gif) :
:![[thin space (1/6-em)]](https://www.rsc.org/images/entities/char_2009.gif) 1) and H-FER (Si
1) and H-FER (Si![[thin space (1/6-em)]](https://www.rsc.org/images/entities/char_2009.gif) :
:![[thin space (1/6-em)]](https://www.rsc.org/images/entities/char_2009.gif) Al = 27.5
Al = 27.5![[thin space (1/6-em)]](https://www.rsc.org/images/entities/char_2009.gif) :
:![[thin space (1/6-em)]](https://www.rsc.org/images/entities/char_2009.gif) 1) were recently reported by Delgado et al.,44 and by Nachtigall et al.,54 respectively.
1) were recently reported by Delgado et al.,44 and by Nachtigall et al.,54 respectively.
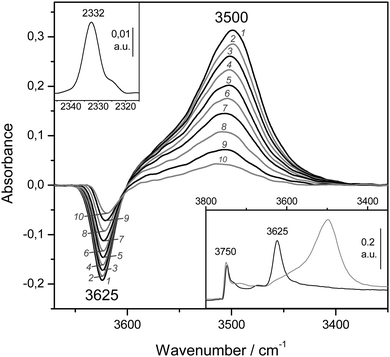
The bottom inset in Fig. 10 shows the effect of dosing with nitrogen, at 77 K, the H-MCM-22 zeolite wafer. Formation of OH⋯NN hydrogen bonded species results in a bathochromic shift of the IR absorption band of Brønsted-acid hydroxyl groups from 3625 down to 3500 cm−1, that is, Δν(OH) = −125 cm−1. It should be noted, however, that the exact magnitude of Δν(OH) depends slightly on the temperature at which the IR spectrum is recorded (as can be seen in the main body of Fig. 10). Formation of the OH⋯NN adducts results in activation in the IR of the N–N stretching mode, which appears at 2332 cm−1 (top inset in Fig. 10). From the whole series of VTIR spectra that were run, some of which are shown in the main body of Fig. 10, the plot of the left-hand side of eqn (5) against the reciprocal of the temperature depicted in Fig. 11 was obtained. From this linear plot the value of ΔH0 = −13.5(±2) kJ mol−1 was derived for the standard enthalpy of formation of the hydrogen-bonded OH⋯NN species. The corresponding entropy change resulted to be ΔS0 = −103(±10) J mol−1 K−1.
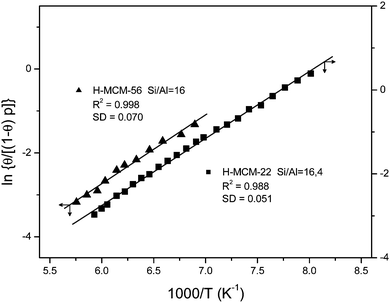 | ||
Fig. 11 Plot of the left-hand side of eqn (5) against the reciprocal of the temperature for N2 adsorbed on H-MCM-22 (Si![[thin space (1/6-em)]](https://www.rsc.org/images/entities/char_2009.gif) : :![[thin space (1/6-em)]](https://www.rsc.org/images/entities/char_2009.gif) Al = 16.4 Al = 16.4![[thin space (1/6-em)]](https://www.rsc.org/images/entities/char_2009.gif) : :![[thin space (1/6-em)]](https://www.rsc.org/images/entities/char_2009.gif) 1) and H-MCM-56; data obtained from the corresponding O–H stretching bands. R, linear regression coefficient; SD, standard deviation. 1) and H-MCM-56; data obtained from the corresponding O–H stretching bands. R, linear regression coefficient; SD, standard deviation. | ||
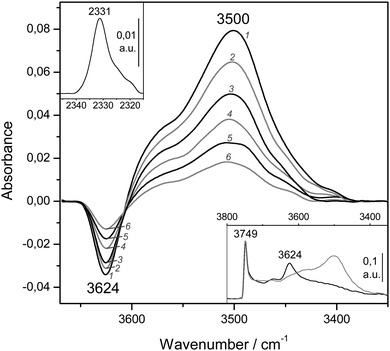
Finally, representative VTIR spectra of dinitrogen adsorbed on H-MCM-56 are shown in Fig. 12. The IR absorption band at 3624 cm−1 (Brønsted-acid OH groups) is shifted down to 3500 cm−1 upon formation of the hydrogen-bonded species, which results in Δν(OH) = −124 cm−1 (bottom inset). From the integral values of absorbance, taken from the band at 3624 cm−1 in the whole series of VTIR spectra, the van't Hoff plot depicted in Fig. 11 was obtained. The corresponding values of ΔH0 and ΔS0 (for the formation of the hydrogen-bonded species) resulted to be −13(±2) kJ mol−1 and −104(±10) J mol−1 K−1, respectively.
4. Discussion
Regarding computational results for the CO–H-MCM-22 system, O–H stretching frequencies calculated with the ω/r correlation method are in very good agreement with experimental IR spectra for both, the bare Brønsted-acid sites and those involved in adsorption complexes with CO. Calculated C–O stretching frequencies (using the ω/r correlation method) are about 5 cm−1 overestimated with respect to experimentally observed band maxima. This small overestimation of νCO is likely connected with overestimated CO interaction energy with Brønsted-acid sites. Adsorption enthalpies calculated at the PBE level are only slightly overestimated with respect to experimental data. However, this seemingly good performance of the PBE functional should not be overrated, it only results from fortuitous cancellation of errors. Interaction energies reported herein should be taken rather qualitatively than quantitatively. Calculations show three effects on the interaction energy between CO and Brønsted-acid OH groups: (i) stronger interaction is found for adsorption complexes where the CO molecule is situated along the O–H bond direction; any deviation from this direction results in a weaker interaction and also a smaller νCO value. (ii) Stronger interaction is found for Brønsted-acid sites not involved in the intra-zeolite H-bonding prior to the CO adsorption; when the Brønsted-acid OH group is involved in such an H-bond the CO adsorption enthalpy should be lower, since the hydrogen atom must move to a position from where it can efficiently interact with the adsorbate. (iii) Accessibility of the Brønsted-acid site also plays a role; in the case of Al in the T7 position, no adsorption complex with CO can be formed.For quantitative analysis of the CO adsorption enthalpy a more reliable level of theory would be required. It should be noted that the dispersion corrected functionals tested herein all failed to describe reliably the interaction of CO with Brønsted-acid sites in H-MCM-22. Careful analysis of DFT results obtained for cluster models showed that the problem of dispersion-corrected exchange–correlation functionals stems not so much from the description of dispersion interactions themselves as from just the local (or semi-local) part of the exchange–correlation functional. Results reported in Fig. 2 show that the PBE functional already overestimates the interaction of CO with the Brønsted acid site, mostly due to a too large electrostatic stabilization. It is then not surprising that dispersion-corrected functionals give even a larger discrepancy with respect to the CCSD(T)/CBS level, since the dispersion contribution further stabilizes the adsorption complex. Hence, the problem of the PBE functional cannot be fixed by adding the dispersion interaction (DFT-D2 or DFT-D3). In contrast, the DFT/CC method, which is based on the correction of DFT errors of any kind (and not just dispersion) was used successfully for the description of similar systems, e.g., CO2 adsorption in zeolites and MOFs;73–75 and it could possibly be used even for the system dealt with herein. The development of DFT/CC correction functions for the interaction of CO with Brønsted-acid sites in zeolites, which is currently under progress, will be hopefully reported in a future article, together with an in-depth analysis of DFT failure to describe such an interaction.
The substitution energy, ΔE(Al,H), calculated with the periodic model (Table 2) can be compared with corresponding values obtained by Li et al.66 using cluster models. The only agreement between the two models is that the most stable position for framework Al is the T7 site. The relative energies for different positions of framework Al obtained with the periodic model are qualitatively different from those obtained with cluster models. In addition, the relative stability of Brønsted-acid sites in the vicinity of a particular framework Al site is also qualitatively different when using periodic and cluster models. That led us to conclude that the use of cluster models for the description of Brønsted-acid sites in zeolites is questionable.
To facilitate discussion of the experimental results, Table 3 summarizes the relevant numerical data reported herein for MWW type zeolites, as well as corresponding data previously reported for other protonic zeolites.34,49,54 In all cases, ΔH0 values were determined by VTIR spectroscopy. Δν(OH) values were all measured as peak-to-peak distance in the corresponding difference IR spectra for CO (or N2) doses approaching a coverage of θ = 1. Much larger doses of the adsorbate should be avoided, particularly for carbon monoxide, because at a low temperature that would result in massive formation of a condensed phase and corresponding perturbation of hydroxyl groups and gas adsorption complexes, which can lead to inconsistent Δν(OH) values. Besides data reported in Table 3, Δν(OH) values for some of the same zeolites (but not corresponding ΔH0 values) were also reported by several authors. Among them, Dwyer et al.36 give the values of Δν(OH)(CO) = −308 cm−1 for CO adsorbed (at θ → 1) in H-ZSM-5, and Δν(OH)(CO) = −273 cm−1 for H-Y; Knözinger et al.27 give, for H-ZSM-5, Δν(OH)(CO) = −317 cm−1 and Δν(OH)(N2) = −121 cm−1; Hadjiivanov et al.76 give, for H-FER, Δν(OH)(CO) = −292 cm−1 and Δν(OH)(N2) = −106 cm−1; and Gil et al.77 give Δν(OH)(CO) = −326 cm −1 for carbon monoxide adsorbed (at 173 K) on H-MCM-22. Although some small differences are observed, these values are consistent with those reported in Table 3.
| Zeolite | Structure type | Si/Al ratio | ν OH (cm−1) | −Δν(OH)(CO)a (cm−1) | −ΔH0(CO)b (kJ mol−1) | −Δν(OH)(N2)c (cm−1) | −ΔH0(N2)d (kJ mol−1) | Ref. |
|---|---|---|---|---|---|---|---|---|
| a Red-shift of the Brønsted-acid OH group upon hydrogen bonding with CO. b Standard enthalpy change in the formation of the OH⋯CO complex. c Red-shift of the Brønsted-acid OH group upon hydrogen bonding with N2. d Standard enthalpy change in the formation of the OH⋯N2 complex. | ||||||||
| H-Y | FAU | 5.6 | 3645 | 275 | 25.6 | 98 | 15.7 | 34 and 49 |
| H-ZSM-5 | MFI | 30 | 3618 | 303 | 29.4 | 116 | 19.7 | 34 |
| H-FER | FER | 27.5 | 3605 | 297 | 28.4 | 110 | 19.1 | 54 |
| H-MCM-22 | MWW | 24.5 | 3625 | 320 | 22.5 | 125 | 14.5 | This work |
| H-MCM-22 | MWW | 16.4 | 3625 | 317 | 21 | 125 | 13.5 | This work |
| H-MCM-56 | MWW | 16 | 3624 | 316 | 20 | 124 | 13 | This work |
Table 3 shows that the protonic zeolites H-Y, H-ZSM-5 and H-FER display the expected correlation between Δν(OH) and ΔH0 for both CO and N2; that is, increasing (absolute) values of Δν(OH) correspond to increasing (absolute) values of ΔH0. However, MWW type zeolites clearly break that trend; they all show a distinctively smaller value of ΔH0 than (for instance) H-FER and H-ZSM-5, and yet a larger value of Δν(OH). Regarding H-MCM-22 (Si![[thin space (1/6-em)]](https://www.rsc.org/images/entities/char_2009.gif) :
:![[thin space (1/6-em)]](https://www.rsc.org/images/entities/char_2009.gif) Al = 24.5
Al = 24.5![[thin space (1/6-em)]](https://www.rsc.org/images/entities/char_2009.gif) :
:![[thin space (1/6-em)]](https://www.rsc.org/images/entities/char_2009.gif) 1), the smaller ΔH0 value, as compared to H-FER, for the formation of hydrogen-bonded OH⋯CO complexes with the zeolite Brønsted-acid sites was also confirmed by the calorimetric results reported in Section 3.2. Moreover, Li et al.78 and Tsai et al.79 found, by means of temperature programmed desorption of adsorbed ammonia, that (for nearly the same Si
1), the smaller ΔH0 value, as compared to H-FER, for the formation of hydrogen-bonded OH⋯CO complexes with the zeolite Brønsted-acid sites was also confirmed by the calorimetric results reported in Section 3.2. Moreover, Li et al.78 and Tsai et al.79 found, by means of temperature programmed desorption of adsorbed ammonia, that (for nearly the same Si![[thin space (1/6-em)]](https://www.rsc.org/images/entities/char_2009.gif) :
:![[thin space (1/6-em)]](https://www.rsc.org/images/entities/char_2009.gif) Al ratio) H-MCM-22 has a weaker Brønsted acidity than H-ZSM-5. This is in agreement with the correspondingly smaller values of ΔH0(CO) and ΔH0(N2) shown by H-MCM-22 (Table 3), but not so with its distinctively larger values of Δν(OH)(CO) and Δν(OH)(N2) when compared to H-ZSM-5. It should be clear, therefore, that the rather common practice of ranking Brønsted-acid strength of protonic zeolites according to the corresponding O–H frequency shift probed by an adsorbed weak base can be misleading, particularly when dealing with zeolites not having the same structure type. Nevertheless, within the same structural group Δν(OH) seems to correlate with ΔH0, as shown by H-MCM-22 and H-MCM-56; both of them belonging to the same (MWW) structural group. Note also that within this group of zeolites the Brønsted acid strength, as tested by the corresponding ΔH0(CO) or ΔH0(N2) value, slightly decreases with decreasing Si
Al ratio) H-MCM-22 has a weaker Brønsted acidity than H-ZSM-5. This is in agreement with the correspondingly smaller values of ΔH0(CO) and ΔH0(N2) shown by H-MCM-22 (Table 3), but not so with its distinctively larger values of Δν(OH)(CO) and Δν(OH)(N2) when compared to H-ZSM-5. It should be clear, therefore, that the rather common practice of ranking Brønsted-acid strength of protonic zeolites according to the corresponding O–H frequency shift probed by an adsorbed weak base can be misleading, particularly when dealing with zeolites not having the same structure type. Nevertheless, within the same structural group Δν(OH) seems to correlate with ΔH0, as shown by H-MCM-22 and H-MCM-56; both of them belonging to the same (MWW) structural group. Note also that within this group of zeolites the Brønsted acid strength, as tested by the corresponding ΔH0(CO) or ΔH0(N2) value, slightly decreases with decreasing Si![[thin space (1/6-em)]](https://www.rsc.org/images/entities/char_2009.gif) :
:![[thin space (1/6-em)]](https://www.rsc.org/images/entities/char_2009.gif) Al ratio along the series H-MCM-22 (Si
Al ratio along the series H-MCM-22 (Si![[thin space (1/6-em)]](https://www.rsc.org/images/entities/char_2009.gif) :
:![[thin space (1/6-em)]](https://www.rsc.org/images/entities/char_2009.gif) Al = 24.5
Al = 24.5![[thin space (1/6-em)]](https://www.rsc.org/images/entities/char_2009.gif) :
:![[thin space (1/6-em)]](https://www.rsc.org/images/entities/char_2009.gif) 1), H-MCM-22 (Si
1), H-MCM-22 (Si![[thin space (1/6-em)]](https://www.rsc.org/images/entities/char_2009.gif) :
:![[thin space (1/6-em)]](https://www.rsc.org/images/entities/char_2009.gif) Al = 16.4
Al = 16.4![[thin space (1/6-em)]](https://www.rsc.org/images/entities/char_2009.gif) :
:![[thin space (1/6-em)]](https://www.rsc.org/images/entities/char_2009.gif) 1), H-MCM-56 (Si
1), H-MCM-56 (Si![[thin space (1/6-em)]](https://www.rsc.org/images/entities/char_2009.gif) :
:![[thin space (1/6-em)]](https://www.rsc.org/images/entities/char_2009.gif) Al = 16
Al = 16![[thin space (1/6-em)]](https://www.rsc.org/images/entities/char_2009.gif) :
:![[thin space (1/6-em)]](https://www.rsc.org/images/entities/char_2009.gif) 1), as could in principle be expected.
1), as could in principle be expected.
5. Conclusions
The standard enthalpy change, ΔH0, involved in hydrogen-bonding of Brønsted-acid OH groups of H-MCM-22 and H-MCM-56 zeolites with the probe molecules CO and N2 was determined by variable-temperature IR spectroscopy, and further checked by adsorption calorimetry. For H-MCM-22 (Si![[thin space (1/6-em)]](https://www.rsc.org/images/entities/char_2009.gif) :
:![[thin space (1/6-em)]](https://www.rsc.org/images/entities/char_2009.gif) Al = 24.5
Al = 24.5![[thin space (1/6-em)]](https://www.rsc.org/images/entities/char_2009.gif) :
:![[thin space (1/6-em)]](https://www.rsc.org/images/entities/char_2009.gif) 1) the obtained values of ΔH0 resulted to be −22.5(±2) and −14.5(±2) kJ mol−1 for the formation of hydrogen-bonded OH⋯CO and OH⋯NN complexes, respectively; corresponding values for H-MCM-56 were −20(±2) kJ mol−1 [ΔH0(CO)] and −13(±2) kJ mol−1 [ΔH0(N2)]. Taking the ΔH0 value as a reliable measure of (relative) Brønsted-acid strength, comparison with the corresponding values for the protonic zeolites H-FER (ΔH0(CO) = −28.4(±2) kJ mol−1, ΔH0(N2) = −19.1(±2) kJ mol−1) and H-ZSM-5 (−29.4(±2) and −19.7(±2) kJ mol−1 for CO and N2, respectively) clearly shows that the MWW structure type zeolites have a distinctively weaker acidity than H-ZSM-5 and H-FER. Nevertheless, the respective value of Δν(OH), after hydrogen-bonding with the probe molecule, was found to be significantly larger for H-MCM-22 (Δν(OH)(CO) = −320 cm−1, Δν(OH)(N2) = −125 cm−1) than for H-FER (Δν(OH)(CO) = −297 cm−1, Δν(OH)(N2) = −110 cm−1) and H-ZSM-5 (Δν(OH)(CO) = −303 cm−1, Δν(OH)(N2) = −116 cm−1), and the same applies to H-MCM-56. These results clearly show that the usual practice of ranking acid strength of protonic zeolites by the corresponding O–H frequency shift probed by a weak base adsorbed at a low temperature can be misleading. Determination of the enthalpy change involved in hydrogen bonding was shown to be a more reliable instrumental method. For that, VTIR spectroscopy is a very convenient technique to be used, since it gives simultaneously ΔH0 and Δν(OH) values. Alternatively, adsorption calorimetry (at a low temperature) could equally well be used to determine the relevant ΔH0 value.
1) the obtained values of ΔH0 resulted to be −22.5(±2) and −14.5(±2) kJ mol−1 for the formation of hydrogen-bonded OH⋯CO and OH⋯NN complexes, respectively; corresponding values for H-MCM-56 were −20(±2) kJ mol−1 [ΔH0(CO)] and −13(±2) kJ mol−1 [ΔH0(N2)]. Taking the ΔH0 value as a reliable measure of (relative) Brønsted-acid strength, comparison with the corresponding values for the protonic zeolites H-FER (ΔH0(CO) = −28.4(±2) kJ mol−1, ΔH0(N2) = −19.1(±2) kJ mol−1) and H-ZSM-5 (−29.4(±2) and −19.7(±2) kJ mol−1 for CO and N2, respectively) clearly shows that the MWW structure type zeolites have a distinctively weaker acidity than H-ZSM-5 and H-FER. Nevertheless, the respective value of Δν(OH), after hydrogen-bonding with the probe molecule, was found to be significantly larger for H-MCM-22 (Δν(OH)(CO) = −320 cm−1, Δν(OH)(N2) = −125 cm−1) than for H-FER (Δν(OH)(CO) = −297 cm−1, Δν(OH)(N2) = −110 cm−1) and H-ZSM-5 (Δν(OH)(CO) = −303 cm−1, Δν(OH)(N2) = −116 cm−1), and the same applies to H-MCM-56. These results clearly show that the usual practice of ranking acid strength of protonic zeolites by the corresponding O–H frequency shift probed by a weak base adsorbed at a low temperature can be misleading. Determination of the enthalpy change involved in hydrogen bonding was shown to be a more reliable instrumental method. For that, VTIR spectroscopy is a very convenient technique to be used, since it gives simultaneously ΔH0 and Δν(OH) values. Alternatively, adsorption calorimetry (at a low temperature) could equally well be used to determine the relevant ΔH0 value.
Attempts to calculate the interaction energy between H-MCM-22 and adsorbed CO by DFT calculations did not lead to quantitatively accurate results. Accurate calculations at the coupled cluster level of theory performed for cluster models show that dispersion-corrected DFT methods overestimate the interaction energy by about 50%. In contrast, the standard GGA functional (PBE) gives interaction energies in significantly better agreement with the coupled cluster method (for the cluster model) and with experiment (periodic model). The relatively good performance of the PBE functional is however due to fortuitous error cancellation. O–H and C–O stretching vibrations can be accurately described with the DFT method, only due to the fact that the ω/r correlation scheme used here corrects the DFT results to the coupled cluster accuracy. A highly accurate description of CO adsorption on Brønsted-acid sites remains a challenge for computational chemistry.
Acknowledgements
Financial support from the Czech Science Foundation under the project P106/12/G015 is highly acknowledged. Calculations were partially performed at MetaCentrum and CERIT-SC computational facilities (MSM/LM2010005 and OP VaVpI CZ. 1.05/3.2.00/08.0144).References
- S. M. Csicsery, Pure Appl. Chem., 1986, 58, 841 CrossRef CAS.
- W. Hölderich, M. Hesse and F. Näumann, Angew. Chem., Int. Ed., 1988, 27, 226 CrossRef.
- D. Gubisch and F. Bandermann, Chem. Eng. Technol., 1989, 12, 155 CrossRef CAS.
- A. Corma, Chem. Rev., 1995, 95, 559 CrossRef CAS.
- K. Tanabe and W. Hölderich, Appl. Catal., A, 1999, 181, 399 CrossRef CAS.
- M. G. Clerici, Top. Catal., 2000, 13, 373 CrossRef CAS.
- A. Raiche, Y. Traa, F. Funder, M. Rupp and J. Weitkamp, Angew. Chem., Int. Ed., 2001, 40, 1243 CrossRef.
- B. Xu, C. Sievers, S. B. Hong, R. Prins and J. A. van Bokhoven, J. Catal., 2006, 244, 163 CrossRef CAS PubMed.
- D. P. Serrano, R. A. Garcia, G. Vicente, M. Linares, D. Prochazkova and J. Cejka, J. Catal., 2011, 279, 366 CrossRef CAS PubMed.
- J. Li, Y. Wei, G. Liu, Y. Qi, P. Tian, B. Li, Y. He and Z. Liu, Catal. Today, 2001, 171, 221 CrossRef PubMed.
- J. Cejka, G. Centi, J. Perez-Pariente and W. J. Roth, Catal. Today, 2012, 179, 2 CrossRef CAS PubMed.
- M. Niwa, K. Suzuki, N. Morishita, G. Sastre, K. Okumura and N. Katada, Catal. Sci. Technol., 2013, 3, 1919 CAS.
- D. Atkinson and G. Curthoys, Chem. Soc. Rev., 1979, 8, 475 RSC.
- H. A. Benesi, J. Phys. Chem., 1957, 61, 970 CrossRef CAS.
- X. Rozanska and R. A. van Santen, in Handbook of Zeolite Science and Technology, ed. S. M. Auerback, K. A. Karrado and P. K. Dutta, Marcel Dekker, Inc., New York, 2003, ch. 15 Search PubMed.
- D. Farcasiu, Catal. Lett., 2001, 71, 95 CrossRef CAS.
- W. E. Farneth and R. J. Gorte, Chem. Rev., 1995, 95, 615 CrossRef CAS.
- H. G. Karge, Stud. Surf. Sci. Catal., 1991, 65, 133 CrossRef CAS.
- N. Cardona-Martinez and J. A. Dumesic, Adv. Catal., 1992, 38, 149 CAS.
- D. J. Parrillo and R. G. Gorte, J. Phys. Chem., 1993, 97, 8786 CrossRef CAS.
- A. Auroux and J. Vedrine, Stud. Surf. Sci. Catal., 1985, 20, 311 CrossRef CAS.
- C. Busco, A. Barbaglia, M. Broyer, V. Bolis, G. M. Foddanu and P. Ugliengo, Thermochim. Acta, 2004, 418, 3 CrossRef CAS PubMed.
- R. Ramos Pinto, P. Borges, M. A. N. D. A. Lemos, F. Lemos, J. C. Vedrine, E. G. Derouane and F. Ramoa Ribeiro, Appl. Catal., A, 2005, 284, 39 CrossRef PubMed.
- M. Hunger, D. Freude, D. Fenzke and H. Pfeifer, Chem. Phys. Lett., 1992, 191, 391 CrossRef CAS.
- J. Klinowski, Chem. Rev., 1991, 91, 1459 CrossRef CAS.
- A. L. Blumenfeld and J. J. Fripiat, J. Phys. Chem. B, 1997, 101, 6670 CrossRef CAS.
- S. Kotrel, J. H. L. Lunsford and H. Knözinger, J. Phys. Chem. B, 2001, 105, 3917 CrossRef CAS.
- A. Zecchina, G. Spoto and S. Bordiga, Phys. Chem. Chem. Phys., 2005, 7, 1627 RSC.
- A. Zecchina and C. Otero Arean, Chem. Soc. Rev., 1996, 25, 187 RSC.
- K. Hadjiivanov and G. Vayssilov, Adv. Catal., 2002, 47, 307 CAS.
- N. S. Nesterenko, F. Thibault-Starzyk, V. Montouillout, V. V. Yushchenko, C. Fernandez, J. P. Gilson, F. Fajula and I. I. Ivanova, Kinet. Catal., 2006, 47, 40 CrossRef CAS.
- J. A. Boscoboinik, X. Yu, E. Emmez, B. Yang, S. Shaikhutdinov, F. D. Fischer, J. Sauer and H. J. Freund, J. Phys. Chem. C, 2013, 117, 13547 CAS.
- F. Geobaldo, C. Lamberti, G. Ricchiardi, S. Bordiga, A. Zecchina, G. T. Palomino and C. O. Arean, J. Phys. Chem., 1995, 99, 11167 CrossRef CAS.
- C. O. Arean, J. Mol. Struct., 2008, 880, 31 CrossRef PubMed.
- E. A. Paukshtis and E. N. Yurchenko, Russ. Chem. Rev., 1983, 52, 242 CrossRef PubMed.
- M. A. Makarova, K. M. Al-Ghefaili and J. Dwyer, J. Chem. Soc., Faraday Trans., 1994, 90, 383 RSC.
- M. V. Frash, M. A. Makarova and A. M. Rigby, J. Phys. Chem. B, 1997, 101, 2116 CrossRef CAS.
- A. G. Pelmenshchikov, E. A. Paukshtis, V. G. Stepanov, V. I. Pavlov, E. N. Yurchenko, K. G. Ione, G. M. Zhidomirov and S. Beran, J. Phys. Chem., 1989, 93, 6725 CrossRef CAS.
- K. P. Schröder, J. Sauer, M. Leslie, C. R. A. Catlow and J. M. Thomas, Chem. Phys. Lett., 1992, 188, 320 CrossRef.
- L. A. M. M. Barbosa, R. A. van Santen and H. Hafner, J. Am. Chem. Soc., 2001, 123, 4530 CrossRef CAS PubMed.
- L. Yang, K. Trafford, O. Kresnawahjuesa, J. Sepa and R. J. Gorte, J. Phys. Chem. B, 2001, 105, 1935 CrossRef CAS.
- K. Chakarova and K. Hadjiivanov, Chem. Commun., 2011, 47, 1878 RSC.
- K. Chakarova and K. Hadjiivanov, J. Phys. Chem. C, 2011, 115, 4806 CAS.
- M. R. Delgado, R. Bulánek, P. Chlubná and C. O. Arean, Catal. Today, 2013 DOI:10.1016/j.cattod.2013.09.013.
- W. J. Roth, Stud. Surf. Sci. Catal., 2005, 158, 19 CrossRef.
- W. J. Roth, P. Chlubna, M. Kubu and D. Vitvarova, Catal. Today, 2013, 204, 8 CrossRef CAS PubMed.
- R. Bulanek, M. Kolarova, P. Chlubna and J. Cejka, Adsorption, 2013, 19, 455 CrossRef CAS.
- A. A. Tsyganenko, P. Yu. Storozhev and C. Otero Arean, Kinet. Catal., 2004, 45, 530 CrossRef CAS.
- C. O. Arean, O. V. Manoilova, A. A. Tsyganenko, G. T. Palomino, M. P. Mentruit, F. Geobaldo and E. Garrone, Eur. J. Inorg. Chem., 2001, 1739 CAS.
- C. Otero Arean, O. V. Manoilova, G. Turnes Palomino, M. Rodriguez Delgado, A. A. Tsyganenko, B. Bonelli and E. Garrone, Phys. Chem. Chem. Phys., 2002, 4, 5713 RSC.
- E. Garrone and C. Otero Arean, Chem. Soc. Rev., 2005, 34, 846 RSC.
- P. Nachtigall, M. R. Delgado, D. Nachtigallova and C. O. Arean, Phys. Chem. Chem. Phys., 2012, 14, 1552 RSC.
- C. O. Arean, M. R. Delgado, C. Lopez Bauca, L. Vrbka and P. Nachtigall, Phys. Chem. Chem. Phys., 2007, 9, 4657 RSC.
- P. Nachtigall, O. Bludsky, L. Grajciar, D. Nachtigallova, M. R. Delgado and C. O. Arean, Phys. Chem. Chem. Phys., 2009, 11, 791 RSC.
- http://www.iza-structure.org/databases/ .
- G. Kresse and J. Hafner, Phys. Rev. B: Condens. Matter Mater. Phys., 1994, 49, 14251 CrossRef CAS.
- G. Kresse and J. Furthmuller, Comput. Mater. Sci., 1996, 6, 15 CrossRef CAS.
- J. P. Perdew, K. Burke and M. Ernzerhof, Phys. Rev. Lett., 1996, 77, 3865 CrossRef CAS.
- J. P. Perdew, K. Burke and M. Ernzerhof, Phys. Rev. Lett., 1997, 78, 1396 CrossRef CAS.
- P. E. Blochl, Phys. Rev. B: Condens. Matter Mater. Phys., 1994, 50, 17953 CrossRef.
- G. Kresse and D. Joubert, Phys. Rev. B: Condens. Matter Mater. Phys., 1999, 59, 1758 CrossRef CAS.
- S. J. Grimme, Comput. Chem., 2006, 27, 1787 CrossRef CAS PubMed.
- S. Grimme, J. Antony, S. Ehrlich and H. J. Krieg, Chem. Phys., 2010, 132 Search PubMed.
- K. Lee, E. D. Murray, L. Z. Kong, B. I. Lundqvist and D. C. Langreth, Phys. Rev. B: Condens. Matter Mater. Phys., 2010, 82, 081101 CrossRef.
- L. Grajciar, C. O. Arean, A. Pulido and P. Nachtigall, Phys. Chem. Chem. Phys., 2010, 12, 1497 RSC.
- Y. Li, W. P. Guo, W. B. Fan, S. P. Yuan, J. F. Li, J. G. Wang, H. J. Jiao and T. Tatsumi, J. Mol. Catal. A: Chem., 2011, 338, 24 CAS.
- J. B. Nicholas and M. Feyereisen, J. Chem. Phys., 1995, 103, 8031 CrossRef CAS PubMed.
- T. H. Dunning, J. Chem. Phys., 1989, 90, 1007 CrossRef CAS PubMed.
- B. Onida, F. Geobaldo, F. Testa, F. Crea and E. Garrone, Microporous Mesoporous Mater., 1999, 30, 119 CrossRef CAS.
- D. Meloni, S. Laforge, D. Martin, M. Guisnet, E. Rombi and V. Solinas, Appl. Catal., A, 2001, 215, 55 CrossRef CAS.
- Z. Sobalik, Z. Tvaruzkova, B. Wichterlova, V. Fila and S. Spatenka, Appl. Catal., A, 2003, 253, 271 CrossRef CAS.
- P. Ayrault, J. Datka, S. Laforge, D. Martin and M. Guisnet, J. Phys. Chem. B, 2004, 108, 13755 CrossRef CAS.
- M. Rubes, L. Grajciar, O. Bludsky, A. D. Wiersum, P. L. Llewellyn and P. Nachtigall, ChemPhysChem, 2012, 13, 488 CrossRef CAS PubMed.
- L. Grajciar, A. D. Wiersum, P. L. Llewellyn, J.-S. Chang and P. Nachtigall, J. Phys. Chem. C, 2011, 115, 17925 CAS.
- L. Grajciar, J. Cejka, A. Zukal, C. O. Arean, G. T. Palomino and P. Nachtigall, ChemSusChem, 2012, 5, 2011 CrossRef CAS PubMed.
- K. Chakarova and K. Hadjiivanov, Microporous Mesoporous Mater., 2013, 177, 59 CrossRef CAS PubMed.
- B. Gil, B. Marszalek, A. Micek-Ilnicka and Z. Olejniczak, Top. Catal., 2010, 53, 1340 CrossRef CAS.
- Z. Zhu, Q. Chen, Z. Xie, W. Yang and C. Li, Microporous Mesoporous Mater., 2006, 88, 16 CrossRef CAS PubMed.
- C. C. Tsai, C. Y. Zhong, I. Wang, S. B. Liu, W. H. Chen and T. C. Tsai, Appl. Catal., A, 2004, 267, 87 CrossRef CAS PubMed.
Footnote |
| † Electronic supplementary information (ESI) available. See DOI: 10.1039/c3cp54738h |
| This journal is © the Owner Societies 2014 |

