 Open Access Article
Creative Commons Attribution 3.0 Unported Licence
Support effect on Ni-based mono- and bimetallic catalysts in CO2 hydrogenation†
Jihao
Wang
a,
Shilong
Chen
 *a,
Pierfrancesco
Ticali
 a,
Paulina
Summa
b,
Simon
Mai
a,
Katarzyna
Skorupska
a,
Paulina
Summa
b,
Simon
Mai
a,
Katarzyna
Skorupska
 b and
Malte
Behrens
 *a
*a
aInstitute of Inorganic Chemistry, Kiel University, Max-Eyth-Str. 2, 24118 Kiel, Germany. E-mail: schen@ac.uni-kiel.de; mbehrens@ac.uni-kiel.de
bDepartment of Inorganic Chemistry, Fritz-Haber-Institute of the Max-Planck-Society, Faradayweg 4-6, 14195 Berlin, Germany
First published on 15th August 2024
Abstract
Aiming at a comprehensive understanding of support effects on Ni-based bimetallic catalyst for CO2 hydrogenation, spectroscopy (DRIFTS) with CO as a probe molecule and temperature-programmed techniques were used to investigate the impact of different supports (MgO, CeO2, ZrO2) on Ni- and Ni,Fe catalysts. Kinetic parameters revealed that the higher selectivity to methanation for Ni and Ni,Fe supported on the reducible oxides (CeO2, ZrO2) is due to the inhibition of reverse water-gas shift reaction (RWGS) by hydrogen. A promoting effect of Fe on Ni was only observed on MgO-supported catalysts. In situ DRIFTS with CO adsorption showed different electronic properties of Ni sites with partially reduced oxide (i.e. ZrO2 and CeO2). H2-TPR and CO2-TPD confirmed the significant role of metal-support interaction (MSI) in CeO2-supported catalysts for CO2 activation. The MSI between Ni/Ni,Fe and reducible supports are crucial for catalytic performance, ultimately leading to the higher activity and stability in CO2 hydrogenation.
1. Introduction
CO2 hydrogenation is a cornerstone of sustainable “power-to-gas (P2G)” concepts1–5 and supported Ni catalysts are considered as the most promising base metal catalyst towards methanation due to their outstanding catalytic performance and low cost.6–10 Despite the long history of research on nickel-based catalysts, there is still a need for a better fundamental understanding and for further rational optimization of such methanation catalysts.11,12One the one hand, regarding catalyst composition variation or promotion, partial substitution of Ni by a second metal was shown to improve the catalytic performance for CO2 methanation.13,14 Compared to Ni catalysts, Ni,Fe bimetallic catalysts reach a significantly improved catalytic activity.15–19 For example, Grunwaldt and co-workers reported that a small addition of Fe to Ni/Al2O3 catalysts will increase activity and stability with an optimum ratio of Ni![[thin space (1/6-em)]](https://www.rsc.org/images/entities/char_2009.gif) :
:![[thin space (1/6-em)]](https://www.rsc.org/images/entities/char_2009.gif) Fe = 3
Fe = 3![[thin space (1/6-em)]](https://www.rsc.org/images/entities/char_2009.gif) :
:![[thin space (1/6-em)]](https://www.rsc.org/images/entities/char_2009.gif) 1.20–22 They proposed that the redox cycle of iron species on Ni nanoparticles will promote the dissociation of CO2 and further improve the activity.23 Similarly, Huynh et al. reported a Ni
1.20–22 They proposed that the redox cycle of iron species on Ni nanoparticles will promote the dissociation of CO2 and further improve the activity.23 Similarly, Huynh et al. reported a Ni![[thin space (1/6-em)]](https://www.rsc.org/images/entities/char_2009.gif) :
:![[thin space (1/6-em)]](https://www.rsc.org/images/entities/char_2009.gif) Fe ratio of 4
Fe ratio of 4![[thin space (1/6-em)]](https://www.rsc.org/images/entities/char_2009.gif) :
:![[thin space (1/6-em)]](https://www.rsc.org/images/entities/char_2009.gif) 1 to be optimal.24 It was also reported that CO2 is hydrogenated to HCOO* intermediates with a lower energy barrier. Meanwhile, other reports claim that the Ni-FeOx interfaces are more active for RWGS reaction due to its weak binding to CO* intermediates.25
1 to be optimal.24 It was also reported that CO2 is hydrogenated to HCOO* intermediates with a lower energy barrier. Meanwhile, other reports claim that the Ni-FeOx interfaces are more active for RWGS reaction due to its weak binding to CO* intermediates.25
On the other hand, CO2 hydrogenation over supported Ni catalysts is highly structure-sensitive.26–28 The size effect of Ni nanoparticles on CO adsorption has been proven to steer the selectivity of CO2 hydrogenation, either to methane or to CO.29,30 In addition, the support also plays as an important role for Ni catalysts in CO2 methanation,31–36 including its impact on the size and shape of the Ni nanoparticles (i.e. dispersion and morphology),37 but also on CO2 activation by the basicity and reducibility of the support.38–40 Oxygen vacancies can be formed in reducible oxides during CO2 hydrogenation, affecting the catalyst behavior. For example, in a series of Ni catalysts on different supports (Al2O3, ZrO2, CeO2), Ni supported on non-reducible Al2O3 shown the lowest CO2 conversion.31 Furthermore, strong metal-support interaction (SMSI) can affect the stability of CO2 methanation, but also the selectivity.41 Such effects typically are dynamic and depend on the reaction conditions and catalysts pre-treatments in a complicated manner. Monai et al. recently reported that such SMSI can generate interfacial sites on Ni/TiO2 catalysts favoring carbon–carbon coupling and enhance the C2+ species formation during CO2 hydrogenation.42
So far, the effect of reducible supports on bimetallic Ni,Fe catalysts for CO2 hydrogenation has not been studied to the same extent as the support effect on monometallic catalysts or the Fe promotion effect on unreducible supports.43 In this work, we first confirmed the intrinsic optimal Ni![[thin space (1/6-em)]](https://www.rsc.org/images/entities/char_2009.gif) :
:![[thin space (1/6-em)]](https://www.rsc.org/images/entities/char_2009.gif) Fe ratio for methanation on non-reducible, but basic MgO. Then, monometallic Ni and bimetallic Ni,Fe catalysts at this optimal ratio supported on MgO, ZrO2 and CeO2 have been compared to study if the promotional effect of Fe depends on the varying reducibility of the support by kinetic measurements, H2-TPR, CO2-TPD, and in situ DRIFTS measurements.
Fe ratio for methanation on non-reducible, but basic MgO. Then, monometallic Ni and bimetallic Ni,Fe catalysts at this optimal ratio supported on MgO, ZrO2 and CeO2 have been compared to study if the promotional effect of Fe depends on the varying reducibility of the support by kinetic measurements, H2-TPR, CO2-TPD, and in situ DRIFTS measurements.
2. Experimental section
2.1. Catalyst preparation
The catalysts were prepared by the incipient wetness impregnation method. For the support of MgO, 1.25 mL of an aqueous solution containing Fe(NO3)3·9H2O (99.5%, Grüssing GmbH) and Ni(NO3)2·6H2O (99.9%, abcr GmbH) was added dropwise to 1 g of MgO (>99%, Alfa Aesar). The metal salt concentration was adjusted to reach a metal total (Ni and/or Fe) loading of 5 wt% on MgO. The wet powder was further stirred and then treated by ultrasonication for 15 min. After drying at 80 °C overnight, the collected pre-catalysts were directly reduced with 10%H2/N2 at 450 °C for 2 h prior to the catalytic tests. By changing the ratio between Fe(NO3)3·9H2O and Ni(NO3)2·6H2O in the aqueous solution, the molar ratio of Ni![[thin space (1/6-em)]](https://www.rsc.org/images/entities/char_2009.gif) :
:![[thin space (1/6-em)]](https://www.rsc.org/images/entities/char_2009.gif) Fe has been adjusted to 1
Fe has been adjusted to 1![[thin space (1/6-em)]](https://www.rsc.org/images/entities/char_2009.gif) :
:![[thin space (1/6-em)]](https://www.rsc.org/images/entities/char_2009.gif) 0, 5
0, 5![[thin space (1/6-em)]](https://www.rsc.org/images/entities/char_2009.gif) :
:![[thin space (1/6-em)]](https://www.rsc.org/images/entities/char_2009.gif) 1, 2
1, 2![[thin space (1/6-em)]](https://www.rsc.org/images/entities/char_2009.gif) :
:![[thin space (1/6-em)]](https://www.rsc.org/images/entities/char_2009.gif) 1, 1
1, 1![[thin space (1/6-em)]](https://www.rsc.org/images/entities/char_2009.gif) :
:![[thin space (1/6-em)]](https://www.rsc.org/images/entities/char_2009.gif) 1, 1
1, 1![[thin space (1/6-em)]](https://www.rsc.org/images/entities/char_2009.gif) :
:![[thin space (1/6-em)]](https://www.rsc.org/images/entities/char_2009.gif) 2, and 0
2, and 0![[thin space (1/6-em)]](https://www.rsc.org/images/entities/char_2009.gif) :
:![[thin space (1/6-em)]](https://www.rsc.org/images/entities/char_2009.gif) 1. The reduced samples are labelled as Ni/MgO, Ni,Fe(83
1. The reduced samples are labelled as Ni/MgO, Ni,Fe(83![[thin space (1/6-em)]](https://www.rsc.org/images/entities/char_2009.gif) :
:![[thin space (1/6-em)]](https://www.rsc.org/images/entities/char_2009.gif) 17)/MgO, Ni,Fe(67
17)/MgO, Ni,Fe(67![[thin space (1/6-em)]](https://www.rsc.org/images/entities/char_2009.gif) :
:![[thin space (1/6-em)]](https://www.rsc.org/images/entities/char_2009.gif) 33)/MgO, Ni,Fe(50
33)/MgO, Ni,Fe(50![[thin space (1/6-em)]](https://www.rsc.org/images/entities/char_2009.gif) :
:![[thin space (1/6-em)]](https://www.rsc.org/images/entities/char_2009.gif) 50)/MgO, Ni,Fe(33
50)/MgO, Ni,Fe(33![[thin space (1/6-em)]](https://www.rsc.org/images/entities/char_2009.gif) :
:![[thin space (1/6-em)]](https://www.rsc.org/images/entities/char_2009.gif) 67)/MgO, and Fe/MgO respectively. The same procedure has been applied to the supports of ZrO2 (99%, Alfa Aesar) and CeO2 (99.5%, Alfa Aesar), but only monometallic Ni and a Ni
67)/MgO, and Fe/MgO respectively. The same procedure has been applied to the supports of ZrO2 (99%, Alfa Aesar) and CeO2 (99.5%, Alfa Aesar), but only monometallic Ni and a Ni![[thin space (1/6-em)]](https://www.rsc.org/images/entities/char_2009.gif) :
:![[thin space (1/6-em)]](https://www.rsc.org/images/entities/char_2009.gif) Fe ratio of 5
Fe ratio of 5![[thin space (1/6-em)]](https://www.rsc.org/images/entities/char_2009.gif) :
:![[thin space (1/6-em)]](https://www.rsc.org/images/entities/char_2009.gif) 1 catalysts were selected, resulting in samples labelled as Ni/ZrO2, Ni,Fe(83
1 catalysts were selected, resulting in samples labelled as Ni/ZrO2, Ni,Fe(83![[thin space (1/6-em)]](https://www.rsc.org/images/entities/char_2009.gif) :
:![[thin space (1/6-em)]](https://www.rsc.org/images/entities/char_2009.gif) 17)/ZrO2, Ni/CeO2 and Ni,Fe(83
17)/ZrO2, Ni/CeO2 and Ni,Fe(83![[thin space (1/6-em)]](https://www.rsc.org/images/entities/char_2009.gif) :
:![[thin space (1/6-em)]](https://www.rsc.org/images/entities/char_2009.gif) 17)/CeO2.
17)/CeO2.
2.2. Catalysts characterization
Inductively coupled plasma optical emission spectroscopy (ICP-OES) was applied to analyze the elemental compositions of those catalysts supported on MgO and CeO2. The pre-catalysts were dissolved in a mixture of nitric acid and hydrogen peroxide and measured on an Avio 200 ICP OES equipped with a S23 Autosampler (PerkinElmer). Due to the low solubility of ZrO2, the metal compositions of these catalysts were determined in a scanning electron microscope by energy dispersive X-ray spectroscopy (SEM-EDX) using a Gemini Ultra55Plus (Zeiss).The surface area was measured by N2 physisorption using the Brunauer–Emmett–Teller (BET) method on a BELSORP MAX (Microtrac Retsch GmbH). The samples were pre-treated at 100 °C for 2 h in vacuum to remove adsorbed moisture and air. The isotherm was measured at −197 °C in liquid nitrogen.
Powder X-ray diffraction (PXRD) was used to study the crystal structure of the catalysts using Mo Kα radiation on a STADI P diffractometer (STOE). To avoid the re-oxidation of the reduced catalysts, the reduced samples were prepared in an Ar glovebox as sealed capillaries with 0.7 mm diameter and later measured in the Debye–Scherrer mode.
Hydrogen temperature programmed reduction (H2-TPR) was performed on a BELCAT II catalyst analyzer (Microtrac Retsch GmbH) to study the reducibility of the catalysts. The measurements were conducted with 50 mg of the samples filled in a quartz glass fixed-bed micro-reactor. After pretreatment at 120 °C under on Ar flow for 1 h, the reactor was cooled down to 40 °C and then heated to 1000 °C at a rate of 6 °C min−1 in a 50 sccm of 10%H2/Ar flow. The reactor was later kept at 1000 °C for 15 min before cooling down and the H2 consumption was measured with a thermal conductivity detector (TCD). The degree of the reduction (%) of the supported metal was estimated by the H2 consumption assuming that full reduction corresponds to a state with all Ni and Fe being metallic, CuO was used to calibrate the H2 consumption.
CO2 temperature programmed desorption (CO2-TPD) profiles were recorded with the home-built reaction setup equipped with TCDs on the inlet and outlet of the quartz tube reactor. Prior the measurement, all samples were heated to 450 °C with a rate of 5 °C min−1 in a 10 mL min−1 of 20% H2/Ar flow. After an isothermal reduction at 450 °C for 2 h, samples were cooled down to 50 °C in a flow of He to remove the residual gases from the reduction. CO2 adsorption was carried out at 50 °C for 2 h with a flow rate of 10 mL min−1. Then a 10 mL min−1 of He was introduced to remove physically adsorbed CO2 before the desorption. CO2-TPD curve was drawn at the temperature range from 50 to 600 °C with the heating rate of 10 °C min−1. The number of surface basic sites was calculated using the integration of the calibrated CO2 peak below the curve. The raw data were smoothed first and then fitted (Fig. S3, ESI†) into three Gaussian peaks at different temperature ranges representing the weak, medium and strong basic sites.
Transmission Electron Microscopy (TEM) was employed to evaluate the nanoparticle size of the freshly reduced samples. TEM images were taken in the bright field mode on a Tecnai F30 G2 S-TWIN (Thermo Fisher Scientific) equipped with a field emission gun (FEG) using an acceleration voltage of 300 kV and a spherical aberration coefficient of 1.2 mm. Due to the low metal loading and small nanoparticle size, the brightness and contrast of TEM images were adjusted to clearly identify metal particles.
Diffuse Reflectance Infrared Fourier Transform Spectroscopy (DRIFTS) measurements were performed on the reduced catalyst following the adsorption and desorption of CO used as a probe molecule. The samples were heated up to 450 °C with 5 °C min−1 in an 80 mL min−1 flow of 10%H2/He and then an isothermal reduction was performed for 2 h. Afterwards, the reduced catalysts were purged in pure He for 30 min and then cooled down to 10 °C. The analysis was performed under 80 mL min−1 of 0.5% CO/He mixture flow for 40 minutes during adsorption and pure He flow for 40 minutes during desorption. The spectra were collected by a iS50 FTIR spectrometer (Thermo Fisher Scientific) equipped with a high-temperature reaction chamber (Praying Mantis, Harrick) coupled with a dome mounting ZnSe windows. All measurements were collected by the OMNIC software via an automatic series collection using a Gram-Schmidt method. The temperature was controlled by Harrick ATC and a Huber Ministat 125 chiller. No compensation of H2O and CO2 signal was used.
2.3. Kinetic measurements
Catalytic tests were performed in a U-shaped micro-reactor where the catalyst bed was fixed by quartz wool plugs. A thermocouple was inserted directly into the catalyst bed to measure the temperature. After isothermal reduction at 450 °C for 2 h, the reactor was cooled down to 350 °C and 50 sccm of a reaction gas mixture was injected into the reactor to start the CO2 hydrogenation test at atmospheric pressure, consisting of 9.6% CO2/N2, 38.4% H2 and balanced N2. The inlet gas flow was controlled by mass flow controllers (Bronkhorst) and the gas composition at the exhaust was evaluated by a micro-GC (INFICON). In a typical catalytic test, 30 mg of MgO-supported catalysts were used while 10 and 3 mg of the ZrO2 and CeO2-supported catalysts were sufficient to reach a similar CO2 conversion of less than 25% to ensure the measured selectivity for methanation can be compared at similar conversion levels. The catalyst sieve fraction of 200–300 μm was diluted with 350–460 μm SiC (Thermal Scientific) to give a total weight of 200 mg to avoid heat and mass transfer issues.The activation energies (Ea) of selected catalysts were measured at temperatures ranging from 315 to 355 °C and reaction orders for H2 and CO2 were tested in the same reactor at 350 °C by changing the respective partial pressures. All the kinetic measurements were conducted under low CO2 conversion of less than 25%.
As shown in eqn (1), the reaction rates of CO2 hydrogenation were defined as the CH4 production rate (rCH4) for methanation and the CO production rate (rCO) for the RWGS normalized to the weight of active metals. The conversion of CO2 and the selectivity for CH4/CO were calculated as eqn (2) and (3).
 | (1) |
 | (2) |
 | (3) |
3. Results
The metal loading of the as-synthesized samples was checked by ICP-OES and SEM-EDX, which confirmed the total metal loading are approximately 5 wt% for all the samples (Tables S1 and 2, ESI†). For the bimetallic catalysts, also the measured Ni![[thin space (1/6-em)]](https://www.rsc.org/images/entities/char_2009.gif) :
:![[thin space (1/6-em)]](https://www.rsc.org/images/entities/char_2009.gif) Fe ratios are in reasonable agreements with the nominal values (Tables S1 and 2, ESI†). The BET surface areas of the commercial supports are approximately 15 (MgO), 26 (ZrO2), and 64 (CeO2) m2 g−1 (Table S3, ESI†). The reducibility of the Ni,(Fe)/MgO catalysts was studied by H2-TPR (Fig. 1a). With increasing Fe content, the reduction peaks gradually shift to higher temperatures. Such trend is consistent with previous reports and can be explained by the less noble nature of iron compared to nickel.44,45 A single TPR peak was observed for the reduction into the metallic state indicating presence of uniform metal species.46,47 Only a weak shoulder is observed at the lower temperature side of the TPR profile (around 400 °C) with increasing Fe content, which can be assigned to the intermediate reduction of Fe3+ to Fe2+.47–49 There is no significant reduction at temperatures higher than 500 °C for all the MgO-supported catalysts confirming the unreducible nature of the support at these conditions. Thus, an isothermal reduction at 450 °C for 2 h was chosen to reach a full reduction of both Ni and Fe. The XRD patterns of the freshly reduced samples are shown in Fig. 1b. The major crystalline phase in all catalysts is MgO while there are no obvious reflections of Ni or Fe metal detected, which can be explained with the low loading of active metal and the small crystallite size.
Fe ratios are in reasonable agreements with the nominal values (Tables S1 and 2, ESI†). The BET surface areas of the commercial supports are approximately 15 (MgO), 26 (ZrO2), and 64 (CeO2) m2 g−1 (Table S3, ESI†). The reducibility of the Ni,(Fe)/MgO catalysts was studied by H2-TPR (Fig. 1a). With increasing Fe content, the reduction peaks gradually shift to higher temperatures. Such trend is consistent with previous reports and can be explained by the less noble nature of iron compared to nickel.44,45 A single TPR peak was observed for the reduction into the metallic state indicating presence of uniform metal species.46,47 Only a weak shoulder is observed at the lower temperature side of the TPR profile (around 400 °C) with increasing Fe content, which can be assigned to the intermediate reduction of Fe3+ to Fe2+.47–49 There is no significant reduction at temperatures higher than 500 °C for all the MgO-supported catalysts confirming the unreducible nature of the support at these conditions. Thus, an isothermal reduction at 450 °C for 2 h was chosen to reach a full reduction of both Ni and Fe. The XRD patterns of the freshly reduced samples are shown in Fig. 1b. The major crystalline phase in all catalysts is MgO while there are no obvious reflections of Ni or Fe metal detected, which can be explained with the low loading of active metal and the small crystallite size.
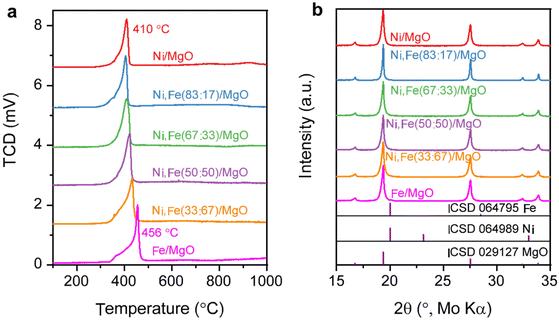 | ||
| Fig. 1 (a) H2-TPR profile for Ni,Fe monometallic and bimetallic catalysts supported on MgO and (b) their PXRD patterns after isothermal reduction of 450 °C. | ||
The catalytic performance of the reduced Ni,Fe/MgO catalysts for CO2 hydrogenation was evaluated at 350 °C for 16 h after the above-described reduction step. Both of the monometallic Ni and Fe catalysts showed stable activity in methanation and RWGS (Fig. 2) and, as expected, Ni had a higher activity and selectivity to methane. Note that it was reported that the addition of low amounts of Fe to Ni catalysts can prohibit the deactivation of monometallic Ni catalyst,22,50 but no such deactivation was present for the MgO-supported monometallic Ni in our experiment. However, the bimetallic Ni,Fe catalysts showed high CO2 conversions at the beginning, but suffer from gradual deactivation over 16 h time on stream (TOS). In this process, methanation deactivated stronger than RWGS leading to a decrease of CH4 selectivity (Fig. 2b–d). Sintering and carbon deposition are the most probable reasons for such initial deactivation.51–53 Under methanation reaction conditions, it has been reported that small Ni nanoparticles may coalesce to form bigger particles, followed by the Ostwald ripening.54,55 The particle size growth can also be associated to the formation of metal carbonyls due to the enhanced mobility of Ni(CO)x species.55–57 The particle size increase will result in the loss of surface area and active sites, eventually resulting in the deactivation of catalysts. After 16 h TOS, both the methanation and RWGS rates have approached to a steady-state for each catalyst, revealing a volcano-shaped trend with the Fe loading (Fig. 3). The optimal Ni![[thin space (1/6-em)]](https://www.rsc.org/images/entities/char_2009.gif) :
:![[thin space (1/6-em)]](https://www.rsc.org/images/entities/char_2009.gif) Fe ratio for the CO2 hydrogenation was identified as 5
Fe ratio for the CO2 hydrogenation was identified as 5![[thin space (1/6-em)]](https://www.rsc.org/images/entities/char_2009.gif) :
:![[thin space (1/6-em)]](https://www.rsc.org/images/entities/char_2009.gif) 1, i.e. Ni,Fe(83
1, i.e. Ni,Fe(83![[thin space (1/6-em)]](https://www.rsc.org/images/entities/char_2009.gif) :
:![[thin space (1/6-em)]](https://www.rsc.org/images/entities/char_2009.gif) 17)/MgO, with the highest activity in both methanation (0.035 mmolCH4 gmetal−1 s−1) and RWGS (0.302 mmolCO gmetal−1 s−1). It was proposed that iron oxide species can be formed from the oxidation of iron by CO2 and H2O in the gas stream. These can be dispersed on the Ni particles, and the redox cycle of oxidized Fe species can promote the CO2 hydrogenation.20–23 A similar dynamic promotion effect in Co,Fe bimetallic catalysts in CO2 hydrogenation was interpreted as a result of alloy formation after reduction of bimetallic catalysts.58 In both scenarios, a too strong increase in Fe loading will cause either blocking or substitution of active Ni sites at the surface, which explains the decreased activity with higher Fe loading, which is not uncommon for promoter species. Besides, our Ni,Fe bimetallic catalysts also suffer from deactivation, which might be associated with the gradual and dynamic formation of such oxidized Fe “islands”.
17)/MgO, with the highest activity in both methanation (0.035 mmolCH4 gmetal−1 s−1) and RWGS (0.302 mmolCO gmetal−1 s−1). It was proposed that iron oxide species can be formed from the oxidation of iron by CO2 and H2O in the gas stream. These can be dispersed on the Ni particles, and the redox cycle of oxidized Fe species can promote the CO2 hydrogenation.20–23 A similar dynamic promotion effect in Co,Fe bimetallic catalysts in CO2 hydrogenation was interpreted as a result of alloy formation after reduction of bimetallic catalysts.58 In both scenarios, a too strong increase in Fe loading will cause either blocking or substitution of active Ni sites at the surface, which explains the decreased activity with higher Fe loading, which is not uncommon for promoter species. Besides, our Ni,Fe bimetallic catalysts also suffer from deactivation, which might be associated with the gradual and dynamic formation of such oxidized Fe “islands”.
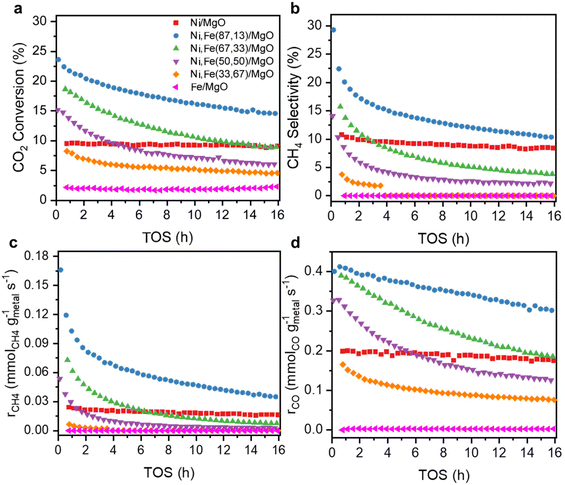 | ||
Fig. 2 (a) CO2 conversion, (b) selectivity towards CH4, (c) methanation rate and (d) RWGS rate as a function of TOS for MgO-supported catalysts with various Ni![[thin space (1/6-em)]](https://www.rsc.org/images/entities/char_2009.gif) : :![[thin space (1/6-em)]](https://www.rsc.org/images/entities/char_2009.gif) Fe ratios at 350 °C. Fe ratios at 350 °C. | ||
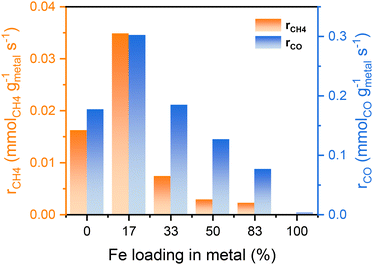 | ||
| Fig. 3 Reaction rates of both methanation and RWGS after 16 h test for different Fe loadings in Ni,(Fe)/MgO catalysts. | ||
The Ni,Fe(83![[thin space (1/6-em)]](https://www.rsc.org/images/entities/char_2009.gif) :
:![[thin space (1/6-em)]](https://www.rsc.org/images/entities/char_2009.gif) 17)/MgO catalyst reached the highest reaction rate of both methanation and RWGS reactions with the highest CH4 selectivity in this series of catalysts (∼10.2%) (Fig. 2b–d). This ratio of 5
17)/MgO catalyst reached the highest reaction rate of both methanation and RWGS reactions with the highest CH4 selectivity in this series of catalysts (∼10.2%) (Fig. 2b–d). This ratio of 5![[thin space (1/6-em)]](https://www.rsc.org/images/entities/char_2009.gif) :
:![[thin space (1/6-em)]](https://www.rsc.org/images/entities/char_2009.gif) 1 for Ni
1 for Ni![[thin space (1/6-em)]](https://www.rsc.org/images/entities/char_2009.gif) :
:![[thin space (1/6-em)]](https://www.rsc.org/images/entities/char_2009.gif) Fe has been employed in the study of the other two supports, i.e. ZrO2 and CeO2, to investigate the support effect on the Ni,Fe bimetallic catalysts for CO2 hydrogenation.
Fe has been employed in the study of the other two supports, i.e. ZrO2 and CeO2, to investigate the support effect on the Ni,Fe bimetallic catalysts for CO2 hydrogenation.
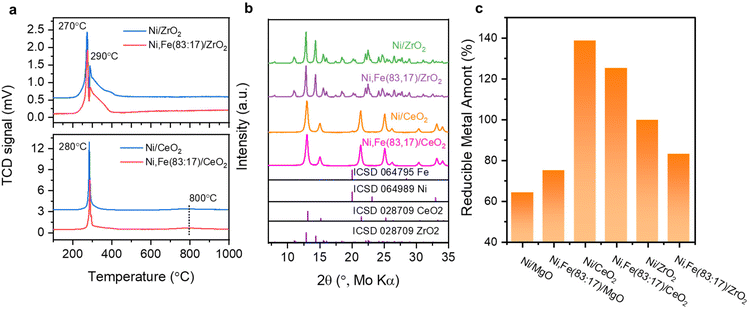
The reducibility of these two series catalysts was studied first. The H2-TPR profiles of ZrO2 and CeO2 supported catalysts exhibit two reduction peaks below 400 °C, which could result from weakly and strongly bound Ni2+ and Fe3+ species59,60 (Fig. 4a), indicating the reduction of the metal completes before 450 °C. Besides, the reduction degree (%) of the supported metal estimated by the H2 consumption assuming that all Ni and Fe can be fully reduced were compared among these mono- and bimetallic supported catalysts, following the order CeO2 → ZrO2 → MgO-supported catalysts (Fig. 4c). The higher reduction degree of CeO2- and ZrO2-supported catalysts agree with the reducibility of these oxides. For the CeO2-supported catalysts, reduction degree even higher than 100% clearly indicate that support species have been reduced together with the metal oxide species at low temperature (<300 °C), agreeing well with the previous report of co-reduction of highly dispersed metal and support-CeO2,61–63 which was explained by metal-support interaction (MSI) and/or hydrogen spillover effects.64–68
The XRD patterns of these reduced samples show broad reflections for Ni and Fe at around 20° 2θ, which might be due to the small metal particle size or low metal loading (Fig. 4b). The broad XRD peak profiles agree well with the TEM images showing that most metal nanoparticles have a size around 5–10 nm (Fig. 5). Similar nanoparticle sizes were found for all six catalysts, which indicates that the comparison here is not strongly affected by possible size effects on CO2 hydrogenation.69
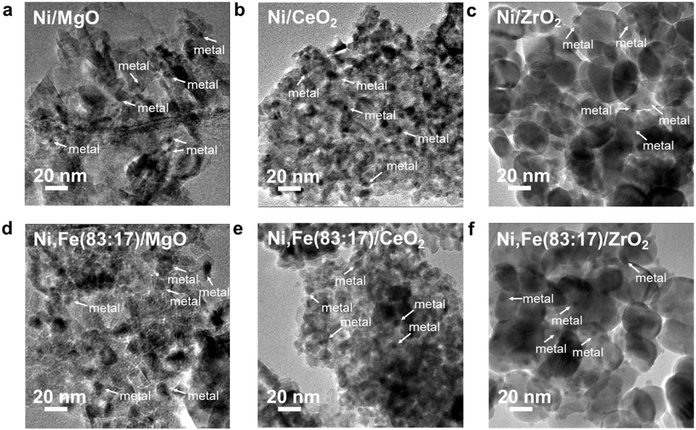 | ||
| Fig. 5 TEM images for Ni–Fe monometallic and bimetallic catalysts supported on (a) & (d) MgO, (b) & (e) ZrO2 and (c) & (f) CeO2. | ||
All supported Ni and Ni,Fe(83![[thin space (1/6-em)]](https://www.rsc.org/images/entities/char_2009.gif) :
:![[thin space (1/6-em)]](https://www.rsc.org/images/entities/char_2009.gif) 17) catalysts were studied in the CO2 hydrogenation reaction at 350 °C for 16 h. The CO2 conversion is similar for monometallic Ni and bimetallic Ni,Fe(83
17) catalysts were studied in the CO2 hydrogenation reaction at 350 °C for 16 h. The CO2 conversion is similar for monometallic Ni and bimetallic Ni,Fe(83![[thin space (1/6-em)]](https://www.rsc.org/images/entities/char_2009.gif) :
:![[thin space (1/6-em)]](https://www.rsc.org/images/entities/char_2009.gif) 17) catalysts on both supports ZrO2 and CeO2, suggesting in contrast to MgO-supported catalysts, no clear promotion effect of Fe on the CO2 conversion for these reducible supports (Fig. S2, ESI†). Monometallic Ni even showed a higher CO2 methanation rate than bimetallic Ni,Fe(83
17) catalysts on both supports ZrO2 and CeO2, suggesting in contrast to MgO-supported catalysts, no clear promotion effect of Fe on the CO2 conversion for these reducible supports (Fig. S2, ESI†). Monometallic Ni even showed a higher CO2 methanation rate than bimetallic Ni,Fe(83![[thin space (1/6-em)]](https://www.rsc.org/images/entities/char_2009.gif) :
:![[thin space (1/6-em)]](https://www.rsc.org/images/entities/char_2009.gif) 17) if supported on ZrO2 or CeO2 (Fig. 6) showing a negative effect of Fe addition on the methane selectivity. Actually, Winter et al. already found that the introduction of Fe to Ni catalysts supported on CeO2 will increase the selectivity towards RWGS.70 They proposed that the formation of oxidized Fe will weaken the CO binding strength, resulting in desorption. Since the adsorbed CO is one of the potential intermediates for methanation, this can explain the lower selectivity to CH4 in favor or RWGS.71 However, this is very different to MgO-supported catalysts where the addition of Fe enhances both CO2 conversion and methane selectivity, though on a lower level of around 10%. The absolute selectivity to methane for Ni/CeO2 and Ni/ZrO2 were much higher than on MgO and reached 82.3% and even 94.4%, indicating that the methanation reaction is greatly promoted by the reducible nature of the oxide support with a much stronger effect than the presence or absence of Fe.
17) if supported on ZrO2 or CeO2 (Fig. 6) showing a negative effect of Fe addition on the methane selectivity. Actually, Winter et al. already found that the introduction of Fe to Ni catalysts supported on CeO2 will increase the selectivity towards RWGS.70 They proposed that the formation of oxidized Fe will weaken the CO binding strength, resulting in desorption. Since the adsorbed CO is one of the potential intermediates for methanation, this can explain the lower selectivity to CH4 in favor or RWGS.71 However, this is very different to MgO-supported catalysts where the addition of Fe enhances both CO2 conversion and methane selectivity, though on a lower level of around 10%. The absolute selectivity to methane for Ni/CeO2 and Ni/ZrO2 were much higher than on MgO and reached 82.3% and even 94.4%, indicating that the methanation reaction is greatly promoted by the reducible nature of the oxide support with a much stronger effect than the presence or absence of Fe.
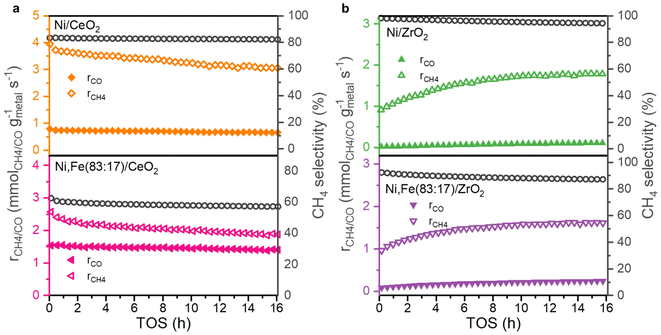 | ||
| Fig. 6 Methanation and RWGS rates and selectivity towards CH4 as a function of TOS for (a) CeO2 and (b) ZrO2-supported monometallic and bimetallic catalysts for 16 h TOS at 350 °C. | ||
While the selectivity remains quite stable during the 16 hours TOS (Fig. 6), the conversions show an interesting trend (Fig. S2, ESI†). The CeO2-supported catalysts show a slight deactivation, which is much less pronounced compared to Ni,Fe(83![[thin space (1/6-em)]](https://www.rsc.org/images/entities/char_2009.gif) :
:![[thin space (1/6-em)]](https://www.rsc.org/images/entities/char_2009.gif) 17)/MgO, but for the ZrO2 supports, a clear activation phase in both of methanation and RWGS reactions was observed. A similar behavior was found before in Ru/ZrO2 in COx methanation,39,72 which was explained by the slow reduction of ZrO2 leading to increasing metal-support interaction during the hydrogenation reaction.
17)/MgO, but for the ZrO2 supports, a clear activation phase in both of methanation and RWGS reactions was observed. A similar behavior was found before in Ru/ZrO2 in COx methanation,39,72 which was explained by the slow reduction of ZrO2 leading to increasing metal-support interaction during the hydrogenation reaction.
The reaction pathways on Ni/ZrO2 and Ni/CeO2 catalysts discussed in the literature indeed assume a strong involvement of the support. CO2 is first adsorbed on a hydroxyl group of the ZrO2/CeO2 support. There, it can be hydrogenated to formate by dissociated hydrogen from metallic Ni under desorption of H2O.73–77 The formate intermediate can either decompose and then transfer onto the surface of the metallic Ni nanoparticle or directly be converted on the ZrO2/CeO2 surface to CH4 by combing with more dissociated hydrogen spilled over from Ni.73,75–77 Both reaction pathways require a strong participation of ZrO2/CeO2 in the CO2 activation steps. The latter pathway even avoids adsorption of any carbon- or oxygen-bound intermediates on the surface of Ni, which could help to keep the metallic Ni particles free from deactivating species. Contrarily, for the catalysts supported on MgO, CO2 and its CO* or HCOO* intermediates may absorb mainly on the Ni surface, which increases the probability of strong deactivation by oxidation or coking.7
Comparing the steady-state activity (after 16 h TOS) among these Ni and Ni,Fe catalysts supported on three different oxides, the CeO2 supported catalysts show the highest activity. Ni/CeO2 has the highest methanation rate of 3.0 mmolCH4 gmetal−1 s−1 and Ni,Fe(83![[thin space (1/6-em)]](https://www.rsc.org/images/entities/char_2009.gif) :
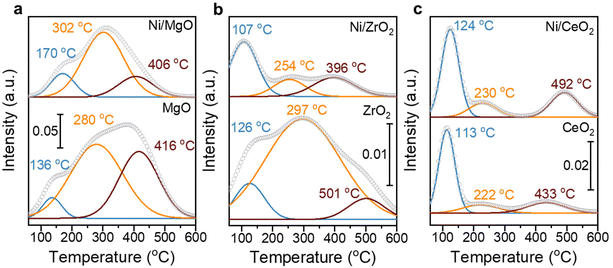
:![[thin space (1/6-em)]](https://www.rsc.org/images/entities/char_2009.gif) 17)/CeO2 has the highest RWGS rate of 1.3 mmolCO gmetal−1 s−1 (Fig. 7). The steady-state activity of the methanation reaction followed the order of MgO-supported < ZrO2-supported < CeO2-supported, which agrees well with the reducibility order: MgO < ZrO2 < CeO2 and underlines to role of a SMSI or electronic metal-support interaction (EMSI) effect.18,33,39,78 The basicity of the Ni-based monometallic catalysts and their bare support were investigated through CO2-TPD experiments (Fig. 8 and Table 1). CO2-TPD profiles revealed three Gaussian peaks representing the weak (100–170 °C), medium (222–302 °C), and strong (396–501 °C) basic sites. The low-temperature peak corresponds to the CO2 desorption from weak Brønsted sites.79–82 The medium-temperature peak originates from bidentate carbonates on metal–oxygen pairs such as Mg–O.79–82 The high-temperature peak is correlated to the desorption of unidentate carbonates on low-coordination O2− anions.79–83 Based on the quantitative analysis of CO2-TPD profiles, Ni/CeO2 catalysts have the highest content of weak basic sites (29 μmolCO2 gcat−1) among these three supported Ni catalysts, which indicates that the CeO2 support can facilitate the CO2 adsorption, contributing to its high activity.84–86 Furthermore, compared to the bare support, our results suggest that CeO2-supported catalysts have a higher total density of basic sites (85 μmolCO2 gcat−1 for Ni/CeO2vs. 54 μmolCO2 gcat−1 for CeO2), whereas a lower total basic sites density was observed for the MgO-supported (111 μmolCO2 gcat−1 for Ni/MgO vs. 167 μmolCO2 gcat−1 for MgO) and ZrO2-supported (26 μmolCO2 gcat−1 for Ni/ZrO2vs. 85 μmolCO2 gcat−1 for ZrO2) samples. Notably, experimental results have revealed that MgO and its catalysts release significantly more CO2 during the TPD experiments. This increased CO2 release is likely related to the presence of bulk carbonates formed during CO2 adsorption87,88 and is not necessarily indicative of surface basicity. Nevertheless, these results clearly demonstrate that the SMSI in Ni/CeO2 catalyst results in interfacial sites more favorable for CO2 activation/conversion. As Ni/CeO2 contains a higher density of basic sites than the bare support CeO2, and given than the density of basic sites can be correlated to the oxygen vacancy density, this is consistent with the results of the H2-TPR analysis.89,90
17)/CeO2 has the highest RWGS rate of 1.3 mmolCO gmetal−1 s−1 (Fig. 7). The steady-state activity of the methanation reaction followed the order of MgO-supported < ZrO2-supported < CeO2-supported, which agrees well with the reducibility order: MgO < ZrO2 < CeO2 and underlines to role of a SMSI or electronic metal-support interaction (EMSI) effect.18,33,39,78 The basicity of the Ni-based monometallic catalysts and their bare support were investigated through CO2-TPD experiments (Fig. 8 and Table 1). CO2-TPD profiles revealed three Gaussian peaks representing the weak (100–170 °C), medium (222–302 °C), and strong (396–501 °C) basic sites. The low-temperature peak corresponds to the CO2 desorption from weak Brønsted sites.79–82 The medium-temperature peak originates from bidentate carbonates on metal–oxygen pairs such as Mg–O.79–82 The high-temperature peak is correlated to the desorption of unidentate carbonates on low-coordination O2− anions.79–83 Based on the quantitative analysis of CO2-TPD profiles, Ni/CeO2 catalysts have the highest content of weak basic sites (29 μmolCO2 gcat−1) among these three supported Ni catalysts, which indicates that the CeO2 support can facilitate the CO2 adsorption, contributing to its high activity.84–86 Furthermore, compared to the bare support, our results suggest that CeO2-supported catalysts have a higher total density of basic sites (85 μmolCO2 gcat−1 for Ni/CeO2vs. 54 μmolCO2 gcat−1 for CeO2), whereas a lower total basic sites density was observed for the MgO-supported (111 μmolCO2 gcat−1 for Ni/MgO vs. 167 μmolCO2 gcat−1 for MgO) and ZrO2-supported (26 μmolCO2 gcat−1 for Ni/ZrO2vs. 85 μmolCO2 gcat−1 for ZrO2) samples. Notably, experimental results have revealed that MgO and its catalysts release significantly more CO2 during the TPD experiments. This increased CO2 release is likely related to the presence of bulk carbonates formed during CO2 adsorption87,88 and is not necessarily indicative of surface basicity. Nevertheless, these results clearly demonstrate that the SMSI in Ni/CeO2 catalyst results in interfacial sites more favorable for CO2 activation/conversion. As Ni/CeO2 contains a higher density of basic sites than the bare support CeO2, and given than the density of basic sites can be correlated to the oxygen vacancy density, this is consistent with the results of the H2-TPR analysis.89,90
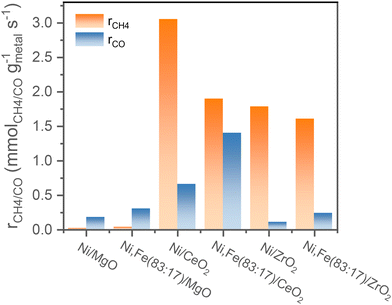 | ||
| Fig. 7 Comparison of the reaction rates of the different supported mono- or bimetallic catalysts for both methanation and RWGS after 16 h TOS. | ||
| Weak [μmol g−1] | Medium [μmol g−1] | Strong [μmol g−1] | Total [μmol g−1] | |
|---|---|---|---|---|
| MgO | 15 | 87 | 65 | 167 |
| Ni/MgO | 17 | 72 | 21 | 111 |
| ZrO2 | 11 | 52 | 22 | 85 |
| Ni/ZrO2 | 12 | 7 | 7 | 26 |
| CeO2 | 27 | 8 | 19 | 54 |
| Ni/CeO2 | 29 | 19 | 37 | 85 |
Further kinetic experiments were conducted for Ni and Ni,Fe catalysts to determine the apparent activation energy (Ea) and reaction order of CO2 and H2 with respect to methanation and RWGS for a deeper investigation of the support effect. From the Arrhenius plot shown (Fig. 9a–c), the apparent activation energy Ea for MgO and CeO2 supported catalysts are very similar between 71 and 79 kJ mol−1 in both methanation and RWGS reactions. However, the intercepts in the Arrhenius plot for the MgO-supported catalysts are much lower than for the CeO2-supported catalysts, suggesting more actives sites from the latter catalysts. This interpretation agrees with the previous hypothesis that the metal-support interaction provides additional abundant active sites at the ceria-metal interfaces. Besides, the high reducibility of CeO2 results into more oxygen vacancies introducing the so-called electronic metal-support-interaction (EMSI) effect, which can activate CO2 at lower temperatures.18 For ZrO2-supported catalysts, the Arrhenius plots suggest a different activation energy compared to MgO- and CeO2-supported catalysts. Here, the Ea of methanation is 94.4 kJ mol−1, which is almost half of that of RWGS (196.6 kJ mol−1), implying that the relative barrier energy for RWGS is very high on this type of catalyst. The big difference in activation energy for these two reactions on Ni/ZrO2 can account for the highest methane selectivity for ZrO2-supported catalysts.
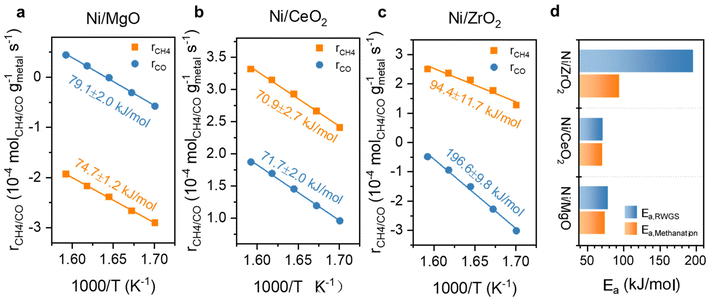 | ||
| Fig. 9 Arrhenius plots with calculated Ea for Ni catalysts supported on (a) MgO, (b) CeO2, (c) ZrO2 and (d) comparison of their Eas for RWGS and methanation. | ||
The reaction orders of CO2 and H2 for monometallic Ni and bimetallic Ni,Fe catalysts were studied for understanding of the limiting factors of reactants activation (Fig. 10 and 11). For the three monometallic Ni catalysts, an increasing in CO2 partial pressure affected the RWGS more than methanation, suggesting that the RWGS is limited by the activation of CO2, especially for Ni/CeO2 with the highest CO2 reaction order of 1.08 in RWGS (Fig. 10a–c). At the same time, the H2 partial pressure variation affected the methanation rate stronger and positively showing that the methanation is rather limited by the activation of H2. The RWGS was even affected negatively by an increase in the H2 partial pressure for the two catalysts on the reducible supports, CeO2 and ZrO2, especially for ZrO2-supported catalysts with a value of −0.86 (Fig. 10d–f). The high selectivity towards CH4 for the ZrO2-supported catalysts can therefore also be explained by the hydrogen-rich condition (H2![[thin space (1/6-em)]](https://www.rsc.org/images/entities/char_2009.gif) :
:![[thin space (1/6-em)]](https://www.rsc.org/images/entities/char_2009.gif) CO2 = 4
CO2 = 4![[thin space (1/6-em)]](https://www.rsc.org/images/entities/char_2009.gif) :
:![[thin space (1/6-em)]](https://www.rsc.org/images/entities/char_2009.gif) 1), which also agrees well with the previous results of activation energy. In addition, as the calculated reduction degree of CeO2 supported catalysts exceeds 100%, indicating that not only Ni and Fe were activated to the metallic state, but CeO2 was also partially reduced to CeO2−x, forming surface oxygen vacancies.91,92 The oxygen vacancies donate electrons which could participate in the adsorption and activation of CO2, explaining the reason that the CeO2 supported catalysts with relatively rich oxygen vacancies have a higher CO2 reaction order in both methanation and RWGS (Fig. 10). Furthermore, the H2-spillover effect is supported by the H2-TPR result where the reduction of surface CeO2 occurs at around 280 °C, significantly lower than the surface reduction temperature of pure CeO2, which is normally around 450 °C.62,93,94 This indicates that the dissociated H migrate from the metal to the metal-support interface and can hydrogenate the activated CO2.
1), which also agrees well with the previous results of activation energy. In addition, as the calculated reduction degree of CeO2 supported catalysts exceeds 100%, indicating that not only Ni and Fe were activated to the metallic state, but CeO2 was also partially reduced to CeO2−x, forming surface oxygen vacancies.91,92 The oxygen vacancies donate electrons which could participate in the adsorption and activation of CO2, explaining the reason that the CeO2 supported catalysts with relatively rich oxygen vacancies have a higher CO2 reaction order in both methanation and RWGS (Fig. 10). Furthermore, the H2-spillover effect is supported by the H2-TPR result where the reduction of surface CeO2 occurs at around 280 °C, significantly lower than the surface reduction temperature of pure CeO2, which is normally around 450 °C.62,93,94 This indicates that the dissociated H migrate from the metal to the metal-support interface and can hydrogenate the activated CO2.
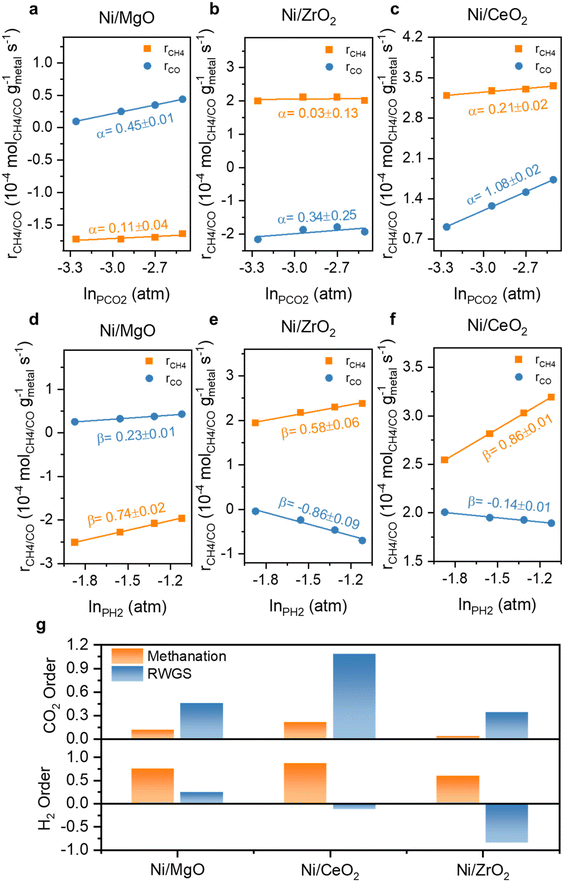 | ||
| Fig. 10 The reaction order of CO2 (α) and H2 (β) at 350 °C for Ni monometallic catalysts supported on (a) & (d) MgO, (b) & (e) ZrO2 and (c) & (f) CeO2 and (g) their comparison. | ||
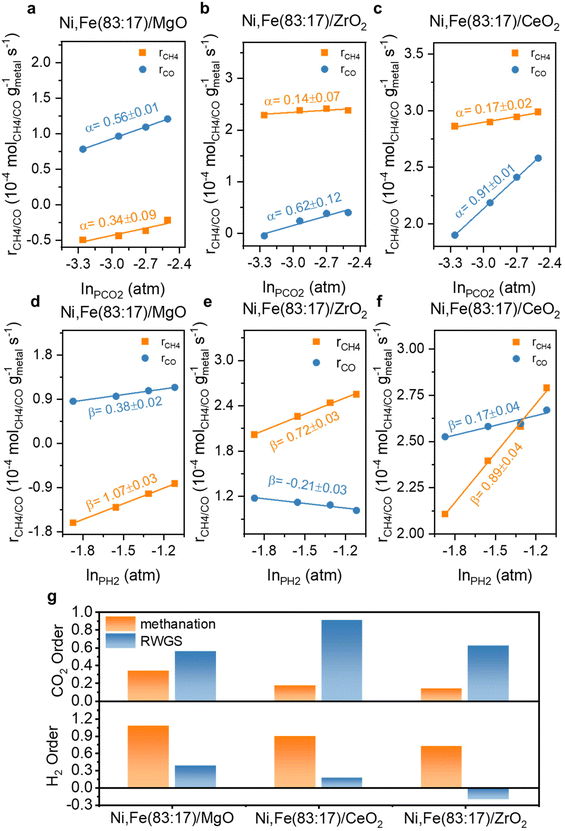 | ||
| Fig. 11 The reaction order of CO2 (α) and H2 (β) at 350 °C for Ni,Fe bimetallic catalysts supported on (a) & (d) MgO, (b) & (e) ZrO2 and (c) & (f) CeO2 and (g) their comparison. | ||
The reaction orders of CO2 and H2 for the bimetallic Ni,Fe catalysts are shown in Fig. 11. Compared to the monometallic catalysts, there was a more significant increase in both reaction orders of CO2 and H2 for methanation compared to RWGS reaction on the MgO-supported catalyst, corresponding to the higher methanation selectivity on the bimetallic catalysts (Fig. 2). For the ZrO2-supported catalyst Ni,Fe(83![[thin space (1/6-em)]](https://www.rsc.org/images/entities/char_2009.gif) :
:![[thin space (1/6-em)]](https://www.rsc.org/images/entities/char_2009.gif) 17)/ZrO2, the H2 reaction order of −0.21 in RWGS was still negative but has increased strongly from −0.86 observed in Ni/ZrO2. This less negative H2 reaction order showed that the H2-inhibition of RWGS was mitigated compared to the monometallic Ni catalyst, consistent with a lower RWGS selectivity on this bimetallic catalyst (Fig. 6b). Notably, introducing Fe to Ni/CeO2 minorly modified the reaction order of CO2 or H2 in both methanation and RWGS.
17)/ZrO2, the H2 reaction order of −0.21 in RWGS was still negative but has increased strongly from −0.86 observed in Ni/ZrO2. This less negative H2 reaction order showed that the H2-inhibition of RWGS was mitigated compared to the monometallic Ni catalyst, consistent with a lower RWGS selectivity on this bimetallic catalyst (Fig. 6b). Notably, introducing Fe to Ni/CeO2 minorly modified the reaction order of CO2 or H2 in both methanation and RWGS.
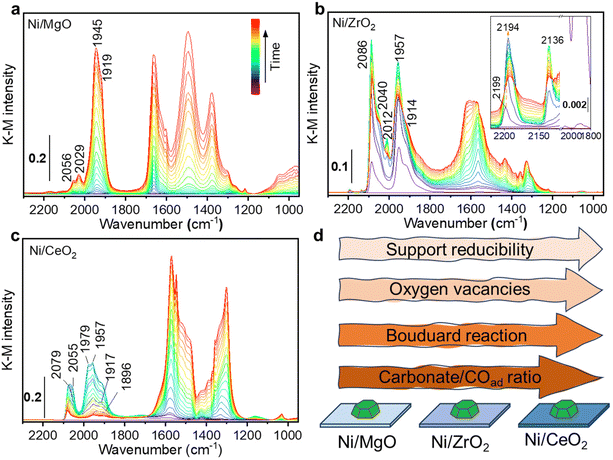
Additionally, in situ DRIFTS combined with CO as a probe were performed on the Ni monometallic catalysts to study the impact of the support on the surface properties of Ni. The formed surface species during CO adsorption can be divided in two main regions: one with spectral features above 1800 cm−1 and the other with features below 1800 cm−1. For Ni/MgO, the spectra region above 1800 cm−1 is characterized by adsorbed CO (COad) species i.e. the metal carbonyl, in particular the linear Ni0-CO species (2056 and 2029 cm−1) and the bridged (Ni0)x-CO species (1945 and 1919 cm−1).95,96 At features below 1800 cm−1, several bands can be identified as carbonate, bicarbonate, and formate species.95,97–99 The intensity of carbonaceous/carbonate-like species and COad species increased as a function of the CO adsorption time (Fig. 12a). In the desorption period (Fig. S4, ESI†), COad species gradually diminished and left a bit amount of COad adsorbed on the Ni surface while carbonate, bicarbonate, formate species region remained after 40 min of desorption.
For Ni/ZrO2, CO adsorption resulted in the formation of a very intense peak at 2086 cm−1, with a shoulder at 2040 cm−1, which was ascribed to linear Ni0-CO (Fig. 12b). At higher frequency, two tiny peaks were identified and ascribed to linear Ni2+-CO (2199–2194 cm−1) and Ni+-CO (2136 cm−1).96 Besides, the two bands at 1957 and 1914 cm−1 were ascribed to bridged (Ni0)x-CO species. In the lower frequency region below 1800 cm−1, several bands were observed and identified as carbonate and bicarbonate species, similar to Ni/MgO. During the CO adsorption, the intensity of all COad bands increased to a maximum after about 6 minutes and then started to decrease. Meanwhile, a continuous increase in the range of the carbonaceous/carbonate-like species bands was observed. This change of the intensity was interpreted as Boudouard reaction (2 CO → CO2 + C) on the active sites of Ni.100
The disproportionation of CO to carbon would result in the partial encapsulation of some Ni sites and a lower intensity for COad species. Meanwhile, the produced CO2 can be adsorbed and formed the carbonate species on the adjacent ZrO2. Note that one cannot exclude a direct CO adsorption contributing to the formation of carbonaceous/carbonate-like species as described for Ni/MgO. In the desorption process, except for the bands of ionic Nin+-CO species, almost all the bands are stable and still present during purging in He (Fig. S5, ESI†). Only the linear Ni0-CO species lost more than half of its intensity, suggesting the presence of less stable Ni0-CO species.
Regarding the Ni/CeO2 catalyst, CO adsorption led to the formation of the similar species observed for Ni/MgO: linear Ni0-CO (2079 and 2055 cm−1) and bridged (Ni0)x-CO (1979, 1957, 1917 and 1896 cm−1) species.96 Various carbonate-like species bands were observed and were ascribed to the CeO2 support in the frequency region lower than 1800 cm−1. In the CO adsorption process, similarly to the Ni/ZrO2 sample, a change of the COad species intensity was observed. This behaviour becomes even more remarkable on Ni/CeO2 than Ni/ZrO2, with a major intensity reduction that drastically reduces the intensity of all COad species. Such behaviour could be related to the stronger reducibility of CeO2 than ZrO2, which was also proved by the H2-TPR results (Fig. 4). Compared to Ni/ZrO2, more oxygen vacancies of Ni/CeO2 formed during reduction pre-treatment (proved by H2-TPR) drove a more pronounced charge transfer between Ni and reduced CeO2 (EMSI effect), resulting in a higher electron density on Ni sites in Ni/CeO2 catalyst, which leads to a more active CO disproportionation (Fig. 12d). Such concept that charge transfer from oxygen vacancies to adjacent metal sites through EMSI effect has been also demonstrated on Ru/ZrO2 catalysts both in experimental and theoretical aspects.72 Moreover, the formation of carbon layer on the top of Ni0 sites during disproportionation would inhibit the further adsorption of CO molecules. Such hypothesis is consistent with the observation that the intensity of COad species were much lower than the carbonate bands on Ni/CeO2 catalyst (Fig. 12c). During the desorption process, almost all COad species disappeared (Fig. S6, ESI†), suggesting a very labile nature of these species and influenced by a stronger electron density transferred from the reduced CeO2 support. At the same time, the carbonaceous/carbonate-like species slightly increased in intensity, indicating that some CO molecules could have been re-adsorbed to form carbonaceous/carbonate-like species after being desorbed from Ni0 sites.
4. Discussion
The support effect on the Ni,Fe bimetallic catalysts as well as Ni monometallic catalysts in CO2 hydrogenation (methanation and RWGS) studied here can be summarized and interpreted as follows:1. On a series of Ni-based (Ni,Fe) catalysts supported on non-reducible MgO, the optimum molar metal composition Ni![[thin space (1/6-em)]](https://www.rsc.org/images/entities/char_2009.gif) :
:![[thin space (1/6-em)]](https://www.rsc.org/images/entities/char_2009.gif) Fe for CO2 methanation was established to be 5
Fe for CO2 methanation was established to be 5![[thin space (1/6-em)]](https://www.rsc.org/images/entities/char_2009.gif) :
:![[thin space (1/6-em)]](https://www.rsc.org/images/entities/char_2009.gif) 1. In accordance with previous reports on the promoting role of Fe for methanation, an increase in activity and CH4 selectivity was observed, however, the selectivity around 10% at 350 °C was still low and the activity was not stable. An increased reaction order of H2 and CO2 in methanation with the addition of Fe further confirmed the promoting effect, which was not observed for the RWGS reaction.
1. In accordance with previous reports on the promoting role of Fe for methanation, an increase in activity and CH4 selectivity was observed, however, the selectivity around 10% at 350 °C was still low and the activity was not stable. An increased reaction order of H2 and CO2 in methanation with the addition of Fe further confirmed the promoting effect, which was not observed for the RWGS reaction.
2. The optimal ratio of Ni![[thin space (1/6-em)]](https://www.rsc.org/images/entities/char_2009.gif) :
:![[thin space (1/6-em)]](https://www.rsc.org/images/entities/char_2009.gif) Fe = 5
Fe = 5![[thin space (1/6-em)]](https://www.rsc.org/images/entities/char_2009.gif) :
:![[thin space (1/6-em)]](https://www.rsc.org/images/entities/char_2009.gif) 1 was further introduced to bimetallic Ni,Fe catalysts supported on CeO2 and ZrO2 and compared to monometallic counterparts to investigate the combined role of promoter and support effects for these two reducible oxides. CeO2 was the most active support for both methanation and RWGS reactions, followed by ZrO2, while MgO-supported bimetallic catalyst showed the lowest catalytic performance. This order corresponds to the reducibility of the supports suggesting metal-support interaction as origin of this effect. On these reducible supports, the presence of Fe even resulted in a bit lower methanation activity while the RWGS reaction was slightly promoted on both CeO2 and ZrO2 supported Ni,Fe catalysts. Therefore, different from the non-reducible MgO-supported catalysts, no promoting effect of Fe for methanation was observed on reducible oxides. This can be explained following the explanation of the promoting effect by Grundwaldt et al., who proposed that the redox cycle of Fe at the surface of the Ni particles helps the CO2 activation. In case of reducible oxides such as ZrO2 or CeO2 such activation of CO2 can happen on oxygen vacancies of the support, and thus no promotion on the metal surface might be required. It was shown previously that oxygen vacancies and metal-zirconia interfacial sites can promote the activation of CO2.5,34,38 Such synergistic interplay of reduced oxide sites for CO2 activation and metal sites for H2 activation can also explain the superior stability of the catalysts supported on reducible oxides as no or less carbon species or oxygen-containing coupled products are present on the metal surface leading to deactivation by coking or oxidation.
1 was further introduced to bimetallic Ni,Fe catalysts supported on CeO2 and ZrO2 and compared to monometallic counterparts to investigate the combined role of promoter and support effects for these two reducible oxides. CeO2 was the most active support for both methanation and RWGS reactions, followed by ZrO2, while MgO-supported bimetallic catalyst showed the lowest catalytic performance. This order corresponds to the reducibility of the supports suggesting metal-support interaction as origin of this effect. On these reducible supports, the presence of Fe even resulted in a bit lower methanation activity while the RWGS reaction was slightly promoted on both CeO2 and ZrO2 supported Ni,Fe catalysts. Therefore, different from the non-reducible MgO-supported catalysts, no promoting effect of Fe for methanation was observed on reducible oxides. This can be explained following the explanation of the promoting effect by Grundwaldt et al., who proposed that the redox cycle of Fe at the surface of the Ni particles helps the CO2 activation. In case of reducible oxides such as ZrO2 or CeO2 such activation of CO2 can happen on oxygen vacancies of the support, and thus no promotion on the metal surface might be required. It was shown previously that oxygen vacancies and metal-zirconia interfacial sites can promote the activation of CO2.5,34,38 Such synergistic interplay of reduced oxide sites for CO2 activation and metal sites for H2 activation can also explain the superior stability of the catalysts supported on reducible oxides as no or less carbon species or oxygen-containing coupled products are present on the metal surface leading to deactivation by coking or oxidation.
3. ZrO2-supported catalysts exhibited the highest CH4 selectivity (94.4% on Ni/ZrO2 at 350 °C). Instead of deactivation, they also showed a long activation period (∼10 h) during reaction, consistent with the slow formation of oxygen vacancies due to the moderate reducibility. Also, the kinetic parameters were standing out from the other catalysts with regard to a very high activation energy and a strongly negative reaction order of H2 for RWGS. In the context of our interpretation, this suggests that CO2 competes with H2 for the adsorption sites on the metallic Ni surface. Due to the hydrogen-rich feed stoichiometry, RWGS is inhibited by hydrogen and only little carbonaceous intermediates might be present on the Ni particles. The preferred CO2 activation on the reduced support sites on the other hand does not lead to CO pathway on the metal sites likely proceeds via formate pathway on support sites with adjacent oxygen vacancies to form methane.41,78
4. The in situ DRIFTS results demonstrate that MgO, ZrO2 and CeO2 have a strong influence on Ni active sites. More specifically, there is a clear difference in the COad species formed. The intensity ratio between carbonaceous/carbonates-like species and COad bands on each sample after steady-state CO adsorption increased with increasing of the support reducibility (Fig. 12d), which can be interpreted as the Boudouard reaction is more promoted by the presence of oxygen vacancies. Such disproportionation will result carbon layer covered on Ni and prevent the formation of COad. The other disproportionation product CO2 will then be adsorbed on the support, which is consistent with our kinetic analysis. All these findings highlight MSI in reducible oxide-supported Ni-based catalysts, which can be addressed for the difference in their catalytic performance.
5. Conclusion
In conclusion, this study has shown that the well-established promotion effect of Fe on Ni-based catalysts with similar metal loading and metal particle size is present if non-reducible MgO is used as support, which according to literature report can be traced back to facilitated CO2 activation involving Fe redox cycles. If reducible supports such as ZrO2 and CeO2 are involved, no such effect is evident. In situ DRIFTS with CO as probe and H2-TPR as well as CO2-TPD have demonstrated that the importance of MSI effect in these two supports, resulting into a new mechanism of CO2 activation on the supports and rendering a promotion on the metal surface by Fe redundant. This hypothesis is consistent with the kinetic parameters reported here, which are most pronounced on Ni/ZrO2, i.e. a large activation energy and a negative reaction order for H2 in RWGS, while the pre-factor for methanation was still large. For these reasons, Ni/ZrO2 reached the highest CH4 selectivity of 94% at 350 °C, which is accompanied by an interesting activation behavior due to the dynamic nature of the under-lying MSI. The catalysts supported on the most reducible oxide CeO2 with the richest oxygen vacancies showed the highest CO2 methanation activity.Data availability
The data supporting this article have been included as part of the ESI.†Conflicts of interest
There are no conflicts to declare.Acknowledgements
The authors wish to acknowledge the Deutsche Forschungsgemeinschaft (DFG, project no. 442614184), the Bundesministerium für Bildung und Forschung (BMBF, project no. 03HY203E), and the state of Schleswig-Holstein for funding. We thank Dr Sharif Najafi for supporting the DRIFTS measurements and the TEM center of Kiel University for the TEM investigation. We would also like to thank Mrs. Xinyi Zhang for her contribution to the article's artwork.References
- H. Blanco and A. Faaij, Renewable Sustainable Energy Rev., 2018, 81, 1049–1086 CrossRef.
- X. Ning, R. Lin, R. O’Shea, D. Wall, C. Deng, B. Wu and J. D. Murphy, iScience, 2021, 24, 102998 CrossRef PubMed.
- A. Antenucci and G. Sansavini, Renewable Sustainable Energy Rev., 2019, 100, 33–43 CrossRef.
- R. Estevez, L. Aguado-Deblas, F. M. Bautista, F. J. López-Tenllado, A. A. Romero and D. Luna, Catalysts, 2022, 12, 1555 CrossRef.
- H. Chen, H. Cui, Y. Lv, P. Liu, F. Hao and W. Xiong, Fuel, 2022, 314, 123035 CrossRef.
- R.-P. Ye, J. Ding, W. Gong, M. D. Argyle, Q. Zhong, Y. Wang, C. K. Russell, Z. Xu, A. G. Russell, Q. Li, M. Fan and Y.-G. Yao, Nat. Commun., 2019, 10, 5698 CrossRef CAS PubMed.
- L. Li, W. Zeng, M. Song, X. Wu, G. Li and C. Hu, Catalysts, 2022, 12, 244 CrossRef CAS.
- N. Diyan Mohd Ridzuan, M. S. Shaharun, M. A. Anawar and I. Ud-Din, Catalysts, 2022, 12, 469 CrossRef.
- M. A. Aziz, A. A. Jalil, N. S. Hassan, M. Bin Bahari, A. H. Hatta, T. A. T. Abdullah, N. W. C. Jusoh, H. D. Setiabudi and R. Saravanan, Process Saf. Environ. Prot., 2024, 186, 1229–1241 CrossRef CAS.
- S. Chen and A. M. Abdel-Mageed, Int. J. Hydrogen Energy, 2023, 48, 24915–24935 CrossRef CAS.
- E. Spennati, P. Riani and G. Garbarino, Catal. Today, 2023, 418, 114131 CrossRef CAS.
- M. Tawalbeh, R. M. N. Javed, A. Al-Othman and F. Almomani, Energy Convers. Manage., 2023, 279, 116755 CrossRef CAS.
- J. Sehested, K. E. Larsen, A. L. Kustov, A. M. Frey, T. Johannessen, T. Bligaard, M. P. Andersson, J. K. Nørskov and C. H. Christensen, Top. Catal., 2007, 45, 9–13 CrossRef CAS.
- Y. Feng, L. Shen, W. Zhang, X. Yuan, M. Zhu and J. Xu, J. CO2 Util., 2024, 80, 102683 CrossRef CAS.
- A. I. Tsiotsias, N. D. Charisiou, I. V. Yentekakis and M. A. Goula, Nanomaterials, 2021, 11, 28 CrossRef CAS.
- A. L. Kustov, A. M. Frey, K. E. Larsen, T. Johannessen, J. K. Nørskov and C. H. Christensen, Appl. Catal., A, 2007, 320, 98–104 CrossRef CAS.
- Z. Bian, S. Das, M. H. Wai, P. Hongmanorom and S. Kawi, ChemPhysChem, 2017, 18, 3117–3134 CrossRef CAS.
- T. Pu, J. Chen, W. Tu, J. Xu, Y.-F. Han, I. E. Wachs and M. Zhu, J. Catal., 2022, 413, 821–828 CrossRef CAS.
- J. Li, Q. Xu, Y. Han, Z. Guo, L. Zhao, K. Cheng, Q. Zhang and Y. Wang, Sci. China: Chem., 2023, 66, 3518–3524 CrossRef CAS.
- M.-A. Serrer, A. Gaur, J. Jelic, S. Weber, C. Fritsch, A. H. Clark, E. Saraçi, F. Studt and J.-D. Grunwaldt, Catal. Sci. Technol., 2020, 10, 7542–7554 RSC.
- M.-A. Serrer, K. F. Kalz, E. SaraÒ«i, H. Lichtenberg and J.-D. Grunwaldt, ChemCatChem, 2019, 11, 5018–5021 CrossRef CAS.
- B. Mutz, M. Belimov, W. Wang, P. Sprenger, M.-A. Serrer, D. Wang, P. Pfeifer, W. Kleist and J.-D. Grunwaldt, ACS Catal., 2017, 7, 6802–6814 CrossRef CAS.
- A. B. Shirsath, M. L. Schulte, B. Kreitz, S. Tischer, J.-D. Grunwaldt and O. Deutschmann, Chem. Eng. J., 2023, 469, 143847 CrossRef CAS.
- H. L. Huynh, J. Zhu, G. Zhang, Y. Shen, W. M. Tucho, Y. Ding and Z. Yu, J. Catal., 2020, 392, 266–277 CrossRef CAS.
- B. Yan, B. Zhao, S. Kattel, Q. Wu, S. Yao, D. Su and J. G. Chen, J. Catal., 2019, 374, 60–71 CrossRef CAS.
- Z. Zhang, C. Shen, K. Sun, X. Jia, J. Ye and C.-J. Liu, J. Mater. Chem. A, 2022, 10, 5792–5812 RSC.
- W. K. Fan and M. Tahir, J. Environ. Chem. Eng., 2021, 9, 105460 CrossRef.
- Q. Li, C. Wang, H. Wang, J. Chen, J. Chen and H. Jia, Angew. Chem., 2024, 136, e202318166 CrossRef.
- C. Vogt, E. Groeneveld, G. Kamsma, M. Nachtegaal, L. Lu, C. J. Kiely, P. H. Berben, F. Meirer and B. M. Weckhuysen, Nat. Catal., 2018, 1, 127–134 CrossRef.
- X. Zhou, G. A. Price, G. J. Sunley and C. Copéret, Angew. Chem., Int. Ed., 2023, 62, e202314274 CrossRef.
- W. Gac, W. Zawadzki, M. Rotko, M. Greluk, G. Słowik and G. Kolb, Catal. Today, 2020, 357, 468–482 CrossRef CAS.
- P. Frontera, A. Macario, M. Ferraro and P. Antonucci, Catalysts, 2017, 7, 59 CrossRef.
- L. P. Matte, A. S. Kilian, L. Luza, M. C. M. Alves, J. Morais, D. L. Baptista, J. Dupont and F. Bernardi, J. Phys. Chem. C, 2015, 119, 26459–26470 CrossRef CAS.
- K. Larmier, W.-C. Liao, S. Tada, E. Lam, R. Verel, A. Bansode, A. Urakawa, A. Comas-Vives and C. Copéret, Angew. Chem., Int. Ed., 2017, 56, 2318–2323 CrossRef CAS PubMed.
- R. Ye, L. Ma, X. Hong, T. R. Reina, W. Luo, L. Kang, G. Feng, R. Zhang, M. Fan and R. Zhang, Angew. Chem., 2024, 136, e202317669 CrossRef.
- Y. Ding, J. Chen, X. Lian, Z. Tian, X. Geng, Y. Wang, Y. Liu, W. Wang, M. Wang and Y. Xiao, Appl. Catal., B, 2024, 343, 123508 CrossRef.
- M. A. Abir, R. E. Phillips, J. Z. M. Harrah and M. Ball, Catal. Sci. Technol., 2024, 4506–4521 RSC.
- S. Kumari, A. N. Alexandrova and P. Sautet, J. Am. Chem. Soc., 2023, 145, 26350–26362 CrossRef.
- S. Chen, A. M. Abdel-Mageed, C. Gauckler, S. E. Olesen, I. Chorkendorff and R. J. Behm, J. Catal., 2019, 373, 103–115 CrossRef.
- Y. Bian, C. Xu, X. Wen, L. Xu, Y. Cui, S. Wang, C.-E. Wu, J. Qiu, G. Cheng and M. Chen, Fuel, 2023, 331, 125755 CrossRef CAS.
- F. Arena, G. Italiano, K. Barbera, S. Bordiga, G. Bonura, L. Spadaro and F. Frusteri, Appl. Catal., A, 2008, 350, 16–23 CrossRef CAS.
- M. Monai, K. Jenkinson, A. E. M. Melcherts, J. N. Louwen, E. A. Irmak, S. Van Aert, T. Altantzis, C. Vogt, W. van der Stam, T. Duchoň, B. Šmíd, E. Groeneveld, P. Berben, S. Bals and B. M. Weckhuysen, Science, 2023, 380, 644–651 CrossRef CAS PubMed.
- C. Wei, H. Ding, Z. Zhang, F. Lin, Y. Xu and W. Pan, Int. J. Hydrogen Energy, 2024, 58, 872–891 CrossRef CAS.
- F. Hu, C. Jin, K. H. Lim, C. Li, G. Song, Bella, T. Wang, R. Ye, Z.-H. Lu, G. Feng, R. Zhang and S. Kawi, Fuel Process. Technol., 2023, 250, 107873 CrossRef CAS.
- G. S. Dhillon, G. Cao and N. Yi, Catalysts, 2023, 13, 1171 CrossRef CAS.
- W. L. Vrijburg, J. W. A. van Helden, A. Parastaev, E. Groeneveld, E. A. Pidko and E. J. M. Hensen, Catal. Sci. Technol., 2019, 9, 5001–5010 RSC.
- M. Jafarbegloo, A. Tarlani, A. W. Mesbah, J. Muzart and S. Sahebdelfar, Catal. Lett., 2016, 146, 238–248 CrossRef CAS.
- L. Geng, B. Zheng, X. Wang, W. Zhang, S. Wu, M. Jia, W. Yan and G. Liu, ChemCatChem, 2016, 8, 805–811 CrossRef CAS.
- Y. Wei, D. Luo, L. Yan, C. Ma, Z. Fu, L. Guo, M. Cai, S. Sun and C. Zhang, Catal. Lett., 2022, 152, 1835–1843 CrossRef CAS.
- C. Mebrahtu, S. Perathoner, G. Giorgianni, S. Chen, G. Centi, F. Krebs, R. Palkovits and S. Abate, Catal. Sci. Technol., 2019, 9, 4023–4035 RSC.
- J. Li, J. Li and Q. Zhu, Chin. J. Chem. Eng., 2018, 26, 2344–2350 CrossRef CAS.
- D. Weber, T. He, M. Wong, C. Moon, A. Zhang, N. Foley, N. J. Ramer and C. Zhang, Catalysts, 2021, 11, 1447 CrossRef CAS.
- C. Janke, M. S. Duyar, M. Hoskins and R. Farrauto, Appl. Catal., B, 2014, 152, 184–191 CrossRef.
- N. L. Visser, S. J. Turner, J. A. Stewart, B. D. Vandegehuchte, J. E. S. van der Hoeven and P. E. de Jongh, ACS Nano, 2023, 17, 14963–14973 CrossRef CAS.
- P. Munnik, M. E. Z. Velthoen, P. E. de Jongh, K. P. de Jong and C. J. Gommes, Angew. Chem., 2014, 126, 9647–9651 CrossRef.
- M. Mihaylov, K. Hadjiivanov and H. Knözinger, Catal. Lett., 2001, 76, 59–63 CrossRef.
- M. Agnelli, H. M. Swaan, C. Marquez-Alvarez, G. A. Martin and C. Mirodatos, J. Catal., 1998, 175, 117–128 CrossRef.
- N. Liu, J. Wei, J. Xu, Y. Yu, J. Yu, Y. Han, K. Wang, J. I. Orege, Q. Ge and J. Sun, Appl. Catal., B, 2023, 328, 122476 CrossRef.
- L. Li, B. Jiang, D. Tang, Z. Zheng and C. Zhao, Catalysts, 2018, 8, 257 CrossRef.
- W. Yu, Q. Zhou, H. Wang, Y. Liu, W. Chu, R. Cai and W. Yang, J. Mater. Sci., 2020, 55, 2321–2332 CrossRef CAS.
- X. Zhang, R. You, D. Li, T. Cao and W. Huang, ACS Appl. Mater. Interfaces, 2017, 9, 35897–35907 CrossRef CAS PubMed.
- Y. Gao, R. Li, S. Chen, L. Luo, T. Cao and W. Huang, Phys. Chem. Chem. Phys., 2015, 17, 31862–31871 RSC.
- W. Zheng, J. Zhang, Q. Ge, H. Xu and W. Li, Appl. Catal., B, 2008, 80, 98–105 CrossRef CAS.
- T. Takeguchi, S.-N. Furukawa and M. Inoue, J. Catal., 2001, 202, 14–24 CrossRef CAS.
- C. Li, Y. Shi, Z. Zhang, J. Ni, X. Wang, J. Lin, B. Lin and L. Jiang, J. Energy Chem., 2021, 60, 403–409 CrossRef CAS.
- K. Chang, H. Zhang, M.-J. Cheng and Q. Lu, ACS Catal., 2020, 10, 613–631 CrossRef.
- M. Carltonbird, S. Eaimsumang, S. Pongstabodee, S. Boonyuen, S. M. Smith and A. Luengnaruemitchai, Chem. Eng. J., 2018, 344, 545–555 CrossRef.
- X. Li, X. Liu, J. Hao, L. Li, Y. Gao, Y. Gu, Z. Cao and J. Liu, ACS Omega, 2022, 7, 24646–24655 CrossRef.
- A. Parastaev, V. Muravev, E. Huertas Osta, A. J. F. van Hoof, T. F. Kimpel, N. Kosinov and E. J. M. Hensen, Nat. Catal., 2020, 3, 526–533 CrossRef.
- L. R. Winter, E. Gomez, B. Yan, S. Yao and J. G. Chen, Appl. Catal., B, 2018, 224, 442–450 CrossRef.
- B. Miao, S. S. K. Ma, X. Wang, H. Su and S. H. Chan, Catal. Sci. Technol., 2016, 6, 4048–4058 RSC.
- S. Chen, A. M. Abdel-Mageed, M. Li, S. Cisneros, J. Bansmann, J. Rabeah, A. Brückner, A. Groß and R. J. Behm, J. Catal., 2021, 400, 407–420 CrossRef.
- X. Jia, X. Zhang, N. Rui, X. Hu and C.-J. Liu, Appl. Catal., B, 2019, 244, 159–169 CrossRef.
- Z. Cheng, B. J. Sherman and C. S. Lo, J. Chem. Phys., 2013, 138, 014702 CrossRef PubMed.
- K. Lorber, J. Zavašnik, I. Arčon, M. Huš, J. Teržan, B. Likozar and P. Djinović, ACS Appl. Mater. Interfaces, 2022, 14, 31862–31878 CrossRef CAS PubMed.
- N. Rui, X. Zhang, F. Zhang, Z. Liu, X. Cao, Z. Xie, R. Zou, S. D. Senanayake, Y. Yang, J. A. Rodriguez and C.-J. Liu, Appl. Catal., B, 2021, 282, 119581 CrossRef CAS.
- T. Zhang, W. Wang, F. Gu, W. Xu, J. Zhang, Z. Li, T. Zhu, G. Xu, Z. Zhong and F. Su, Appl. Catal., B, 2022, 312, 121385 CrossRef CAS.
- K. Li and J. G. Chen, ACS Catal., 2019, 9, 7840–7861 CrossRef CAS.
- J. I. Di Cosimo, C. R. Apesteguía, M. J. L. Ginés and E. Iglesia, J. Catal., 2000, 190, 261–275 CrossRef CAS.
- D. Wierzbicki, R. Baran, R. Dębek, M. Motak, T. Grzybek, M. E. Gálvez and P. Da Costa, Int. J. Hydrogen Energy, 2017, 42, 23548–23555 CrossRef CAS.
- P. Summa, M. Gajewska, L. Li, C. Hu, B. Samojeden, M. Motak and P. Da Costa, J. CO2 Util., 2022, 60, 101983 CrossRef CAS.
- N. J. A. Rahman, A. Ramli, K. Jumbri and Y. Uemura, Sci. Rep., 2019, 9, 16223 CrossRef PubMed.
- Z. Ni, X. Djitcheu, X. Gao, J. Wang, H. Liu and Q. Zhang, Sci. Rep., 2022, 12, 5344 CrossRef CAS.
- W. Liao, C. Tang, H. Zheng, J. Ding, K. Zhang, H. Wang, J. Lu, W. Huang and Z. Zhang, J. Catal., 2022, 407, 126–140 CrossRef CAS.
- Y. Wang, H. Ban, Y. Wang, R. Yao, S. Zhao, J. Hu and C. Li, J. Catal., 2024, 430, 115357 CrossRef CAS.
- S. Lin, Z. Li and M. Li, Fuel, 2023, 333, 126369 CrossRef CAS.
- M. B. Jensen, L. G. M. Pettersson, O. Swang and U. Olsbye, J. Phys. Chem. B, 2005, 109, 16774–16781 CrossRef CAS PubMed.
- D. Cornu, H. Guesmi, J.-M. Krafft and H. Lauron-Pernot, J. Phys. Chem. C, 2012, 116, 6645–6654 CrossRef CAS.
- R. Ye, L. Ma, X. Hong, T. R. Reina, W. Luo, L. Kang, G. Feng, R. Zhang, M. Fan, R. Zhang and J. Liu, Angew. Chem., 2024, 136, e202317669 CrossRef.
- Y. Yang, Z. Chai, X. Qin, Z. Zhang, A. Muhetaer, C. Wang, H. Huang, C. Yang, D. Ma, Q. Li and D. Xu, Angew. Chem., Int. Ed., 2022, 61, e202200567 CrossRef PubMed.
- I. Hussain, G. Tanimu, S. Ahmed, C. U. Aniz, H. Alasiri and K. Alhooshani, Int. J. Hydrogen Energy, 2023, 48, 24663–24696 CrossRef.
- B. M. Tackett, E. Gomez and J. G. Chen, Nat. Catal., 2019, 2, 381–386 CrossRef.
- A. Beck, D. Kazazis, Y. Ekinci, X. Li, E. A. Müller Gubler, A. Kleibert, M.-G. Willinger, L. Artiglia and J. A. van Bokhoven, ACS Nano, 2023, 17, 1091–1099 CrossRef.
- C. Ren, R. Yang, Y. Li and H. Wang, Rev. Chem. Intermed., 2019, 45, 3019–3032 CrossRef CAS.
- G. Martra, F. Arena, M. Baricco, S. Coluccia, L. Marchese and A. Parmaliana, Catal. Today, 1993, 17, 449–458 CrossRef CAS.
- K. I. Hadjiivanov and G. N. Vayssilov, in Advances in Catalysis, Academic Press, 2002, 47, pp. 307–511 Search PubMed.
- G. Busca and V. Lorenzelli, Mater. Chem., 1982, 7, 89–126 CrossRef CAS.
- S. Chen, T. Cao, Y. Gao, D. Li, F. Xiong and W. Huang, J. Phys. Chem. C, 2016, 120, 21472–21485 CrossRef CAS.
- S. Chen, L. Luo, Z. Jiang and W. Huang, ACS Catal., 2015, 5, 1653–1662 CrossRef CAS.
- M. B. Jensen, S. Morandi, F. Prinetto, A. O. Sjåstad, U. Olsbye and G. Ghiotti, Catal. Today, 2012, 197, 38–49 CrossRef.
Footnote |
| † Electronic supplementary information (ESI) available. See DOI: https://doi.org/10.1039/d4nr02025a |
| This journal is © The Royal Society of Chemistry 2024 |

