DOI:
10.1039/D0MA00251H
(Paper)
Mater. Adv., 2020,
1, 880-890
Cation distribution, magnetic and hyperfine interaction studies of Ni–Zn spinel ferrites: role of Jahn Teller ion (Cu2+) substitution
Received
28th April 2020
, Accepted 15th June 2020
First published on 15th June 2020
Abstract
This study reports cation distribution, magnetic, and hyperfine interaction studies of Cu2+-substituted mixed Ni–Zn nano-spinel ferrites prepared by combustion technique. X-ray diffraction and electron microscopy were used to study the structural and morphological aspects of all the samples. Rietveld refined diffraction patterns exhibited a cubic-spinel lattice structure with the Fd3m space group for all the samples. Morphological investigations revealed the spherical morphology of particles with some agglomeration. The magnetic properties investigated at 300 K and 5 K implied a soft ferromagnetic character of all the samples. The magnetization at 5 K progressively enhanced due to surface effects. Field-cooled and zero-field-cooled measurements indicated net irreversibility for all the samples. Hyperfine interaction studies revealed the ferrimagnetic nature of Cu2+-substituted mixed Ni–Zn spinel nano-ferrites. All the obtained results show that the prepared nanoparticles are useful for magnetic fluid hyperthermia and other bio-applications.
1. Introduction
The new progression of the materials science area in the nano-level has now promoted the utilization of synthesized nanomaterials in real-world applications. Ferrite materials in nano-scale are one of the competing candidates that have attracted applications in many technological areas. Spinel ferrites in nano-form are the prime members of ferrite materials, which are the main interest of scientists and technologists. Based on their chemical composition, spinel ferrites can be generalized as ‘MIIFe2O4’, where MII represents divalent metal ions such as Zn2+, Mg2+, Co2+, and Ni2+. The lattice structure of spinel ferrites is divided into two sub-lattices or intrinsic sites. It has many vital features including magnetic and electrical duality, high stability, and super-paramagnetic appearance. Owing to these critical features, spinel ferrites can be employed in different areas such as in sensing units, microwave absorbing devices, communication antennas, memory storage chips, medical diagnostics and imaging, photocatalysis, magnetic switching devices, and bio-treatments1–5 and as catalysts and magneto-rheological fluids. The unusual magnetic and electrical parameters of spinel nano-ferrites depend on the method of preparation, optimization of synthesis parameters, composition, annealing temperature,6–9etc. In literature, a number of studies have been reported on the physical as well as chemical synthesis techniques of spinel nano-ferrites.10–15
Recently, mixed-type Ni–Cu–Zn nano-ferrites have attracted the interest of scientists for technological as well as electronic applications. In the Ni–Cu–Zn nano-ferrites, the substitution of elements in a proper amount leads to magnetic enhancement, wherein nature of substituted dopant determines the association among magnetic interface. Furthermore, the effects of the variation in particle size and surface spin on the magnetic properties are highlighted.16 As is well-known, nano-sized particles cause spin canting. Thus, the net magnetic exchange interactions lead to Neél's and Y–K types of magnetic parameters.17,18
Meanwhile, the substitution of diamagnetic ions in a controlled manner is known to be beneficial for the enhancement of the magnetic properties of ferrites. The presence of a diamagnetic cation above the specified limit results in the non-collinearity of spins. In addition to this, magnetic anisotropy affects the superparamagnetic behavior in nanodomains. Hence, it is essential to understand the magnetism of diamagnetic ions and its correlation with various properties in nanodomains. The investigation of the doping of Cu2+ into these nano-ferrites may provide new insights into the impact of Cu2+ doping on the structural, morphological, magnetic, and Mössbauer features of these nano-ferrites. A literature survey of copper-substituted Ni–Zn mixed ferrites revealed enhancement in the premium properties of ferrites.19–22 Using VSM and Mössbauer spectroscopy, saturation magnetization, cation distribution, superparamagnetism, and the Curie temperature and local environment of Fe ions can be well understood.
The present study reports the citrate-nitrate synthesis of Cu2+-incorporated mixed Ni–Zn nano-ferrites. It focuses on the investigation of the structural properties of these nano-ferrites by Rietveld analysis, magnetic studies at 300 K and 5 K, and FC-ZFC analysis and examination of hyperfine parameters by Mössbauer spectroscopy. This study also reports the comprehensive impact of Cu2+ ion concentration on these properties.
2. Experimental details
The nitrate-citrate route was employed to prepare Cu2+-incorporated Ni–Zn mixed nano-ferrite samples having the generic formula Ni0.70−xCuxZn0.30Fe2O4 (x = 0.00, 0.05, 0.15, and 0.25). Nitrate in a weighed amount for each composition and citric acid were separately dissolved in 50 ml DI H2O. The metal nitrate to citric acid ratio calculated using propellant chemistry was 1![[thin space (1/6-em)]](https://www.rsc.org/images/entities/char_2009.gif) :3. The pH of the mixed solution of nitrates and citric acid was adjusted at seven by adding an ammonium solution. Then, the combined solution was continuously stirred on a hot plate at 90 °C until it transformed into a gel. After the gelation of the sol, the thermal temperature was increased to 115 °C. All the water molecules evaporated from the viscous gel, which burnt with glowing flints to form a loose powder. The as-prepared powder was ground using agate pestle mortar and annealed at 600 °C for 6 h to achieve good crystallites. Fig. 1 and 2 display the schematic of the sol–gel auto-combustion technique and the mechanism of the chemical synthesis of NiCuZn ferrite, respectively. In the schematic of the mechanism, the gases liberated are not shown. The specified mechanism was compared with that proposed for the preparation of nanocrystalline spinel ferrites using the sol–gel auto-combustion technique.23
:3. The pH of the mixed solution of nitrates and citric acid was adjusted at seven by adding an ammonium solution. Then, the combined solution was continuously stirred on a hot plate at 90 °C until it transformed into a gel. After the gelation of the sol, the thermal temperature was increased to 115 °C. All the water molecules evaporated from the viscous gel, which burnt with glowing flints to form a loose powder. The as-prepared powder was ground using agate pestle mortar and annealed at 600 °C for 6 h to achieve good crystallites. Fig. 1 and 2 display the schematic of the sol–gel auto-combustion technique and the mechanism of the chemical synthesis of NiCuZn ferrite, respectively. In the schematic of the mechanism, the gases liberated are not shown. The specified mechanism was compared with that proposed for the preparation of nanocrystalline spinel ferrites using the sol–gel auto-combustion technique.23
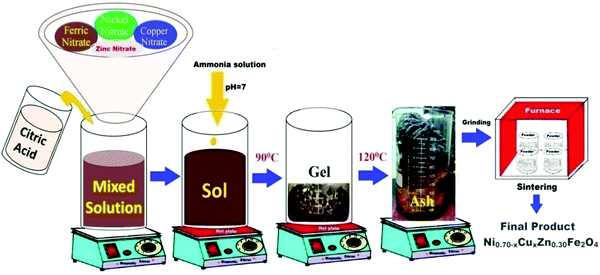 |
| | Fig. 1 Schematic of the nitrate-citrate route employed to synthesize Ni0.70−xCuxZn0.30Fe2O4 (x = 0.00, 0.05, 0.15, and 0.25). | |
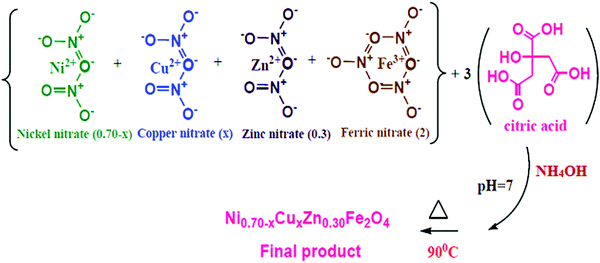 |
| | Fig. 2 Schematic of the mechanism of the Ni0.70−xCuxZn0.30Fe2O4 (x = 0.00, 0.05, 0.15, and 0.25) synthesis. | |
An X-ray diffractometer (PANalytical X’Pert Pro) with Cu-Kα X-ray radiation (λ = 1.5409 Å) was employed to obtain structural information of the prepared samples. A high-resolution transmission electron microscope (Philips-Tecnai G2, F30) operating at an accelerated voltage of 300 kV was used to investigate the morphology of the samples. Its magnification is in the range from 58x to 1 million x with the resolutions of 2 Å (point) and 1 Å (line). A vibrating sample magnetometer was employed to acquire M–H plots at 300 K and 5 K as a function of an applied magnetic field of ±10 kOe. Furthermore, the field-cooled (FC) and zero-Field-cooled (ZFC) measurements of each sample were performed in the temperature range of 5–350 K at 500 Oe. Moreover, a Mössbauer spectrometer (FAST ComTec 070906) was employed for the Mössbauer analysis of the Ni–Cu–Zn nano-ferrite samples. The Mössbauer spectrum of each sample was analyzed using the MossWinn 4.0 program.
3. Results and discussion
3.1 Rietveld analysis
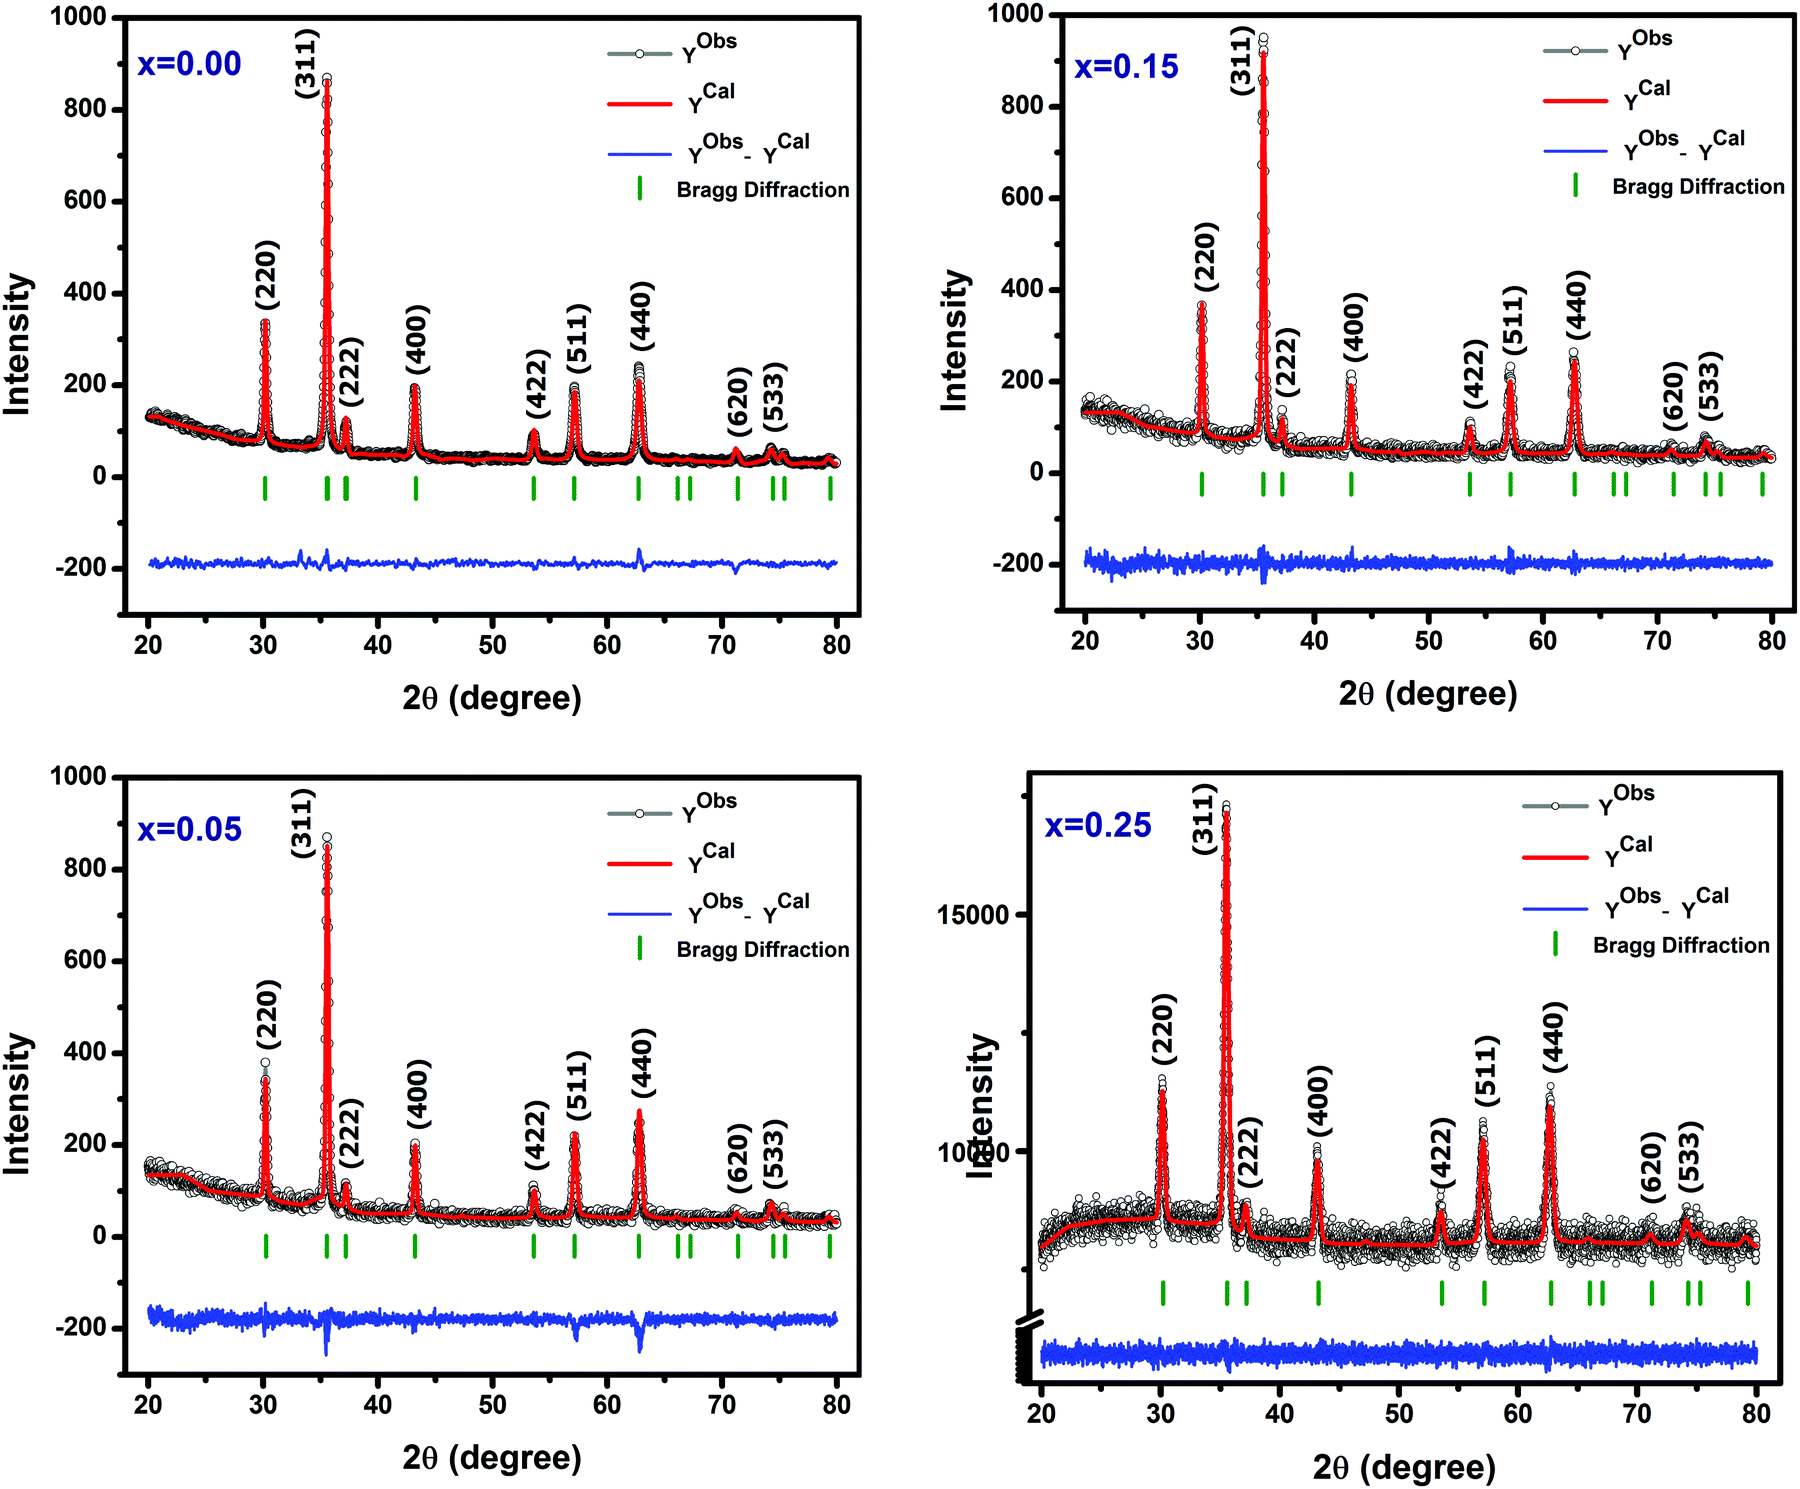
The XRD patterns of Ni–Cu–Zn spinel ferrite nanoparticles fitted with Rietveld refinement using the Fullprof program are shown in Fig. 3. The experimentally obtained XRD patterns almost coincide with the calculated XRD patterns. Thus, the difference between them is remarkably small. The solid circle line (black colored) denotes the experimental data, whereas the solid lines (red colored) indicate the calculated intensities. The vertical lines imply the allowed Bragg's position, and the baseline (blue colored) indicates the dissimilarity between the experimental and the calculated intensities. The observed structure favours the single-phase structure since no detectable impurity was found. The profile parameters obtained from the fitted patterns for all the samples are presented in Table 1 and indicate that the refinement is reliable. In the powder XRD patterns, nine peaks are clearly observed, which were indexed to the (220), (311), (222), (400), (422), (511), (440), (620), and (533) Miller indices. The average crystallite size, as presented in Table 1, varies between 22 and 34 nm. The lattice parameters show an increasing trend with an increase in the amount of copper substitution (Table 1). This phenomenon is attributed to the enhancement in lattice expansion caused by the substitution of the large Cu2+ (0.074 nm) ion for the comparatively small Ni2+ (0.069 nm) ion.
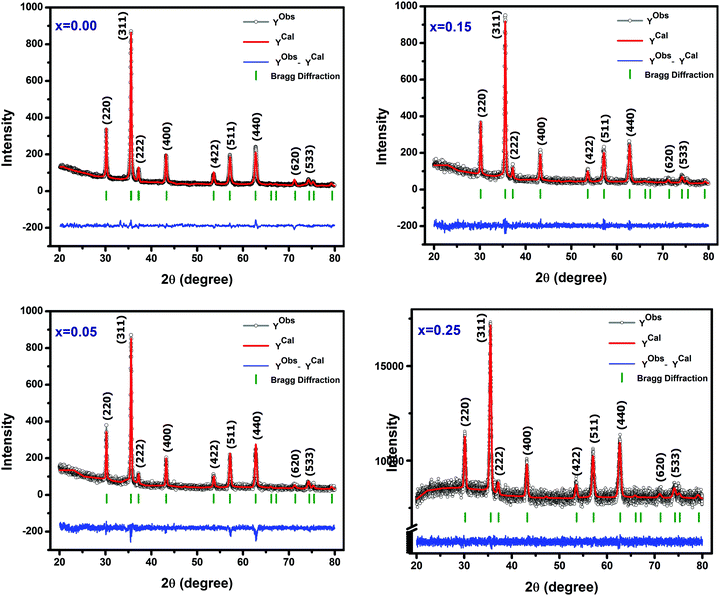 |
| | Fig. 3 Rietveld refined XRD patterns of Ni0.70−xCuxZn0.30Fe2O4 (x = 0.00, 0.05, 0.15, and 0.25). | |
Table 1 Goodness-of-fit (χ2), profile reliability index (Rp), weighted profile reliability index, (Rwp), lattice parameter (a), average crystallite size (D), and average particle size (t) for Ni0.70−xZn0.30Fe2O4 nanoparticles
| Comp. x |
χ
2
|
R
p
|
R
wp
|
R
exp
|
a (Å) |
D
XRD (nm) |
t
TEM (nm) |
| 0.00 |
1.02 |
11.20 |
10.98 |
12.0 |
8.359 |
29 |
24 |
| 0.05 |
1.01 |
12.32 |
12.21 |
9.33 |
8.368 |
30 |
25 |
| 0.15 |
1.04 |
12.27 |
11.80 |
8.04 |
8.376 |
34 |
45 |
| 0.25 |
2.18 |
2.63 |
1.78 |
1.93 |
8.386 |
28 |
— |
3.2 HR-TEM analysis
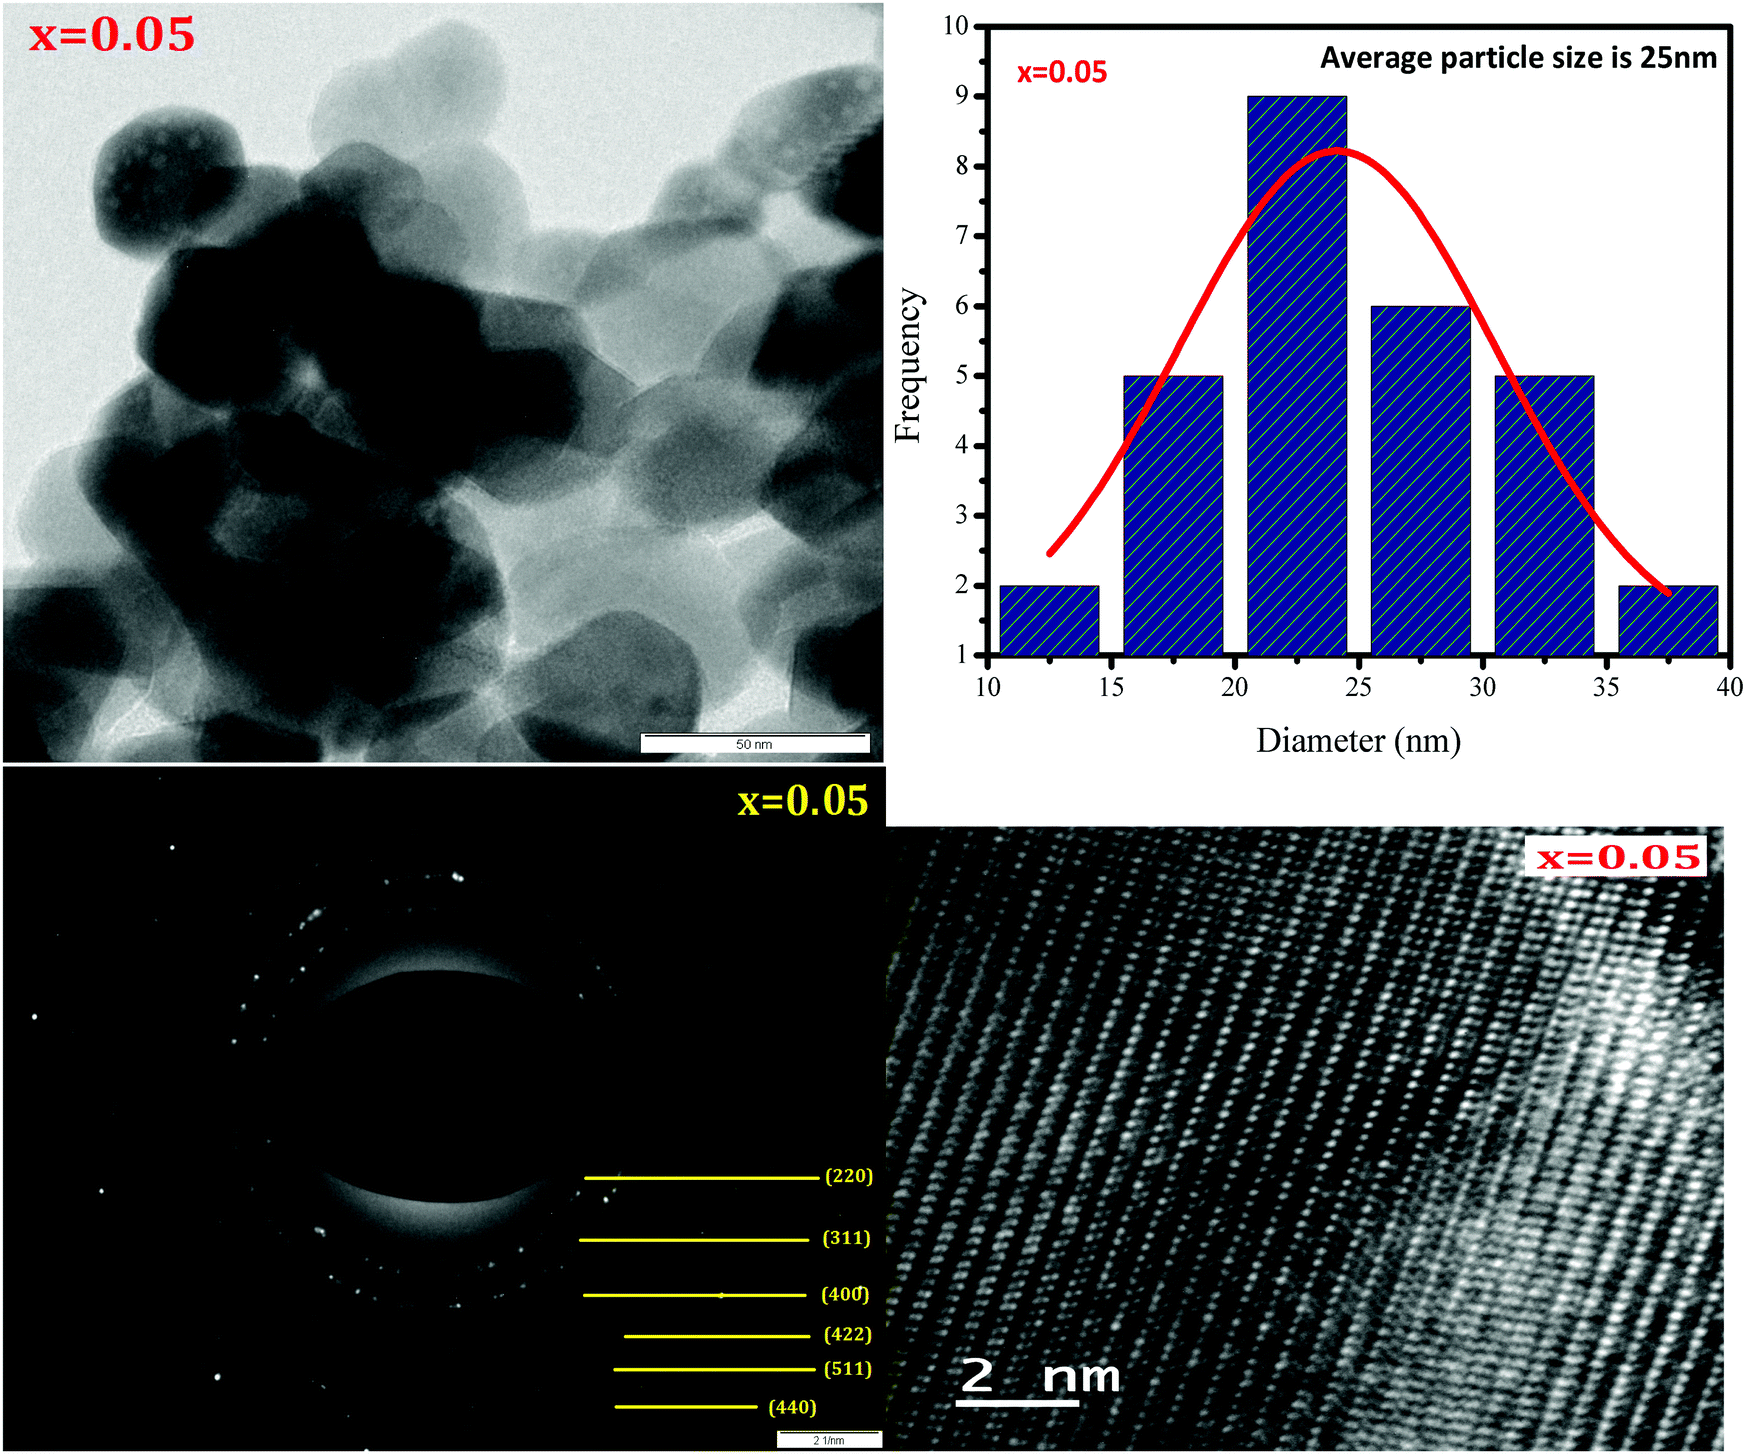
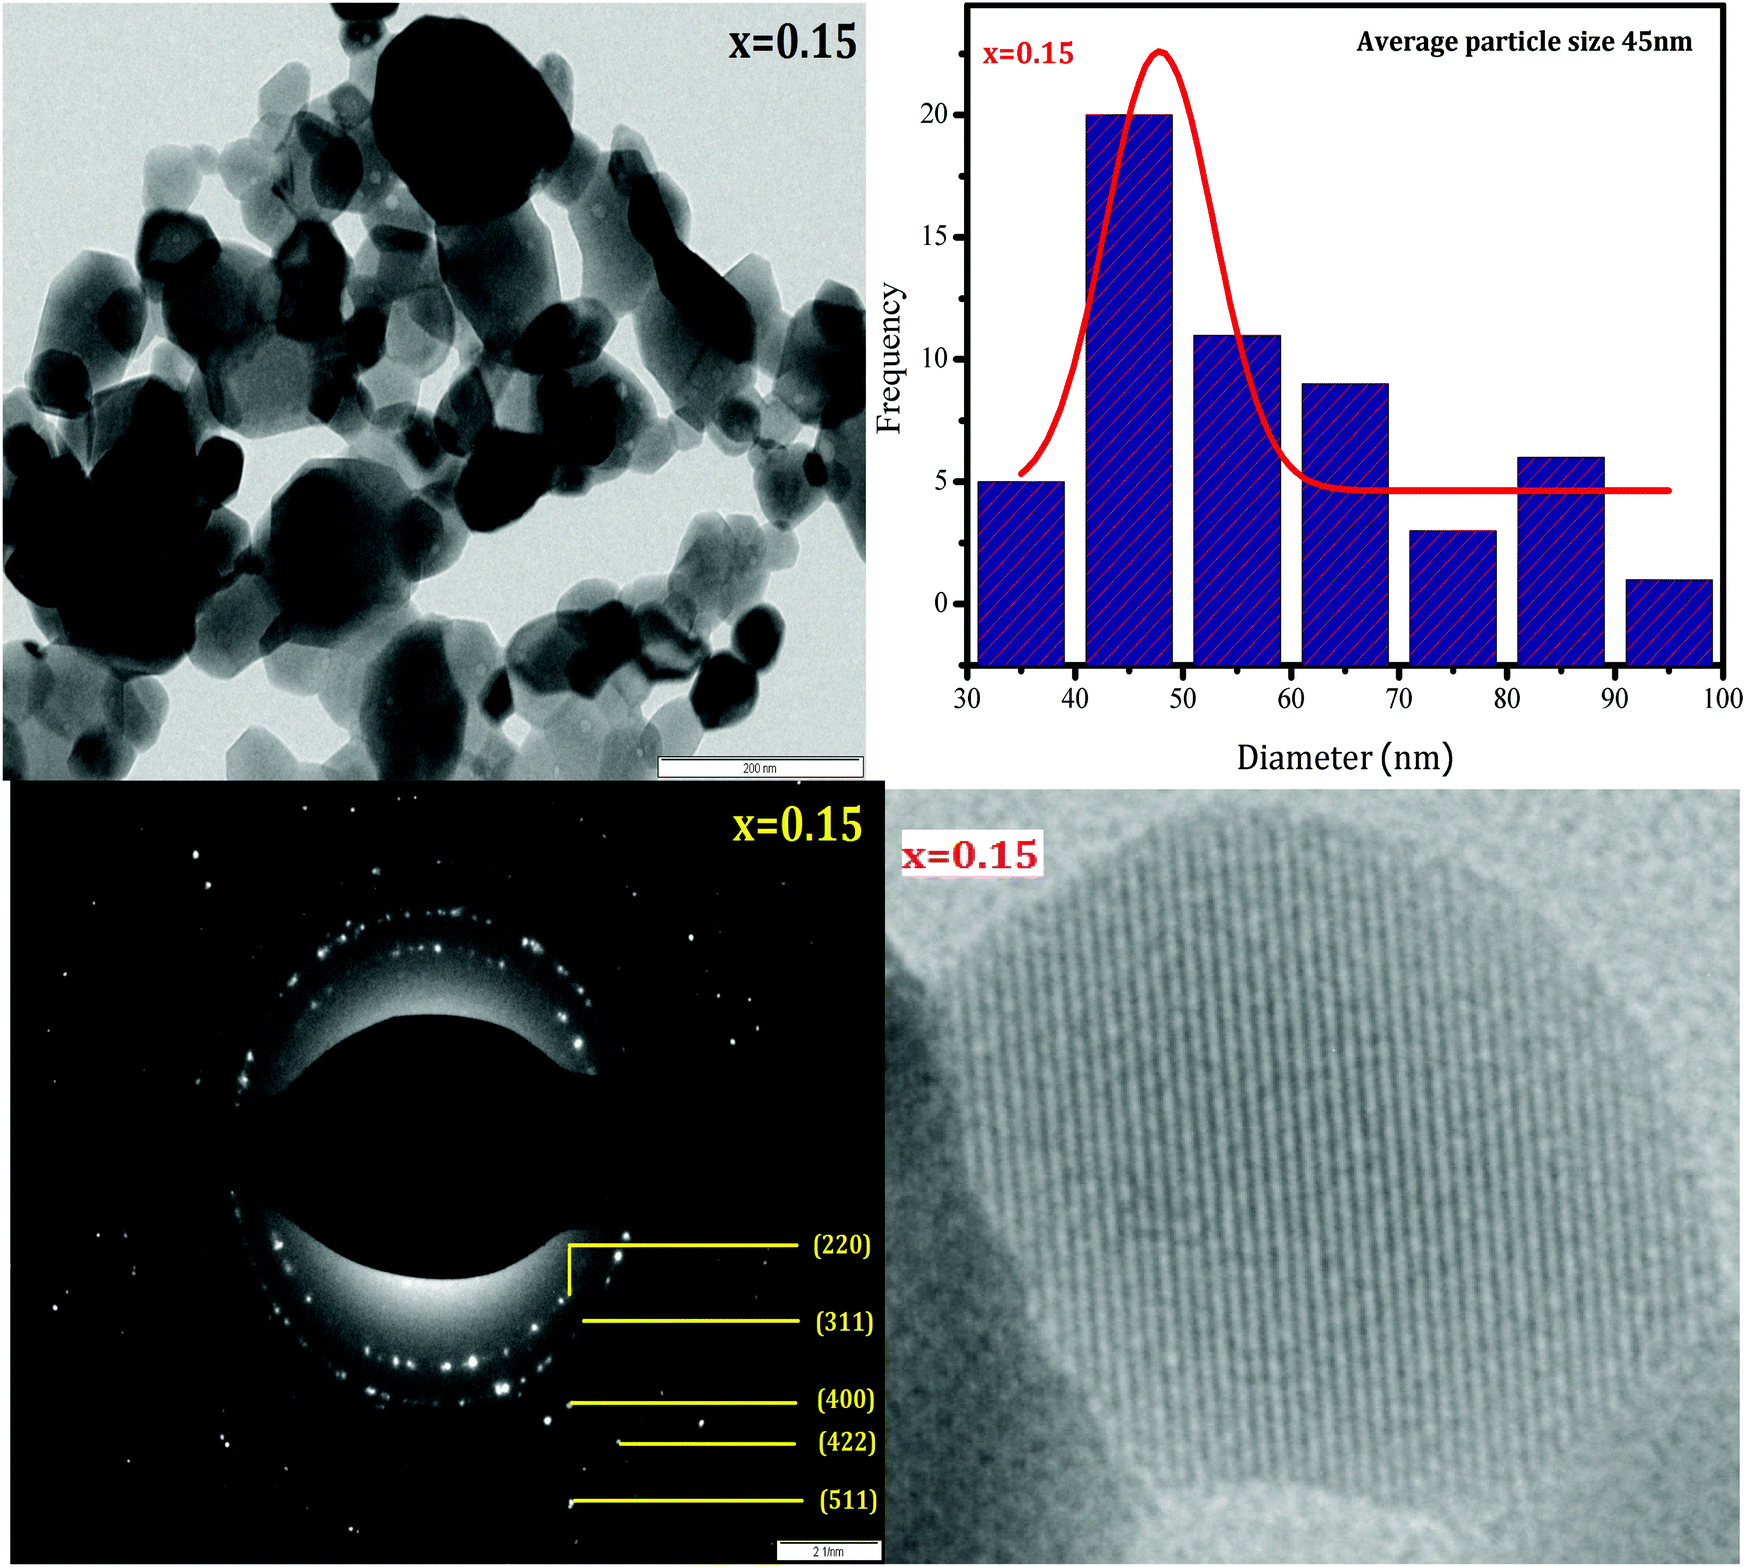
HR-TEM was employed to study the morphologies and spinel phases of typical Ni–Cu–Zn nano-ferrite samples (x = 0.00, 0.05, and 0.15), and the HR-TEM images are shown in Fig. 4–6. The TEM images show the presence of separated as well as agglomerated particles on some level. The inter-magnetic interface between particles is the main reason for this agglomeration. A similar result is reported for spinel ferrite materials.24 The values of the average particle size deduced from the TEM images are in the range of 24–45 nm. The SAED patterns show diffraction rings corresponding to the spinel-cubic lattice. Moreover, the absence of other diffraction rings or dots belonging to any different phase indicates high crystallinity of the prepared Ni–Cu–Zn spinel ferrites. The HR-TEM images (Fig. 4–6) feature visible fringes with the d-spacings of 0.18 nm, 0.18 nm, and 0.24 nm for each sample, corresponding to the (422), (422) and (222), and (220) and (422) planes of a cubic phase for x = 0.00, 0.05, and 0.15. Furthermore, this shows that the nanoparticles are well-crystallized. The lattice image of a single grain shows equally spaced lattice rows, which signify that the region is well-crystalline and free from any lattice defects. It can be treated as a coherent diffraction domain, as revealed by the X-ray diffraction analysis results. The HR-TEM images obtained herein are analogous to those of the NiCuZn spinel ferrite nanoparticles prepared using a coprecipitation synthesis technique.25
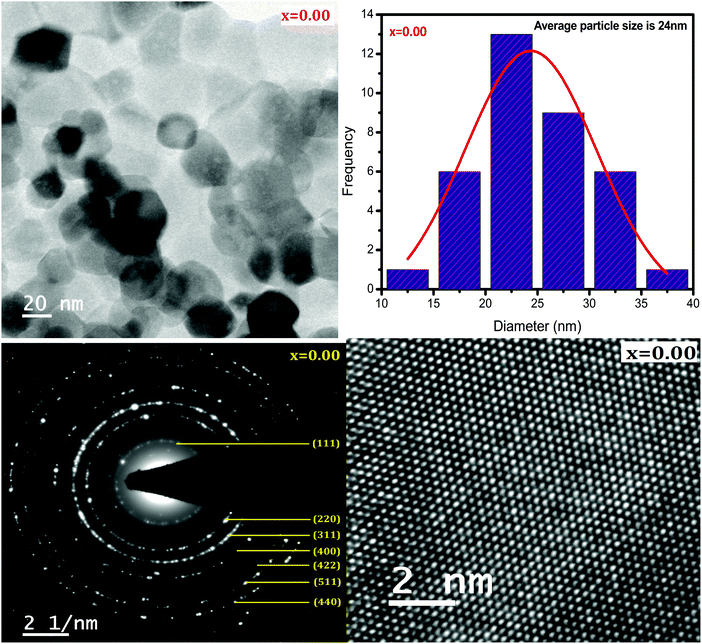 |
| | Fig. 4 TEM image, particle size distribution, SAED pattern, and HR-TEM image of Ni0.70−xCuxZn0.30Fe2O4 (x = 0.00). | |
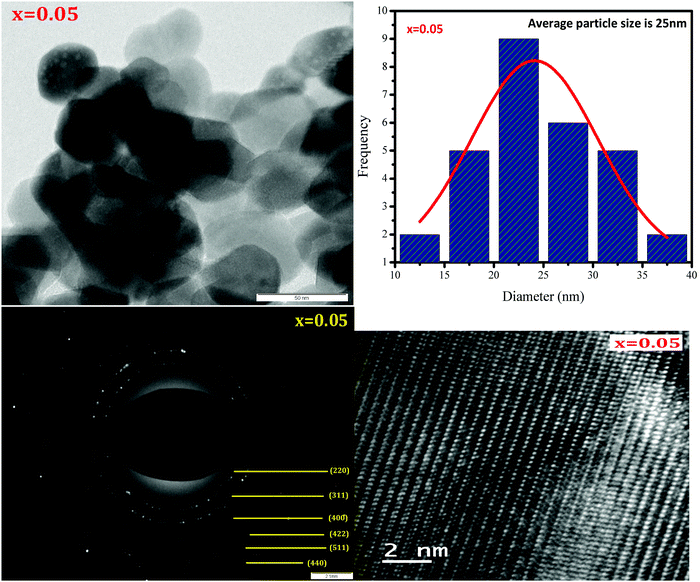 |
| | Fig. 5 TEM image, particle size distribution, SAED pattern, and HR-TEM image of Ni0.70−xCuxZn0.30Fe2O4 (x = 0.05). | |
 |
| | Fig. 6 TEM image, particle size distribution, SAED pattern, and HR-TEM image of Ni0.70−xCuxZn0.30Fe2O4 (x = 0.15). | |
3.3 VSM analysis
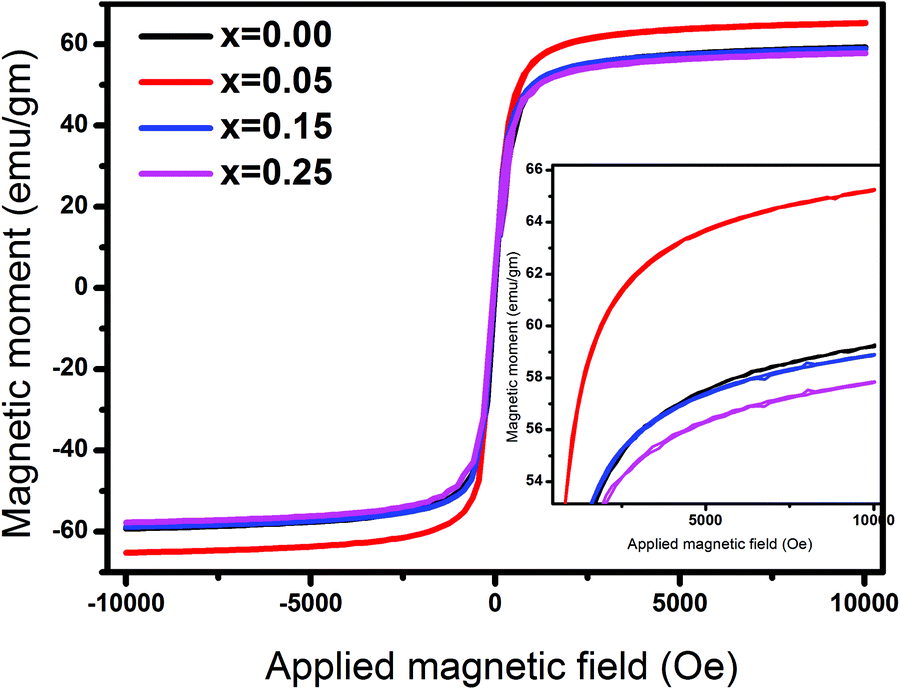
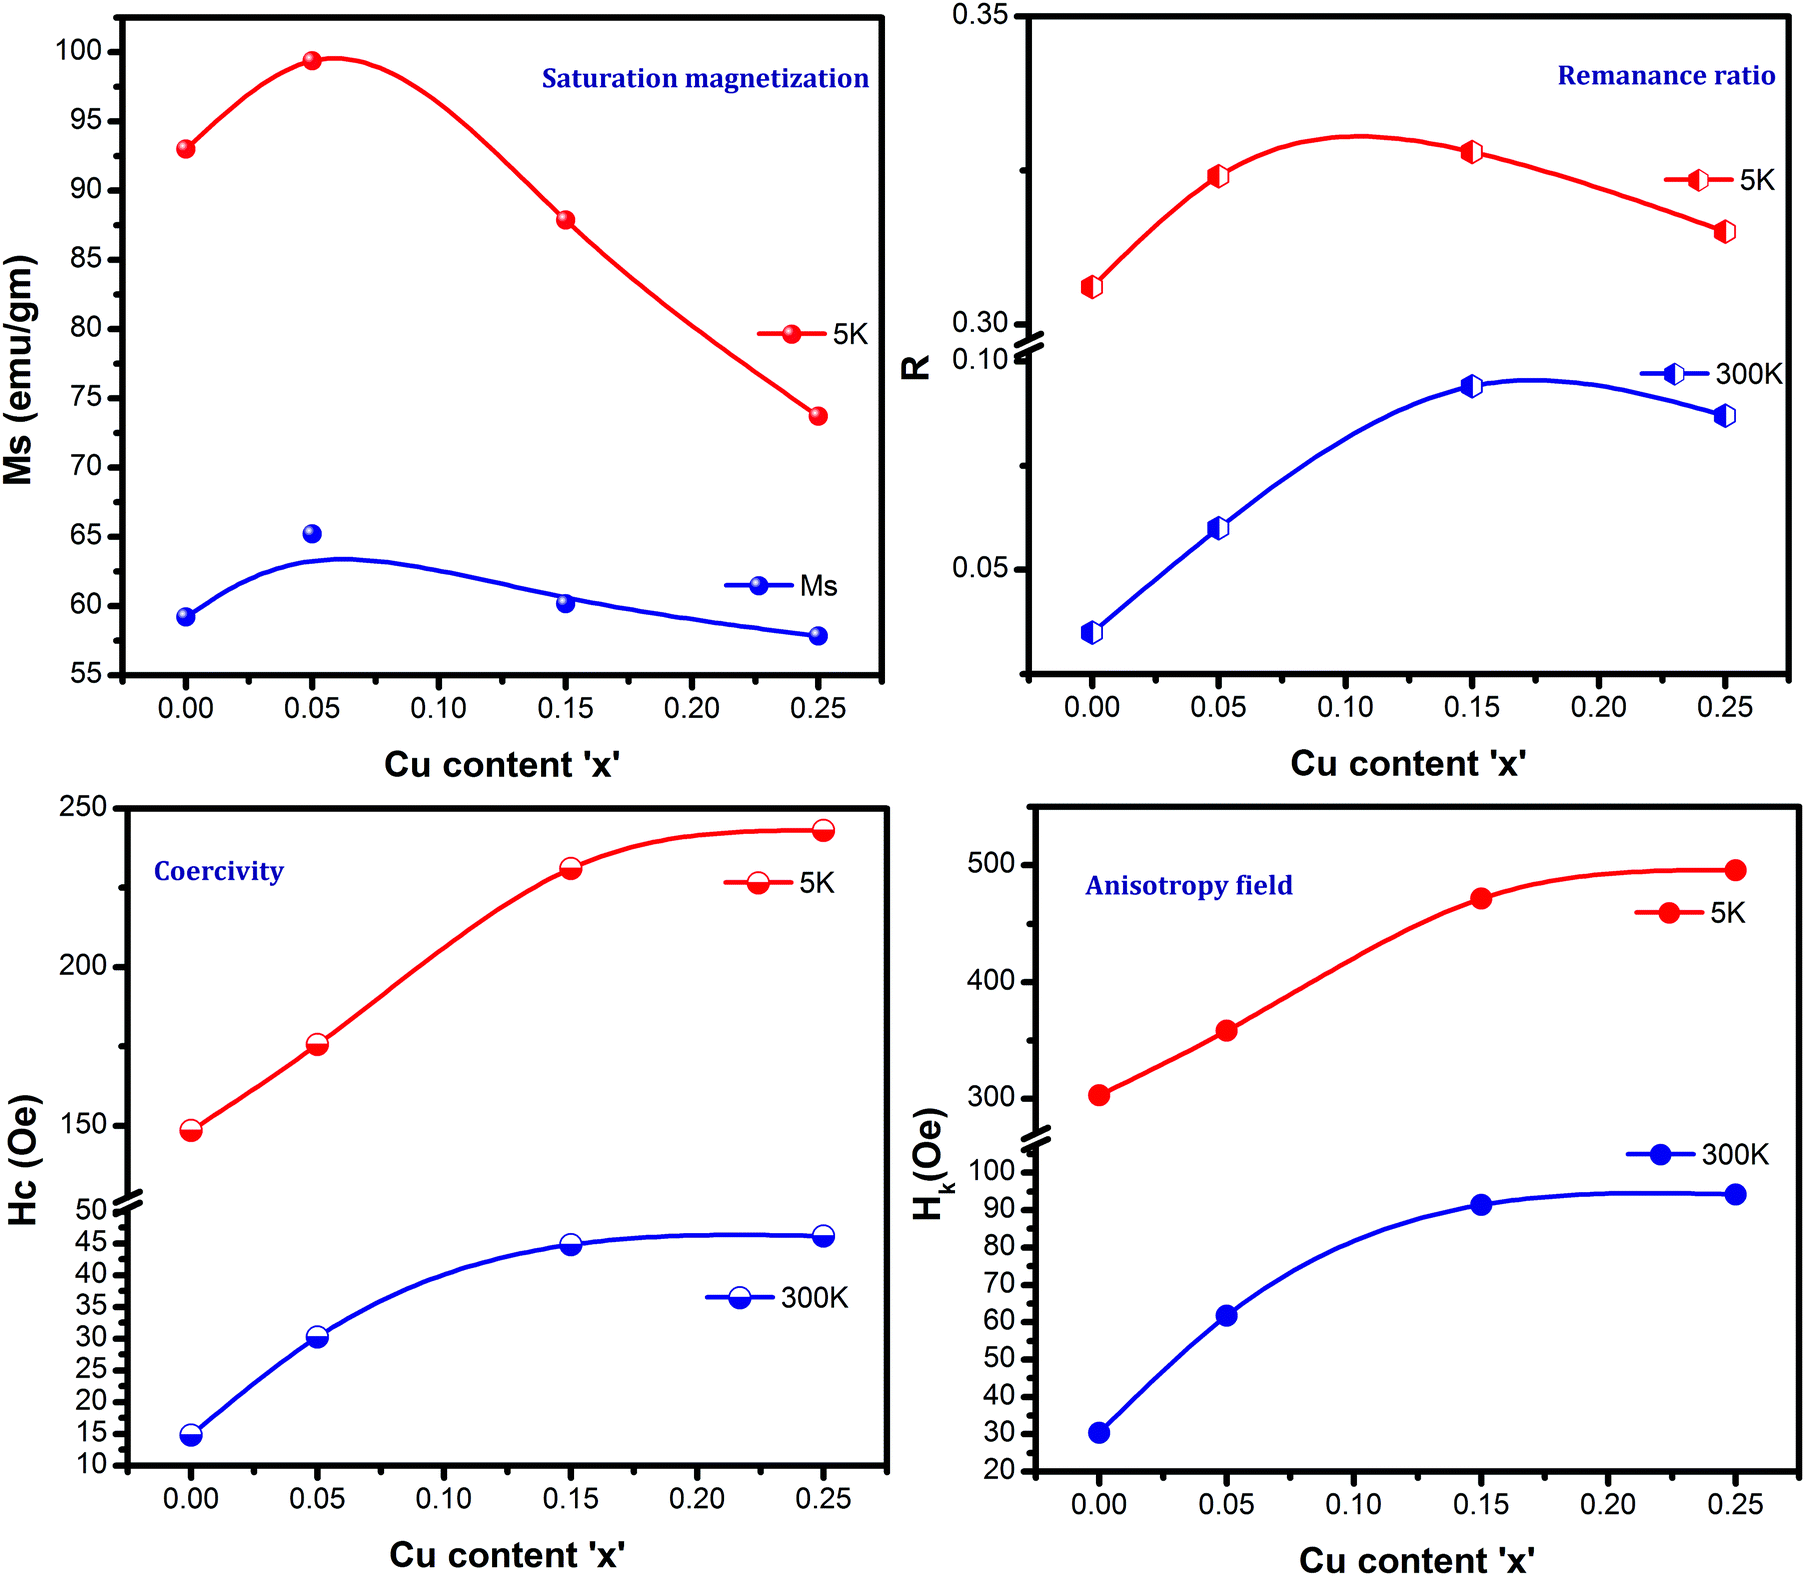
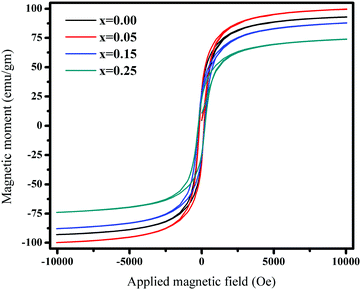
Fig. 7 and 8 show the M–H loops of all the samples obtained at 300 K and 5 K, respectively. The M–H plots indicated soft magnetic nature, which showed moderate saturation with insignificant coercivity. The values of all the magnetic parameters signify ferrimagnetic behavior of all the samples. Fig. 9 displays the variation of magnetic parameters with Cu2+ incorporation.
 |
| | Fig. 7
M–H plots for Ni0.70−xCuxZn0.30Fe2O4 (x = 0.00, 0.05, 0.15, and 0.25) obtained at 300 K. | |
 |
| | Fig. 8
M–H plots for Ni0.70−xCuxZn0.30Fe2O4 (x = 0.00, 0.05, 0.15, and 0.25) obtained at 5 K. | |
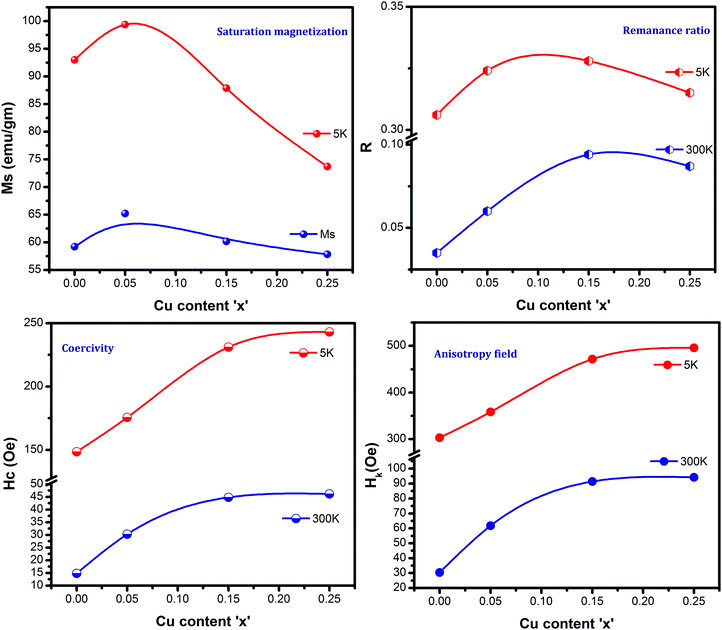 |
| | Fig. 9 Magnetic parameters for Ni0.70−xCuxZn0.30Fe2O4 (x = 0.00, 0.05, 0.15, and 0.25) at 300 K and 5 K. | |
The change in the magnetic parameters is due to the influence of cationic stoichiometry and occupancy at specific sites. In this work, saturation magnetization decreases with Cu2+ incorporation except for the composition x = 0.05. The corresponding magnetic moments of Ni2+, Cu2+, Zn2+, and Fe3+ are two μB, one μB, zero μB, and five μB. Neél's Model can explain the observed change in the magnetization behavior of the samples with Cu2+ substitution. The following relation displays the formula for the theoretical magneton number of spinel ferrites:
where
MB and
MA are the magnetic moments of the [B] and (A) sites, respectively. The increase in the magnetization of the sample
x = 0.05 indicates that the Zn
2+ ions and Ni
2+ and Cu
2+ ions must have occupied the [B] and (A) sites, respectively. Zn
2+ ions have occupied octahedral B-sites as per the cation distribution obtained using magnetic
26 data. The cation distribution presented in
Table 2 matches well with that obtained by the XRD
27,28 data. In the present study, a deviation in the regular preferences of cations was observed. The partial occupation of the Ni
2+ and Zn
2+ ions at tetrahedral A-sites must have forced the Fe
3+ ions to move to the octahedral [B]-site in a way such that the magnetic moment of the [B] sub-lattice increases. Similar results have been reported for a zinc-substituted Cu–Ni spinel ferrite synthesized using the co-precipitation technique and a copper-doped Ni–Zn spinel ferrite.
29–31 Both the experimental and calculated magneton numbers increased for the sample
x = 0.05 and were found to match well, as presented in
Table 2. The
M–
H loops obtained at 5 K (
Fig. 8) show a progressive enhancement in magnetization as compared to those acquired at 300 K; this can be explained by surface effects. As the thermal energy decreases, the magnetic moment becomes aligned in the direction of the applied field as compared to the case at 300 K, where the magnetic moment experiences many disordered states. At low temperatures, surface spin freezing in a certain direction causes an increment in magnetization. The projection of magnetic moments towards the direction of the exterior field may become enhanced. Hence, the magnetization at 5 K shows progressive enhancement as compared to that at 300 K.
Table 2 Cation distribution, magneton number (ηB), and blocking temperature (TB) for Ni0.70−xZn0.30Fe2O4 nanoparticles at temperatures 300 K and 5 K
| Comp. x |
Cation distribution (from magnetization) |
Cation distribution (from XRD) |
η
B
|
T
B (K) |
| Obs. |
Cal. |
| 0.00 |
(Ni0.02Zn0.10Fe0.88) [Ni0.68Zn0.20Fe1.12] |
(Ni0.02Zn0.10Fe0.88) [Ni0.68Zn0.20Fe1.12] |
2.51 |
2.52 |
27 |
| 0.05 |
(Ni0.015Cu0.01Zn0.125Fe0.85) [Ni0.635Cu0.04Zn0.175Fe1.15] |
(Ni0.015Cu0.01Zn0.125Fe0.85) [Ni0.635Cu0.04Zn0.175Fe1.15] |
2.76 |
2.78 |
53 |
| 0.15 |
(Ni0.01Cu0.01Zn0.12Fe0.86) [Ni0.54Cu0.14Zn0.18Fe1.14] |
(Ni0.01Cu0.015Zn0.12Fe0.855) [Ni0.54Cu0.135Zn0.18Fe1.145] |
2.55 |
2.59 |
89 |
| 0.25 |
(Ni0.005Cu0.01Zn0.122Fe0.863) [Ni0.445Cu0.24Zn0.178Fe1.137] |
(Ni0.005Cu0.02Zn0.122Fe0.853) [Ni0.445Cu0.23Zn0.178Fe1.147] |
2.46 |
2.48 |
112 |
Fig. 9 presents coercivity as a function of Cu2+ ion concentration, which was found to increase. The increase in coercivity is attributed to the appearance of an anisotropy field, which was found to increase in this work, indicating a magnetically disordered state. An extra energy field will be required to switch the spins of the disordered state to the ordered state, which will align the magnetization in a preferred direction. Thus, the coercivity increases with the increasing Cu2+ ion concentration. As noticed, the coercivity values are significantly lower, revealing the ferrimagnetic nature of Cu2+-substituted Ni–Zn ferrites. The remanence ratio (Fig. 9) increases with copper substitution as MS reduces with Cu incorporation. The observed values of the remanence ratio at 300 K and 5 K are in the ranges of 0.035–0.094 and 0.306–0.328, respectively. As is well-known, a lesser value (<0.5) of the remanence ratio is prerequisite for the application of spinel ferrites in high-frequency devices.
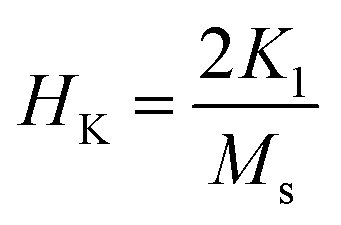
The magnetic spin orients in the easy axis direction, which can be determined by magnetocrystalline anisotropy. The relation for the anisotropy field (HK) is32
| |  | (2) |
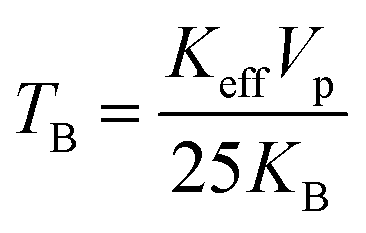
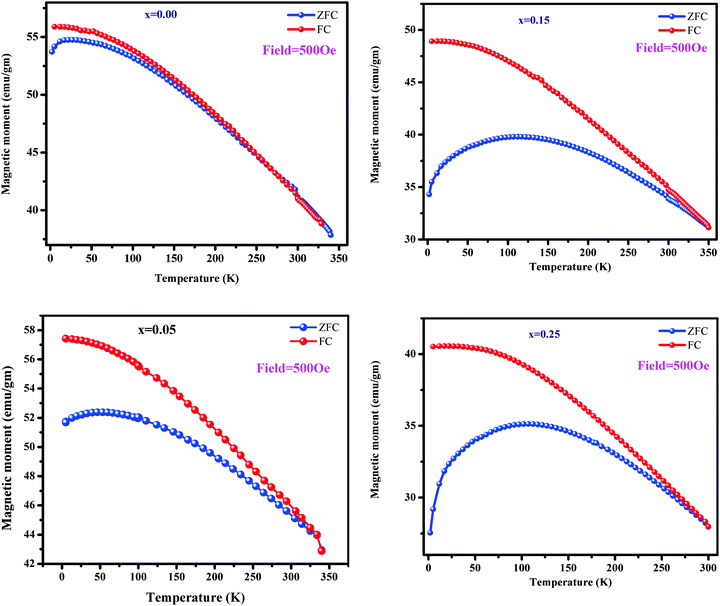
ZFC-FC experiments were conducted to study the effect of magnetic anisotropy on the superparamagnetic behavior of ferrites. Fig. 10 depicts the resulting ZFC-FC curves. In the FC measurement, the total magnetization was noted at the lowermost thermal temperature (5 K) as the magnetic moment was oriented in the direction of the exterior magnetic field. As the temperature increases, the FC curve of each sample shows a continuous decrease in magnetization. This is attributed to thermal agitation, which randomizes the magnetic moments. In the FC curves, magnetization as a function of Cu2+ substitution decreased except for x = 0.05 and followed the same trend as that at 300 K and 5 K with copper substitution. The variation is due to the particle size or magnetocrystalline anisotropy and cation distribution. The blocking temperature (TB) is the temperature at which a maximum magnetization is reached. Above TB, both the ZFC and FC curves coincide at a specific temperature. The blocking temperature increases from 27 to 112 K with Cu incorporation.33 It is observed that copper substitution increases the blocking temperature; this can be explained by Neél's theory, which explains the dependence of the blocking temperature on the magnetocrystalline anisotropy. As a function of copper substitution, the magnetic anisotropy increased (Fig. 9). Consequently, the blocking temperature increased with the increasing copper concentration. The ZFC curves become broader with Cu incorporation; this can be explained by the increase in the particle size. A substantial spin frustration above TB decreases the magnetization. Above TB, superparamagnetism appears due to higher thermal energy than the magnetic energy barrier. Neél's theory34 elucidates the reliance of TB on the effective magnetocrystalline anisotropy (Keff) and volume of particle size (Vp). The following relation provides its dependence:
| |  | (3) |
 |
| | Fig. 10 FC–ZFC curves for Ni0.70−xCuxZn0.30Fe2O4 (x = 0.00, 0.05, 0.15, and 0.25). | |
At low temperatures, the difference between the ZFC and FC curves is related to the variation in coercivity. Moreover, it is related to the anisotropy constant of Cu2+-substituted Ni–Zn spinel ferrites.35 At a certain temperature, both the ZFC and FC curves bifurcate, and this temperature is known as the bifurcation temperature (Trr). With copper substitution, Trr changes from 133 to 311 K. In the ZFC curves, the domain structure at low temperatures is different from that at high temperatures; however, in the FC curves, the domain structure retains its state at high temperatures. It is noticeable that Trr is greater than TB, indicating the existence of substantial dipole–dipole interactions among spins.36 As is well-known, the Curie temperature of a sample plays a vital role in controlling the temperature of that sample under an AC magnetic field for hyperthermia applications. Therefore, Curie temperature studies are essential to apply these materials in hyperthermia applications. In our previous report,37 we have reported the Curie temperature studies of these samples inferred by DC electrical properties. It has found that the increase in the copper content lowered the Curie temperature from 742 K to 671 K, which was attributed to the A–B exchange interactions occurring due to the distribution of Fe3+ ions over the sub-lattices.
3.4 Mössbauer spectroscopy
Mössbauer spectroscopy deals with valence states and is a powerful method to determine the location of the Fe matrix and investigate the superparamagnetic behaviour of nano-ferrites. In ferromagnetically aligned magnetic moments, superparamagnetism can be represented by the Neél-Arrhenius relation, whereas for single-domain particles, it is presented by Neél's relaxation theory.34Fig. 11 displays the Mössbauer spectra of all the samples. A six lines asymmetry advocates the occurrence of at least two hyperfine magnetic sextets corresponding to Fe3+ ions at the (A) and [B] sites. The presence of sextets corresponding to hyperfine interactions indicates the presence of different-sized nanoparticles, and associated superparamagnetism characterizes the presence of a strong quadrupole doublet. A mixed spinel ferrite possesses two exchange interactions where the Fe3+ ions occupy the (A) and [B] sites, the Cu2+ and Ni2+ ions are located at the [B] site, and the Zn2+ ions accommodate the (A) and [B] sites. The spectral parameters, such as line width, isomer shift, quadrupole splitting, and hyperfine field, obtained from the Mössbauer spectra for the (A) and [B] sites as well as for the doublet are provided in Table 3. The line width values for the (A) sites are smaller than those for the [B] sites. The obtained values of IS match well with those reported in the literature.35 The observed IS values are lower than 0.5 mm s−1; this signifies the subsistence of the Fe3+ valence state and rules out the possibility of the presence of Fe2+ valence state. The hyperfine field originating from the magnetic moment varies between 34.40 and 47.89 T and decreases with copper substitution except for x = 0.05. The reduction in Hf with copper substitution is predictable because Cu2+ with a small magnetic moment (1 μB) replaces Ni2+ with a large magnetic moment (2 μB) ion. As is well-known, the AB exchange interactions are stronger than the AA and BB interactions. Moreover, the relative area at the (A) and [B] sites determines the fraction of the Fe3+ ions at the respective sites. As observed from Table 3, the larger fraction of Fe3+ ions occupy the tetrahedral sites, favoring spin canting, and leads to Y–K-type magnetism. It is well-known and accepted that the doublet originates due to the paramagnetic or superparamagnetic behaviour of nanoparticles. Sarveena et al. have reported the same kind of behavior.38,39 Hence, in the present case, the Mössbauer spectra indicate a ferrimagnetic-ordered state and the presence of a doublet, which interpret a paramagnetic phase. Overall, Cu2+ substitution weakens the A–B super-exchange interactions, as witnessed by the M–H behavior, M–T results, and magnetic hyperfine interactions. Thus, magnetization exhibits a decreasing trend with copper substitution.
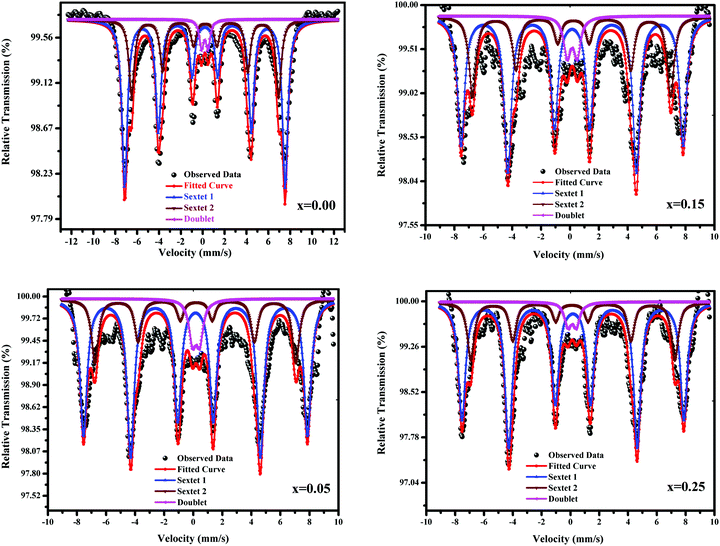 |
| | Fig. 11 Mössbauer spectra of Ni0.70−xCuxZn0.30Fe2O4 (x = 0.00, 0.05, 0.15, and 0.25). | |
Table 3 Line width (Γ), isomer shift (δ), quadrupole splitting (Δ), hyperfine field (Hf), and relative area (RA) of Ni0.70−xZn0.30Fe2O4 (x = 0.00, 0.05, 0.15, and 0.20)
| Comp. x |
Sub cpectrum |
Γ (mm s−1) |
δ (mm s−1) |
Δ (mm s−1) |
H
f (T) |
R
A (%) |
| 0.00 |
S1 |
0.50 |
0.26 |
0.00 |
34.40 |
65.55 |
| S2 |
0.71 |
0.27 |
0.00 |
31.22 |
30.24 |
| D1 |
0.69 |
0.20 |
0.58 |
— |
04.21 |
| 0.05 |
S1 |
0.41 |
0.15 |
0.02 |
47.89 |
71.19 |
| S2 |
0.42 |
0.18 |
−0.06 |
42.95 |
21.96 |
| D1 |
0.35 |
0.20 |
0.49 |
— |
06.86 |
| 0.15 |
S1 |
0.42 |
0.14 |
0.01 |
47.66 |
66.49 |
| S2 |
0.41 |
0.17 |
−0.12 |
42.33 |
27.01 |
| D1 |
0.35 |
0.15 |
0.68 |
— |
06.49 |
| 0.25 |
S1 |
0.41 |
0.17 |
0.06 |
47.32 |
72.30 |
| S2 |
0.42 |
0.13 |
0.05 |
42.02 |
23.20 |
| D1 |
0.36 |
0.12 |
0.58 |
— |
04.50 |
4. Conclusions
In this study, nanocrystalline Cu2+-incorporated Ni–Zn spinel nano-ferrite samples were efficiently synthesized by the nitrate-citrate route. The single-phase cubic-spinel structure of the prepared nano-ferrite samples was maintained throughout the copper substitution process. TEM images of the samples showed spherical morphology with fine particle size distribution. The M–H plots reveal the ferrimagnetic behavior of the Cu2+-incorporated Ni–Zn nano-ferrite samples; this finding is further supported by the Mössbauer spectra. Magnetization at 5 K progressively enhanced due to the surface effects. Field-cooled and zero-field-cooled measurements indicated net irreversibility for all the samples. The hyperfine interaction studies revealed the ferrimagnetic nature of Cu2+-substituted mixed Ni–Zn spinel nano-ferrites.
Conflicts of interest
None.
Acknowledgements
One of the authors (AVH) is grateful to Tata Institute of Fundamental Research (TIFR), Mumbai, SAIF, IIT Powai, Mumbai, and UGC DAE CSR, Indore, for providing X-ray diffraction, high-resolution transmission electron microscopy, and magnetic measurement facilities, respectively.
References
- P. Anantharamaiah, N. S. Chandra, H. Shashanka, R. Kumar and B. Sahoo, Adv. Powder Technol., 2020, 31(6), 2385–2393, DOI:10.1016/j.apt.2020.04.004.
- S. R. Patade, D. D. Andhare, S. B. Somvanshi, P. B. Kharat, S. D. More and K. M. Jadhav, Nanomater. Energy, 2020, 1–6 Search PubMed.
- M. Khadour and Y. Atassi, SN Appl. Sci., 2020, 2, 236 CrossRef CAS.
- A. V. Anupama, V. Kumaran and B. Sahoo, Powder Technol., 2018, 338, 190–196 CrossRef CAS.
- A. V. Anupama, V. Kumaran and B. Sahoo, Adv. Powder Technol., 2018, 29, 2188–2193 CrossRef CAS.
- V. D. Sudheesh, N. Thomas, N. Roona, H. Choudhary, B. Sahoo, N. Lakshmi and V. Sebastian, J. Alloys Compd., 2018, 742, 577–586 CrossRef CAS.
- G. H. Kale, A. V. Humbe, S. D. Birajdar, A. B. Shinde and K. M. Jadhav, J. Mater. Sci.: Mater. Electron., 2016, 27, 2151–2158 CrossRef CAS.
- S. V. Bhandare, R. Kumar, A. V. Anupama, H. K. Choudhary, V. M. Jali and B. Sahoo, Ceram. Int., 2020, 46(11), 17400–17415, DOI:10.1016/j.ceramint.2020.04.031.
- M. K. Anupama, N. Srinatha, S. Matteppanavar, B. Angadi, B. Sahoo and B. Rudraswamy, Ceram. Int., 2018, 44, 4946–4954 CrossRef CAS.
- M. A. Dar, J. Shah, W. Siddiqui and R. Kotnala, Appl. Nanosci., 2014, 4, 675–682 CrossRef.
- A. Nikumbh, R. Pawar, D. Nighot, G. Gugale, M. Sangale, M. Khanvilkar and A. Nagawade, J. Magn. Magn. Mater., 2014, 355, 201–209 CrossRef CAS.
- M. Stefanescu, M. Bozdog, C. Muntean, O. Stefanescu and T. Vlase, J. Magn. Magn. Mater., 2015, 393, 92–98 CrossRef CAS.
- B. Toksha, S. E. Shirsath, M. Mane and K. Jadhav, Ceram. Int., 2017, 43, 14347–14353 CrossRef CAS.
- C. Singh, S. Jauhar, V. Kumar, J. Singh and S. Singhal, Mater. Chem. Phys., 2015, 156, 188–197 CrossRef CAS.
- Y. Köseoğlu, Ceram. Int., 2015, 41, 6417–6423 CrossRef.
- Z. Beji, L. Smiri, N. Yaacoub, J.-M. Greneche, N. Menguy, S. Ammar and F. Fiévet, Chem. Mater., 2010, 22, 1350–1366 CrossRef CAS.
- Y. Yafet and C. Kittel, Phys. Rev., 1952, 87, 290 CrossRef CAS.
- L. Néel, Proc. Phys. Soc., London, Sect. A, 1952, 65, 869 CrossRef.
- I. Rahman and T. Ahmed, J. Magn. Magn. Mater., 2005, 290, 1576–1579 CrossRef.
- T. Ahmed, I. Rahman and S. Tofail, J. Magn. Magn. Mater., 2004, 272, 2250–2252 CrossRef.
- J. Shrotri, S. Kulkarni, C. Deshpande, A. Mitra, S. Sainkar, P. A. Kumar and S. Date, Mater. Chem. Phys., 1999, 59, 1–5 CrossRef CAS.
- G. Joshi, A. Knot and S. Sawant, J. Mater. Sci., 1987, 22, 1694–1700 CrossRef CAS.
- S. Patange, S. Desai, S. Meena, S. Yusuf and S. Shirsath, RSC Adv., 2015, 5, 91482–91492 RSC.
- A. V. Humbe, J. S. Kounsalye, M. V. Shisode and K. M. Jadhav, Ceram. Int., 2018, 44, 5466–5472 CrossRef CAS.
- S. Modak, M. Ammar, F. Mazaleyrat, S. Das and P. Chakrabarti, J. Alloys Compd., 2009, 473, 15–19 CrossRef CAS.
- T. J. Shinde, A. B. Gadkari and P. N. Vasambekar, J. Magn. Magn. Mater., 2013, 333, 152–155 CrossRef CAS.
- R. V. Kumar, A. V. Anupama, R. Kumar, H. K. Choudhary, V. B. Khopkar, G. Aravind and B. Sahoo, Ceram. Int., 2018, 44, 20708–20715 CrossRef CAS.
- G. Datt, C. Kotabage and A. Abhyankar, Phys. Chem. Chem. Phys., 2017, 19, 20699–20712 RSC.
- Q. Han, D. Ji, G. Tang, Z. Li, X. Hou, W. Qi, S. Liu and R. Bian, J. Magn. Magn. Mater., 2012, 324, 1975–1981 CrossRef CAS.
- D. Kurmude, C. Kale, P. Aghav, D. Shengule and K. Jadhav, J. Supercond. Novel Magn., 2014, 27, 1889–1897 CrossRef CAS.
- P. Prameela, A. M. Kumar, G. Choudary, K. Rao and V. Reddy, Mater. Res. Bull., 2014, 59, 1–5 CrossRef CAS.
- S. E. Shirsath, M. L. Mane, Y. Yasukawa, X. Liu and A. Morisako, Phys. Chem. Chem. Phys., 2014, 16, 2347–2357 RSC.
-
B. Cullity and C. Graham, Introduction to Magnetic Materials, 2nd edn, 2008, pp. 1–568 Search PubMed.
- R. A. Pawar, S. M. Patange and S. E. Shirsath, RSC Adv., 2016, 6, 76590–76599 RSC.
- S. Deshmukh, A. V. Humbe, A. Kumar, R. Dorik and K. Jadhav, J. Alloys Compd., 2017, 704, 227–236 CrossRef CAS.
- M. Muroi, R. Street, P. McCormick and J. Amighian, Phys. Rev. B: Condens. Matter Mater. Phys., 2001, 63, 184414 CrossRef.
- A. V. Humbe, P. B. Kharat, A. C. Nawle and K. M. Jadhav, J. Mater. Sci.: Mater. Electron., 2018, 29, 3467–3481 CrossRef CAS.
- S. K. Date, P. A. Joy, P. S. A. Kumar, B. Sahoo and W. Keune, Phys. Status Solidi C, 2004, 1, 3495–3498 CrossRef CAS.
- G. Kumar, S. Sarveena, A. Kumar, R. K. Kotnala, K. M. Batoo and M. Singh, Ceram. Int., 2016, 42, 4993–5000 CrossRef.
|
| This journal is © The Royal Society of Chemistry 2020 |
Click here to see how this site uses Cookies. View our privacy policy here. 
 Open Access Article
 This Open Access Article is licensed under a Creative Commons Attribution-Non Commercial 3.0 Unported Licence
 a,
Arun
Kumar
c and
K. M.
Jadhav
*a
a,
Arun
Kumar
c and
K. M.
Jadhav
*a