
 Open Access Article
 This Open Access Article is licensed under a Creative Commons Attribution-Non Commercial 3.0 Unported Licence
Structure and electrochemical performance modulation of a LiNi0.8Co0.1Mn0.1O2 cathode material by anion and cation co-doping for lithium ion batteries†
Rong Lia,
Yong Minga,
Wei Xiangb,
Chunliu Xua,
Guilin Fenga,
Yongchun Lia,
Yanxiao Chen a,
Zhenguo Wu*ac,
Benhe Zhonga and
Xiaodong Guoad
a,
Zhenguo Wu*ac,
Benhe Zhonga and
Xiaodong Guoad
aSchool of Chemical Engineering, Sichuan University, Chengdu 610065, P. R. China
bCollege of Materials and Chemistry & Chemical Engineering, Chengdu University of Technology, Chengdu, 610059, P. R. China
cState Key Laboratory of Physical Chemistry of Solid Surfaces, College of Chemistry and Chemical Engineering, Xiamen University, Xiamen, 361005, P. R. China
dInstitute for Superconducting and Electronic Materials, University of Wollongong, Wollongong, NSW 2522, Australia
First published on 12th November 2019
Abstract
Ni-rich layered transition metal oxides show great energy density but suffer poor thermal stability and inferior cycling performance, which limit their practical application. In this work, a minor content of Co and B were co-doped into the crystal of a Ni-rich cathode (LiNi0.8Co0.1Mn0.1O2) using cobalt acetate and boric acid as dopants. The results analyzed by XRD, TEM, XPS and SEM reveal that the modified sample shows a reduced energy barrier for Li+ insertion/extraction and alleviated Li+/Ni2+ cation mixing. With the doping of B and Co, corresponding enhanced cycle stability was achieved with a high capacity retention of 86.1% at 1.0C after 300 cycles in the range of 2.7 and 4.3 V at 25 °C, which obviously outperformed the pristine cathode (52.9%). When cycled after 300 cycles at 5C, the material exhibits significantly enhanced cycle stability with a capacity retention of 81.9%. This strategy for the enhancement of the electrochemical performance may provide some guiding significance for the practical application of high nickel content cathodes.
Introduction
The large-scale development of electric vehicles (EVs) is hindered by the limited energy density of LIBs.1–5 Since the energy density is mainly determined by cathode materials, much work has been committed to discover innovative cathode materials with high capacity and a high voltage plateau.6–11 Ni-rich layered transition metal oxides Li[Ni1−x−yCoxMny]O2 (1 − x − y > 0.6) with high theoretical capacity are promising LIB cathodes for EVs.12–16 Especially, LiNi0.8Co0.1Mn0.1O2 has attracted much attention due to the balanced energy density and thermal stability. However, the high content of Ni endows poor electrochemical performance to LiNi0.8Co0.1Mn0.1O2, such as low rate capacity and inferior cycle performance, induced by poor structural stability including Li+/Ni2+ cation mixing, layered to rock-salt like phase degradation and unstable storage properties.To overcome the above problems, a great number of strategies have been explored to boost the physical and chemical stability of this cathode by morphology design, surface modification and interior ionic doping.17–25 Various of coating substances including metal oxides, metal phosphates and metal fluorides have been used to stabilize the interface between electrode and electrolyte. Although the coating layer could stabilize the structure of the interface region and alleviate the side reaction between electrode and electrolyte, the approach for construction of modification layer usually need post coating process, thus increasing the complexity of material manufacture.25 Furthermore, most of surface coating strategies do not change the lattice structure in the interior of particle.3 As to doping, a variety of dopants substituted on lithium sites, transition metal sites and oxygen sites have been reported and have optimistic roles in stabilizing the structure and improving electrochemical performance. Recently, Biao Li et al. prepared B doped Li-rich cathode material, which displays an outstanding recoverable capacity of 300 mA h g−1 along with notable cycling stability with a capacity retention of 89% after 300 cycles due to the high thermal stability induced by B. The improved electrochemical performance is caused by the increased covalency of the M–O bonds.26 On the other hand, the Ni-rich NCM cathodes doped with metal cation (such as Zr, Al, Ti, Mg, etc.) show improved structural stability and electrochemical performance. Despite the utilization of inactive cation to modify the material has been reported in many literatures, there still are only few reports about the modification of the Ni-rich cathode materials using minor amount of transition metal ion, especially the 3d metal ions. Consider the advantage provided by the existence of minor amount of 3d transition metal, it is highly desirable to systematically investigate the influence of cation and anion co-substitution on the structure and electrochemical properties of Ni-rich cathode. Among all 3d transition metal, cobalt doping can certainly improve the electrochemical properties of cathode materials. However, as far as we know, there is no literature on the effect of adding cobalt on the high nickel cathode material during the calcination stage.
Herein, minor content of Co and B were doped into the crystal of Ni-rich cathode the using cobalt acetate and boric acid as raw materials to enhance the electrochemical properties of LiNi0.8Co0.1Mn0.1O2. The influences of co-doping on the physical structure and electrochemical properties of cathode materials were systematically explored. The co-doped material exhibits enhanced electrochemical performance due to the capacity activation effect with cobalt and the stabilized structure with boron.
Experimental methods
Material synthesis
The co-precipitation method was adopted to make Ni0.8Co0.1Mn0.1(OH)2 precursor. A certain amount of NiSO4·6H2O (AR, 98.5%), CoSO4·7H2O (AR, 99.5%) and MnSO4·5H2O (AR, 99%) was added to a continuously stirred tank reactor (5 L) under N2 atmosphere. Subsequently, 4 M NaOH (AR, 96%) solution was also fed into the reactor, as well as a required amount of NH4OH (AR, 28–30%) solution as the chelation agent. The pH value of the reaction suspension was controlled at 11.2 by adjusting the feeding rate of NaOH solution. The spherical Ni0.8Co0.1Mn0.1(OH)2 materials were filtering, followed with washing and drying operation in air under 120 °C. A stoichiometric amount of LiOH (10% excess) was mixed into the precursor. The obtained sample was preheated at 450 °C for 10 h and calcined at 800 °C for 12 h under oxygen flowing, and the obtained pristine lithiated material is denoted as NCM. In contrast, B and Co doped Ni-rich materials were obtained via the similar process mentioned above, except that corresponding amount of C4H6CoO4 and H3BO3 were also added along with the LiOH. Co doped (the molar ratio of (Ni + Co + Mn) and Co was set as 1![[thin space (1/6-em)]](https://www.rsc.org/images/entities/char_2009.gif) :0.005), B doped (the molar ratio of (Ni + Co + Mn) and B was set as 1:0.001) and Co–B co-doped (molar ratio of (Ni + Co + Mn, Co) and B was set as 1:0.005:0.001) materials were denoted as NCM/C, NCM/B and NCM/CB, respectively.
:0.005), B doped (the molar ratio of (Ni + Co + Mn) and B was set as 1:0.001) and Co–B co-doped (molar ratio of (Ni + Co + Mn, Co) and B was set as 1:0.005:0.001) materials were denoted as NCM/C, NCM/B and NCM/CB, respectively.
Material characterization
The crystal structure of these materials were reflected by X-ray diffractometry (XRD, PANalytical EMPYREAN) with Cu Kα radiation (λ = 1.54178 Å). The 2θ value ranging from 10 to 80° at a scanning rate of 0.06° s−1 was set for XRD data collection. The particle shape and morphology were observed with scanning electron microscope (SEM, Hitachi, S-4800), transmission electron microscope (TEM, 300 kV FEI Tecnai G2 F30 S-TWIN) and focused ion beam (FIB, FEI HELIOS NanoLab 600i(FIB)). Energy dispersive spectroscopy (EDS) was employed to obtain the element mapping. X-ray photoelectron spectrometer (XPS, VG Multilab 2000) was used to observe the chemical states of element composition at the surface.Electrochemical test
Coin cells (CR2025) are used to test the electrochemical performance, which were installed in an argon-filled glove box. The positive electrode was consisted by 80 wt% of active material, 7 wt% of carbon black and 13 wt% of polyvinylidene fluoride (PVDF), which were mixed with N-methyl-2-pyrrolidone (NMP) as the solvent. The obtained material was coated uniformly onto an aluminum foil current collector, then was dried under vacuum at 120 °C for 10 h. Lithium metal foil and polypropylene membrane (Celgard 2400) were treated as the negative electrode and the separator, separately. The electrolyte was made of 1 M LiPF6 dissolved in a mixture of ethylene carbonate and dimethyl carbonate (1:1 by volume). Galvanostatic charge–discharge test was obtained using a battery testing system (Neware BTS-610) during the voltage range 2.7 to 4.3 V (vs. Li/Li+) at 25 °C. An electrochemical workstation (Zennium, IM6) was employed to get the electrochemical impedance spectroscopy (EIS) with an amplitude of 5 mV and a frequency ranging from 100 kHz to 10 MHz.
Results and discussion
XRD data was collected to determine the phase and crystal structure of all the samples. The results are shown in Fig. 1a, where every pattern can be similarly matched to a hexagonal α-NaFeO2 structure with R![[3 with combining macron]](https://www.rsc.org/images/entities/char_0033_0304.gif) m space group. None of them were found with impurities. As shown in all XRD patterns, the well-organized layered structure can be reflected from the noticeable peak split of the neighboring peaks ((006)/(102) and (108)/(110)).27–29 The absence of peaks related to boron compounds in NCM/CB could be attributed to the low content of B. All the results uncover that the process of doping would not impact the structure of NCM. The shift of (003) reflection peak for NCM/CB, NCM/B and NCM/C to lower angle is due to the expanded interplanar spacing induced by B/Co doping.27 Among them, the NCM/CB sample shows the largest interslab space. Since Li ions diffuse in LiNi0.8Co0.1Mn0.1O2 along the a and b direction, the enlarged interplanar spacing of (003) slab would be favorable for the lithium diffusion rate, thus resulting in the enhanced rate performance. The ratios of I(003)/I(104) for these materials are higher than 1.2, which confirms the little cation mixing in these materials.30 The above results reveal that B3+ and Co2+ are doped into crystal lattice of Ni-rich material. To further get more structural details and the difference of interslab spacing values, Rietveld refinements were carried out for the XRD data of all the samples. The fitting curves and the details are displayed in Fig. 1S† and Table 1. There could be seen the good agreement between the experimental and calculated results (Re < 5%, Rp < 4%), which proves that the structural model is reasonable.31 Besides, the lattice parameter a and c of the NCM sample is 2.8715 and 14.2008 Å. After Co doping, a and c increase to 2.8719 and 14.2019 Å, respectively. Afterward B doping, a and c increase to 2.8718 and 14.2017 Å, respectively. For NCM/CB sample, the doping of B and Co causes the increase of lattice parameter a and c to 2.8725 and 14.2028 Å, respectively. The volume increases from 101.4054 to 101.4903 Å, which also implies the enlargement of the interslab distance after doping.30 The expansion of c interslab may decrease the energy barrier of Li+ insertion/extraction, hence enhancing the high-rate capability.32
m space group. None of them were found with impurities. As shown in all XRD patterns, the well-organized layered structure can be reflected from the noticeable peak split of the neighboring peaks ((006)/(102) and (108)/(110)).27–29 The absence of peaks related to boron compounds in NCM/CB could be attributed to the low content of B. All the results uncover that the process of doping would not impact the structure of NCM. The shift of (003) reflection peak for NCM/CB, NCM/B and NCM/C to lower angle is due to the expanded interplanar spacing induced by B/Co doping.27 Among them, the NCM/CB sample shows the largest interslab space. Since Li ions diffuse in LiNi0.8Co0.1Mn0.1O2 along the a and b direction, the enlarged interplanar spacing of (003) slab would be favorable for the lithium diffusion rate, thus resulting in the enhanced rate performance. The ratios of I(003)/I(104) for these materials are higher than 1.2, which confirms the little cation mixing in these materials.30 The above results reveal that B3+ and Co2+ are doped into crystal lattice of Ni-rich material. To further get more structural details and the difference of interslab spacing values, Rietveld refinements were carried out for the XRD data of all the samples. The fitting curves and the details are displayed in Fig. 1S† and Table 1. There could be seen the good agreement between the experimental and calculated results (Re < 5%, Rp < 4%), which proves that the structural model is reasonable.31 Besides, the lattice parameter a and c of the NCM sample is 2.8715 and 14.2008 Å. After Co doping, a and c increase to 2.8719 and 14.2019 Å, respectively. Afterward B doping, a and c increase to 2.8718 and 14.2017 Å, respectively. For NCM/CB sample, the doping of B and Co causes the increase of lattice parameter a and c to 2.8725 and 14.2028 Å, respectively. The volume increases from 101.4054 to 101.4903 Å, which also implies the enlargement of the interslab distance after doping.30 The expansion of c interslab may decrease the energy barrier of Li+ insertion/extraction, hence enhancing the high-rate capability.32
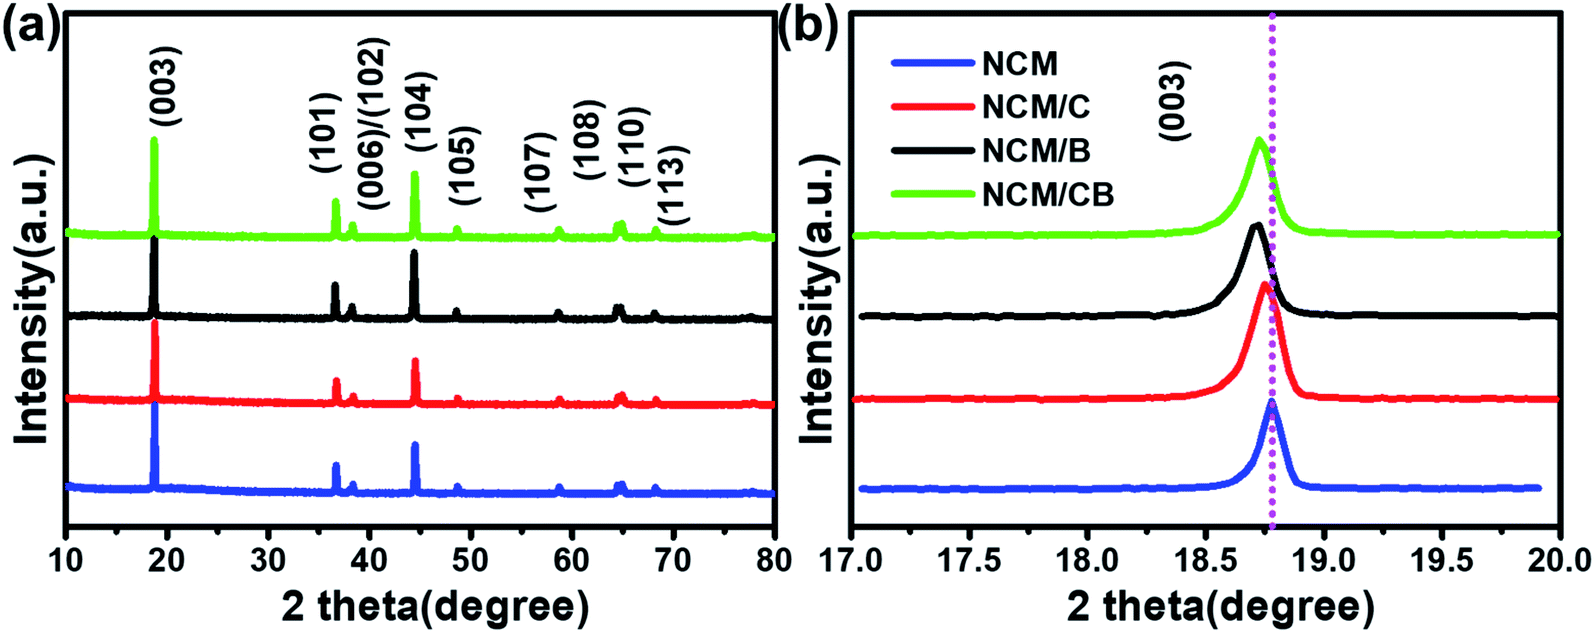 | ||
| Fig. 1 (a) The XRD patterns of NCM, NCM/C, NCM/B and NCM/CB, (b) the magnified image of the (003) peak. | ||
| Sample | a (Å) | c (Å) | c/a | V (Å3) | Rp (%) | Re (%) | I(003)/I(104) |
|---|---|---|---|---|---|---|---|
| NCM | 2.8715 | 14.2008 | 4.9454 | 101.4054 | 3.91 | 3.73 | 1.798 |
| NCM/C | 2.8719 | 14.2019 | 4.9451 | 101.4415 | 3.93 | 4.21 | 1.781 |
| NCM/B | 2.8718 | 14.2017 | 4.9416 | 101.4330 | 3.46 | 3.54 | 1.369 |
| NCM/CB | 2.8725 | 14.2028 | 4.9444 | 101.4903 | 3.91 | 4.21 | 1.472 |
As shown in Fig. 2, the secondary particles of all samples show spherical morphology (∼10 μm) that constituted by grain-like primary particles (about 500 nm). Compared with NCM and NCM/C, NCM/CB shows dim and blurry surface, which is mainly ascribed to the presence of light B element. It can obviously be seen from the Fig. 2 that the primary particle of the material becomes slightly larger after doping, which may be owed to the change of the surface energy. Fig. 2g–k show the EDS mapping images of NCM/CB sample. As expected, the secondary particles are consisted of Ni, Co, Mn and B, confirming the uniform doping of Co and B.25
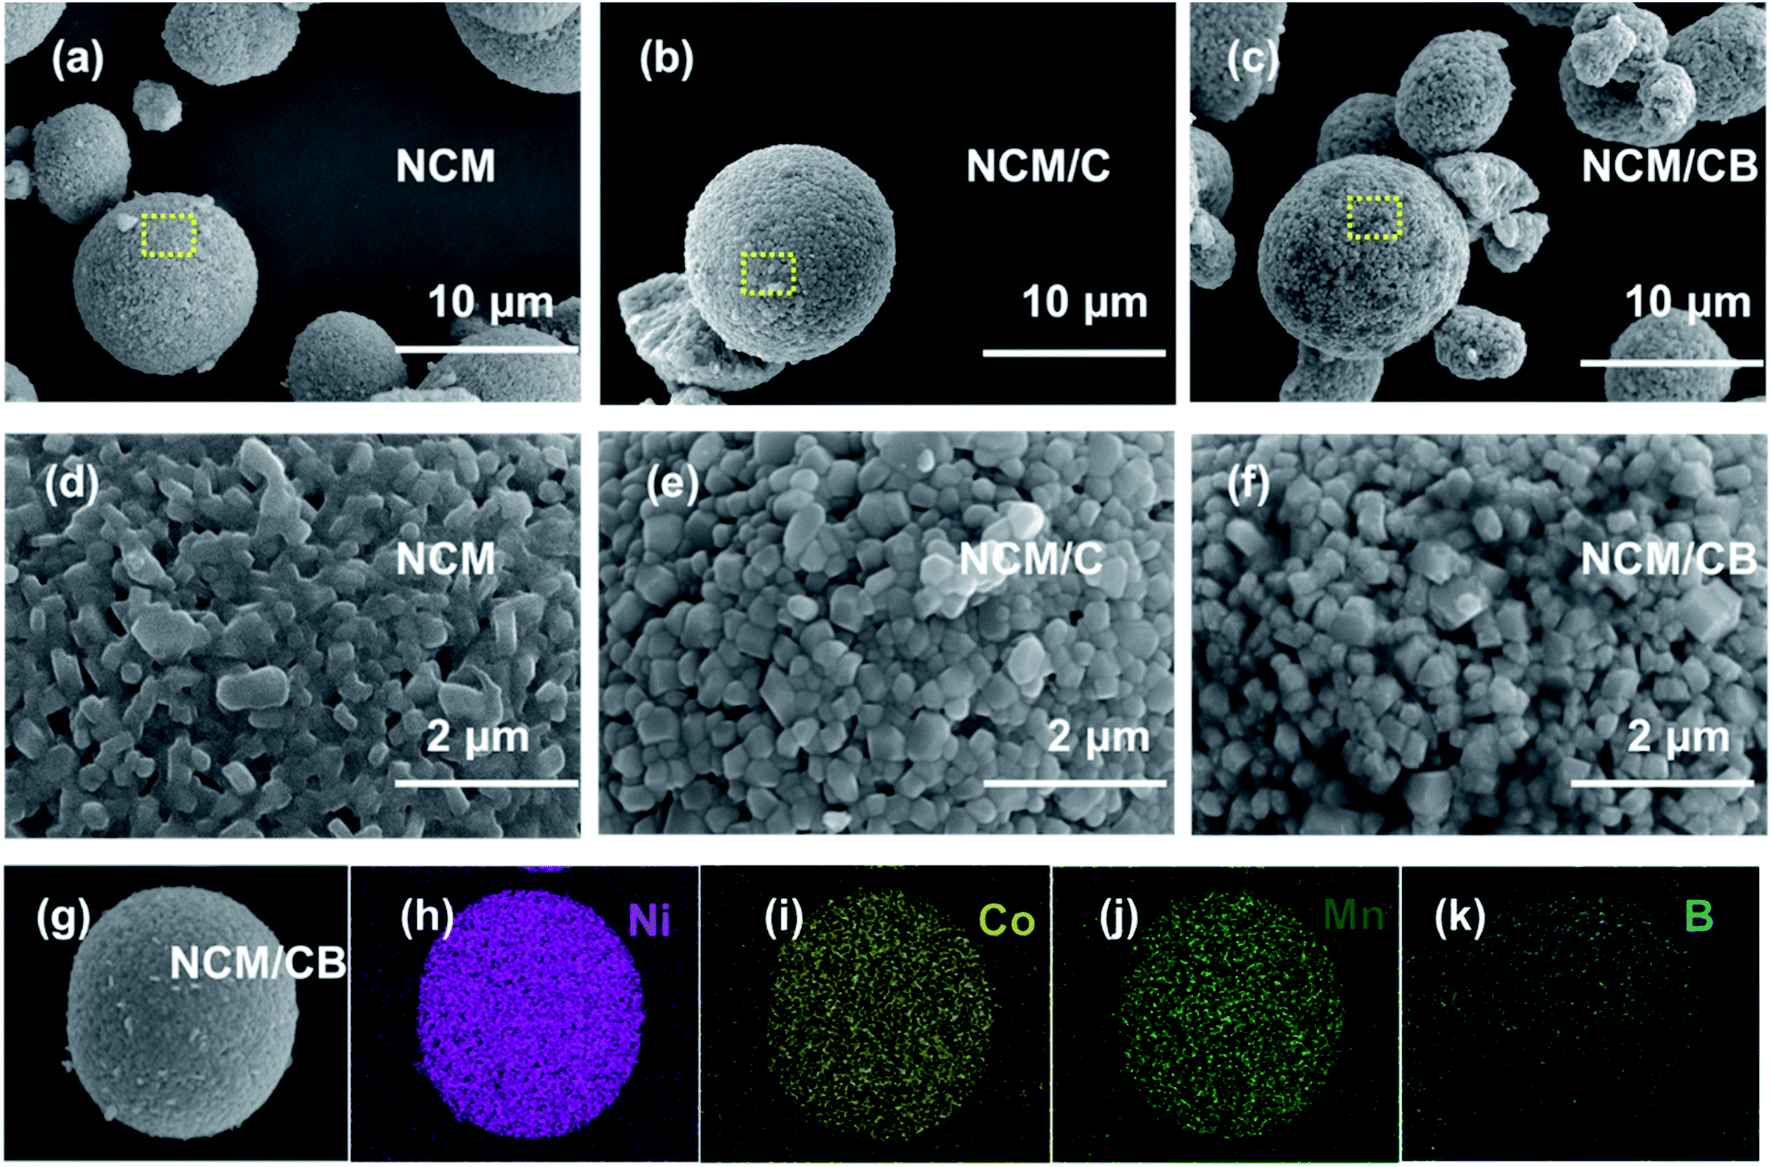 | ||
| Fig. 2 The SEM images of NCM (a and d), NCM/C (b and e) and NCM/CB (c and f), the SEM image and corresponding elemental mapping of NCM/CB (g–k). | ||
In order to analyze the element concentration versus depth of NCM/CB, the EDS line scan analysis of cross-sectional image was obtained. As shown in Fig. 3a and b, the concentration of B in the superficial surface region is much higher than that in the inside region of particle. On the contrary, the concentration of Co is slightly higher than that of Mn in the whole region of particle. It can be surmised that the element of B and Co are effectively doped into the particle.32
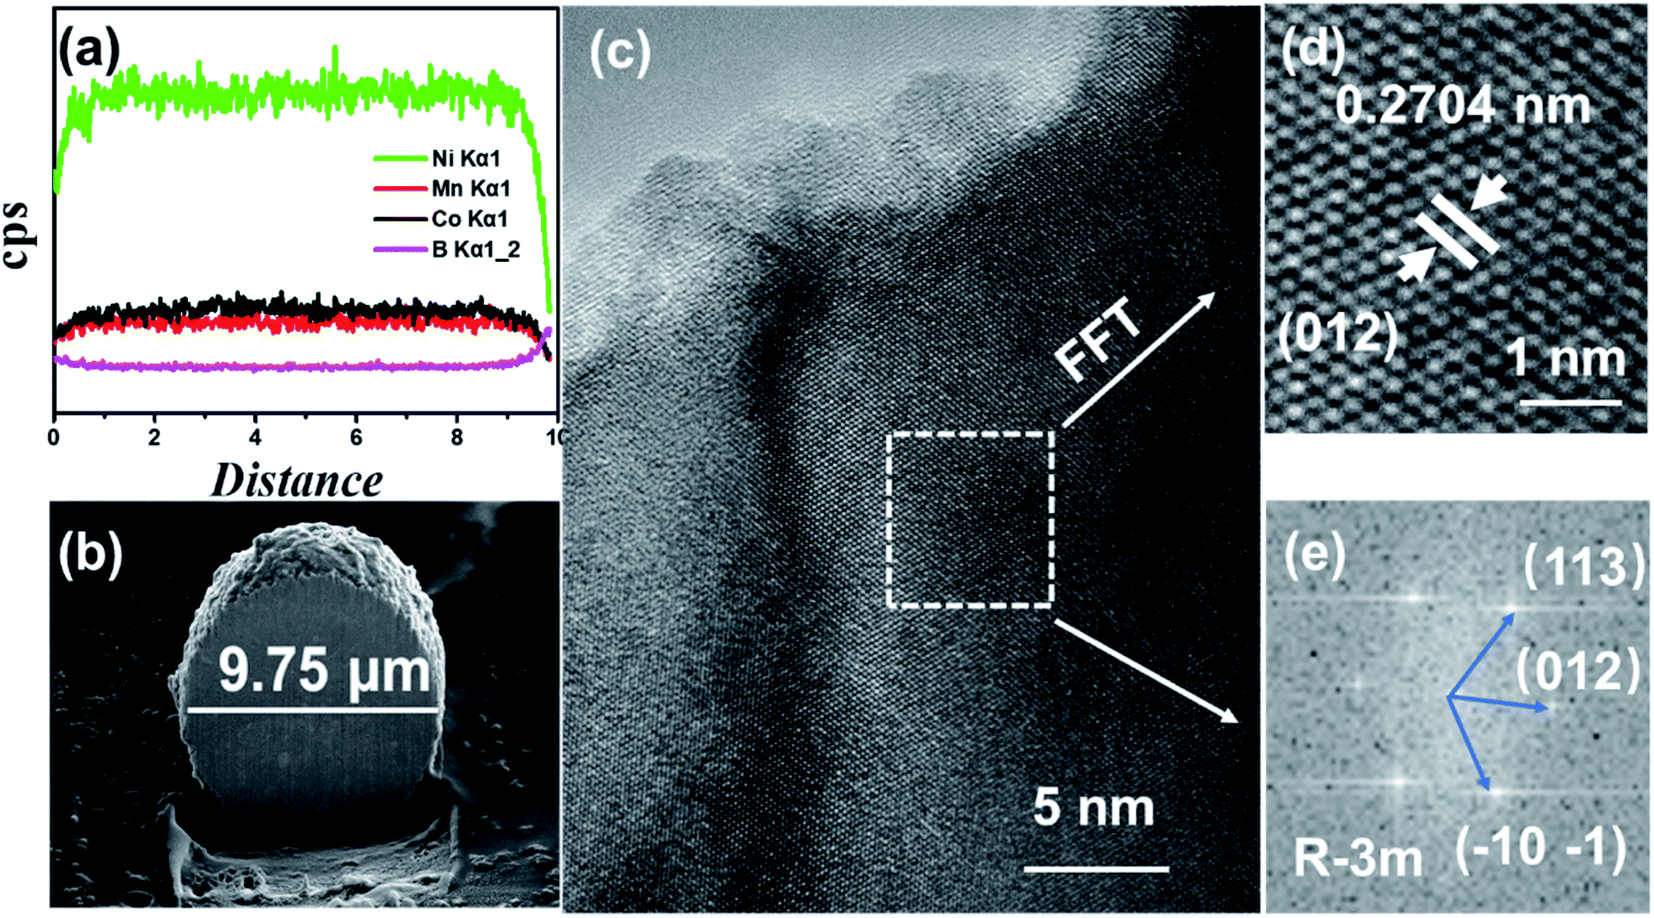 | ||
| Fig. 3 The Element distribution obtained by EDS line scan (a), cross-sectional image (b), HRTEM images (c), enlarged version of HRTEM image (d) and FFT (e) for NCM/CB. | ||
To further understand the structure of NCM/CB, microstructure of the cathode is analyzed by HRTEM. As shown in Fig. 3c, the HRTEM of NCM/CB has regular clear plaid stripes. The lattice fringes of NCM/CB (Fig. 3d) with a spacing about 0.2704 nm, matching to (101) plane of the layered structure.32–34 The result of Fast Fourier Transform analysis is shown in Fig. 3e, which shows that the material of NCM/CB is well-preserved as the Rm phase.35 The interplanar distances of diffraction spots are corresponding to the crystal planes (113), (012) and (101), which belong to the zone axis of [012]. According to the analysis of XRD and HRTEM, it can be concluded the material of NCM/CB has well-organized layered structure, which could be in favor of the improvement of electrochemical performance.35
In order to further analyze the component and oxidation state of the element at the surface of NCM, NCM/C and NCM/CB, X-ray photoelectron spectroscopy were tested. As shown in Fig. 4a, the full XPS spectra clearly shows the presence of Ni, Co and Mn peaks in all of samples and the existence of B 1s in NCM/CB. The Fig. 4b shows that Ni 2p1/2 main peak at 872.5 eV with a satellite peak and Ni 2p3/2 main peak at about 880.0 eV with a satellite peak are exhibited in all samples. It could be found that NCM and NCM/C show similar ratio value between Ni3+ and Ni2+ (Ni3+/Ni2+). However, NCM/CB cathode displays a higher value of Ni3+/Ni2+(1.35), indicating its ideal stoichiometric composition with less anti-defects.25,36–38 As shown in Fig. 4c, the O 1s peak at approximately 529.3 eV related to the lattice oxygen in the metal framework. And the O 1s peak at 532 eV is assigned to the absorbed oxygen originated from the surface CO32−, OH− and some by-products.39 It clearly shows that NCM/CB sample exists more lattice oxygen and less absorbed oxygen. The B peak at 191.7 eV, shown in Fig. 4d, can only be detected in the XPS spectrum of NCM/CB, demonstrating B is doped into the crystal of material. The Co XPS spectra in Fig. S2† presents Co 2p1/2 main peak at about 795 eV and Co 2p3/2 main peak at about 780 eV, verifying the oxidation state of 4+.40–44
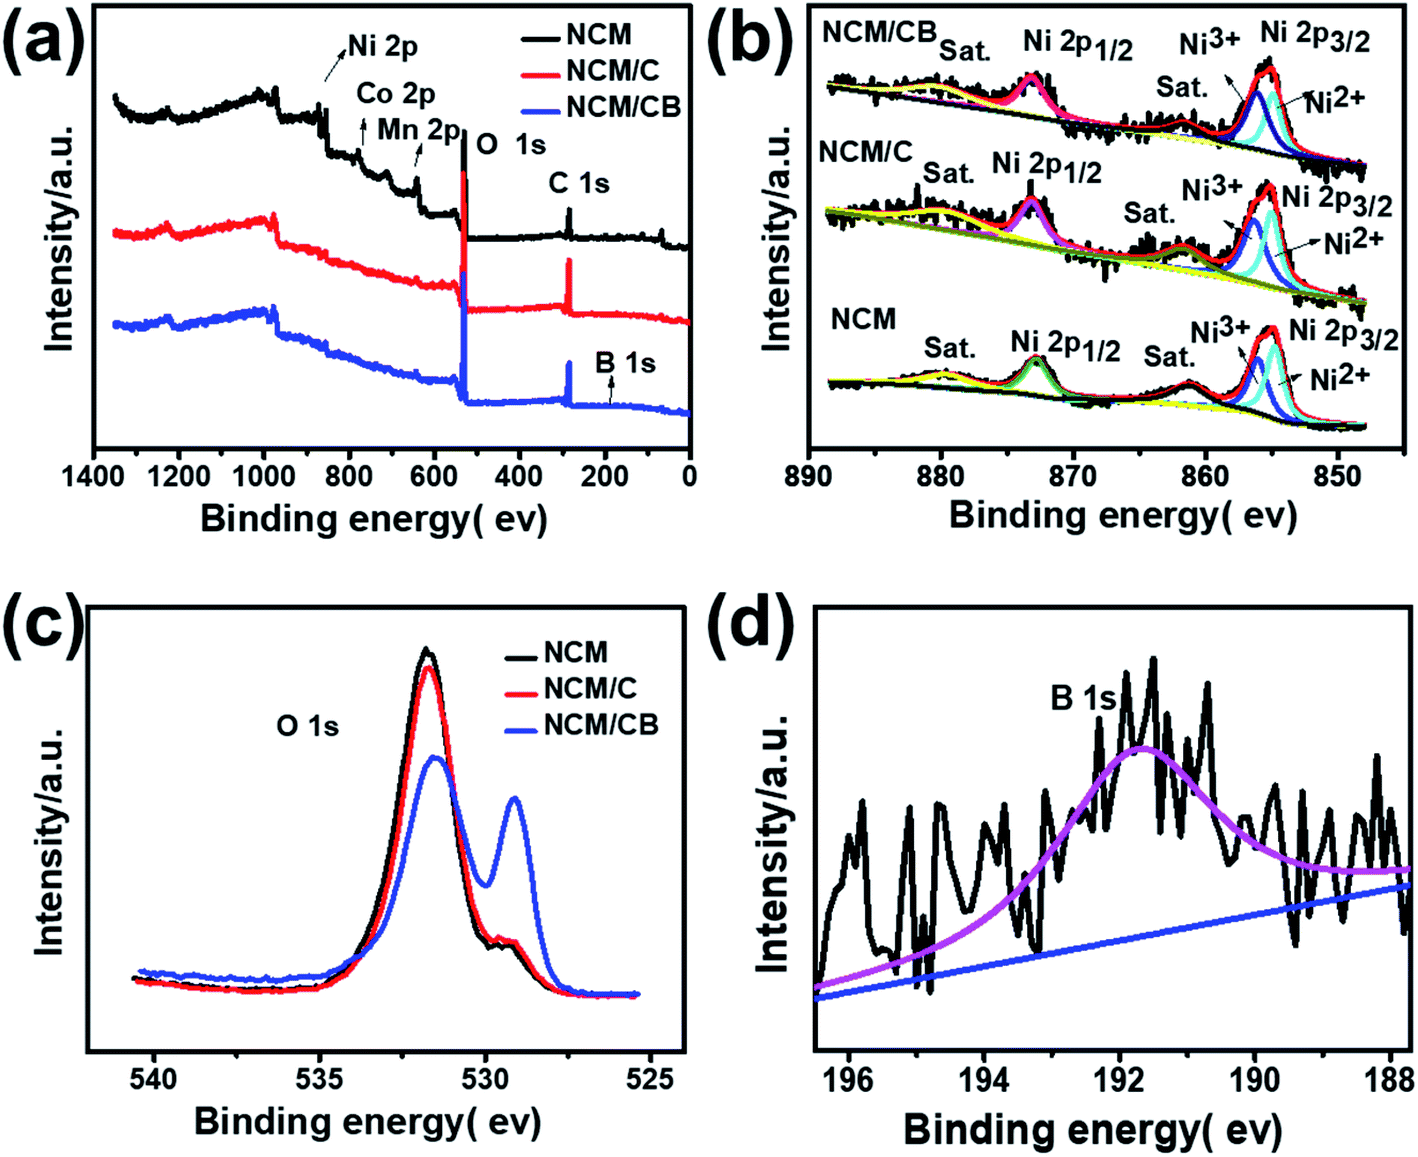 | ||
| Fig. 4 Full XPS spectra (a), Ni 2p (b) and O 1s (c) for NCM, NCM/C and NCM/CB. XPS spectra of B 1s (d) for NCM/CB. | ||
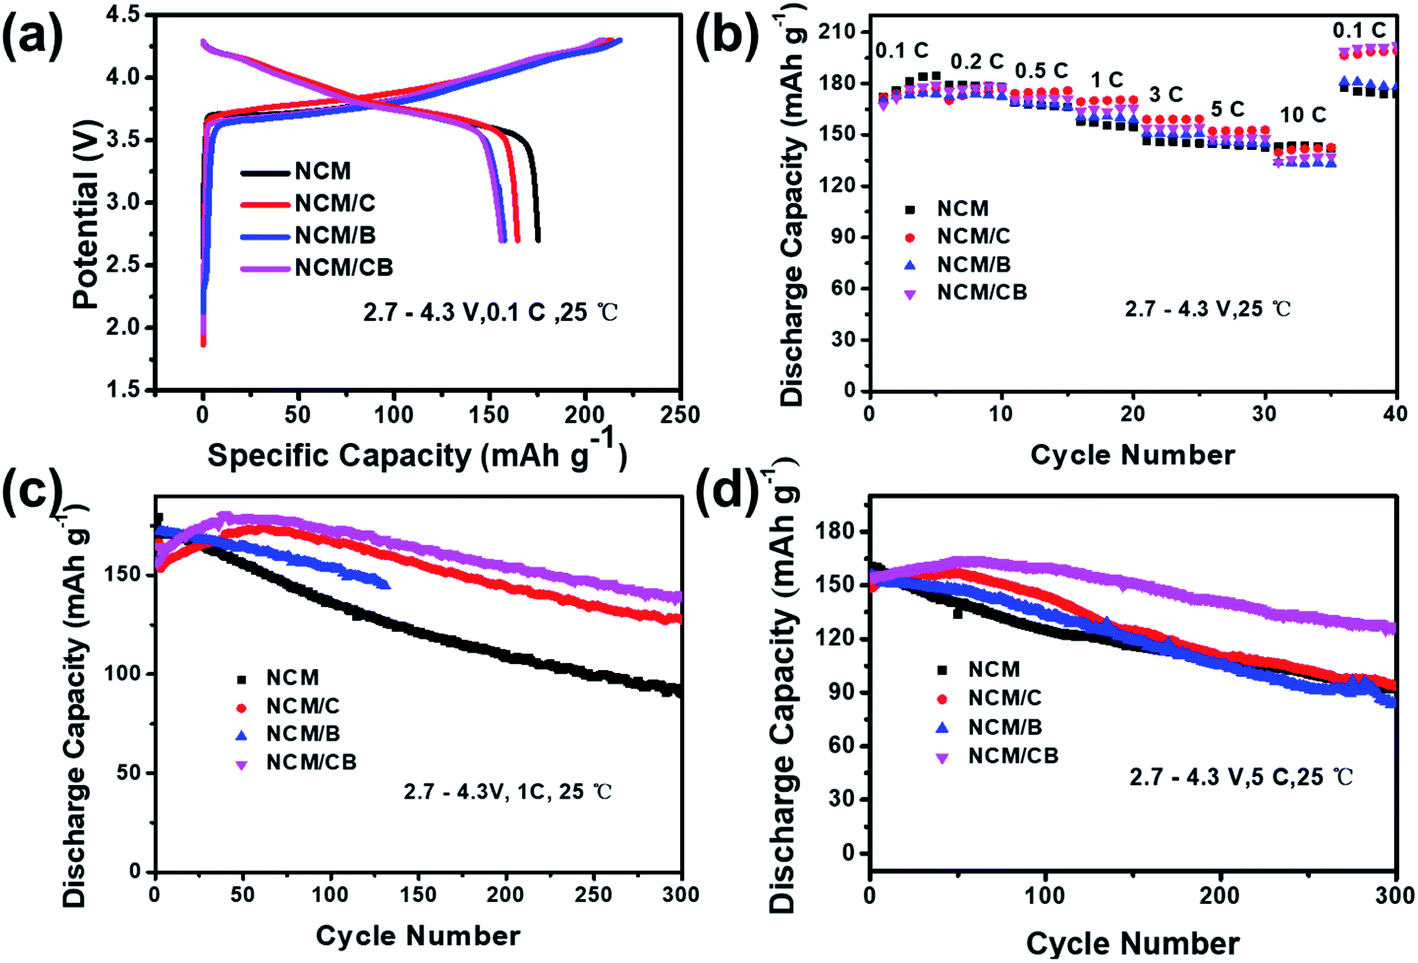
At 0.1C, the primary charge/discharge curves of NCM, NCM/C and NCM/CB are shown in Fig. 5a. The first coulombic efficiency of NCM, NCM/C, NCM/B and NCM/CB is 83.44, 77.04, 74.85 and 74.54%, respectively, suggesting that the introduction of element has slight effect on the coulombic efficiency of primary cycle. With the intention of study the impact of co-doping on the rate capability of Ni-rich cathode material, the NCM, NCM/C, NCM/B and NCM/CB were charged under different current densities of 0.1C, 0.2C, 0.5C, 1C, 3C, 5C, and 10C (1C = 170 mA h g−1). As shown in Fig. 5b, compared with NCM/C, NCM/CB electrode shows relative lower reversible capacity at 0.5, 1.0, 3.0, 5.0 and 10.0C, but it displays a slightly higher reversible capacity at 0.1 and 0.2C. The rate performance of NCM/C and NCM/CB at 0.1C is much higher than that of NCM, which may be due to the different degree of capacity activation. From the figure we can see that the rate performances of NCM/CB sample only display a slightly higher reversible capacity at 0.1 and 0.2C compared with NCM/C because the rate performance is not only affected by the lattice parameters, but also by the conductive layer, particle size, etc.45 The reason of capacity activation is that co-doping can remarkably decrease the energy barrier of Li+ insertion/extraction, which may slowly active the capacity of cathode, and has been reported in the doped Li-rich cathodes.45–47
 | ||
| Fig. 5 Primary charge/discharge profiles (a), rate performance profiles (b), cycle performance at 1.0C (c) and 5.0C (d) for the samples. | ||
As shown in Fig. 5c, at the first cycle of 1.0C, the discharge capacity is recorded as 170.3, 153.4, 172.0, and 157.6 mA h g−1 for the NCM, NCM/C, NCM/B, and NCM/CB samples. The capacity retention of NCM, NCM/C and NCM/CB is 52.9%,82.3% and 86.1% after 300 cycles, respectively. We can clearly see that the cycle stability of NCM/CB at 1C is much greater than other materials. The capacity fading could be ascribed to the surface degradation, triggered by straight contact of sensitive Ni4+ ions with the liquid electrolyte in the charged state. Interestingly, both of NCM/C and NCM/CB show capacity activation over a long period of time and maintain notable cycling stability, with highest capacity of 174.04 mA h g−1 and 180.71 mA h g−1, correspondingly. The better cycle stability of NCM/CB could be attributed to the increased interlayer spacing and suppressed Li/Ni mixing by B-doping. At 5.0C, the cycling performance of NCM/CB is higher than that of NCM and NCM/C sample (Fig. 5d). The capacity retention of the NCM, NCM/C, NCM/B and NCM/CB after 300 cycles is 57.38, 63.49, 53.8 and 78.25%. The discharge capacities of NCM/C and NCM/CB during cycle also show the capacity activation. The results imply that the cycling stability has been increased by the doping of B and Co.
With the purpose of recognize the result of co-doping on the electrochemical performance, the cycling performance is obtained in the 2.7–4.5 V at 1C. After 100 cycles, as Fig. S3† shows, the discharge capacity of NCM quickly reduced from 192 to 117 mA h g−1. However, the discharge capacity of NCM/C decreases from 199 to 169 mA h g−1 and the discharge capacity of NCM/CB decreases from 202 to 166 mA h g−1. These consequences imply that doping can boost the high-rate capability of the NCM/C and NCM/CB sample, which could be largely owned to the decreased energy barrier of the Li+ insertion/extraction.48–50
To validate the enhanced structural stability of the NCM/CB cathode, dQ/dV profiles were gained by differential analysis of charge–discharge curves. As shown in Fig. 6a, all cathodes show four noticeable redox peaks caused by the multiple phase transitions in the lithiation/delithiation of Li1−xNi0.8Co0.1Mn0.1O2. The 0.0 ≤ x ≤ 0.25, correspond to an initial rhombohedral phase (H1) the 0.25 ≤ x ≤ 0.55 correspond a monoclinic phase (M), the 0.55 ≤ x ≤ 0.75 correspond a rhombohedral phase (H2) and the 0.75 ≤ x ≤ 1 correspond two co-existing phases (H2 + H3). The last H2 + H3 phase transition at around 4.2 V is account for the irreversible phase transition related to capacity fade.9,33 Obviously, the peak intensity corresponding to H2 + H3 phase transition for the NCM/CB is lower than that for NCM and NCM/C at initial cycle. As Fig. 6c and d shows, with the increase of cycle, the strength of the main peaks decreases rapidly for NCM and NCM/C, revealing that the layer structure is gradually damaged by the compressive/tensile strain resulting from the H2–H3 phase transition.49–51 And NCM/CB exhibits overlapped profiles, proving the outstanding reversibility of the H2 + H3 transition and the good structural stability.
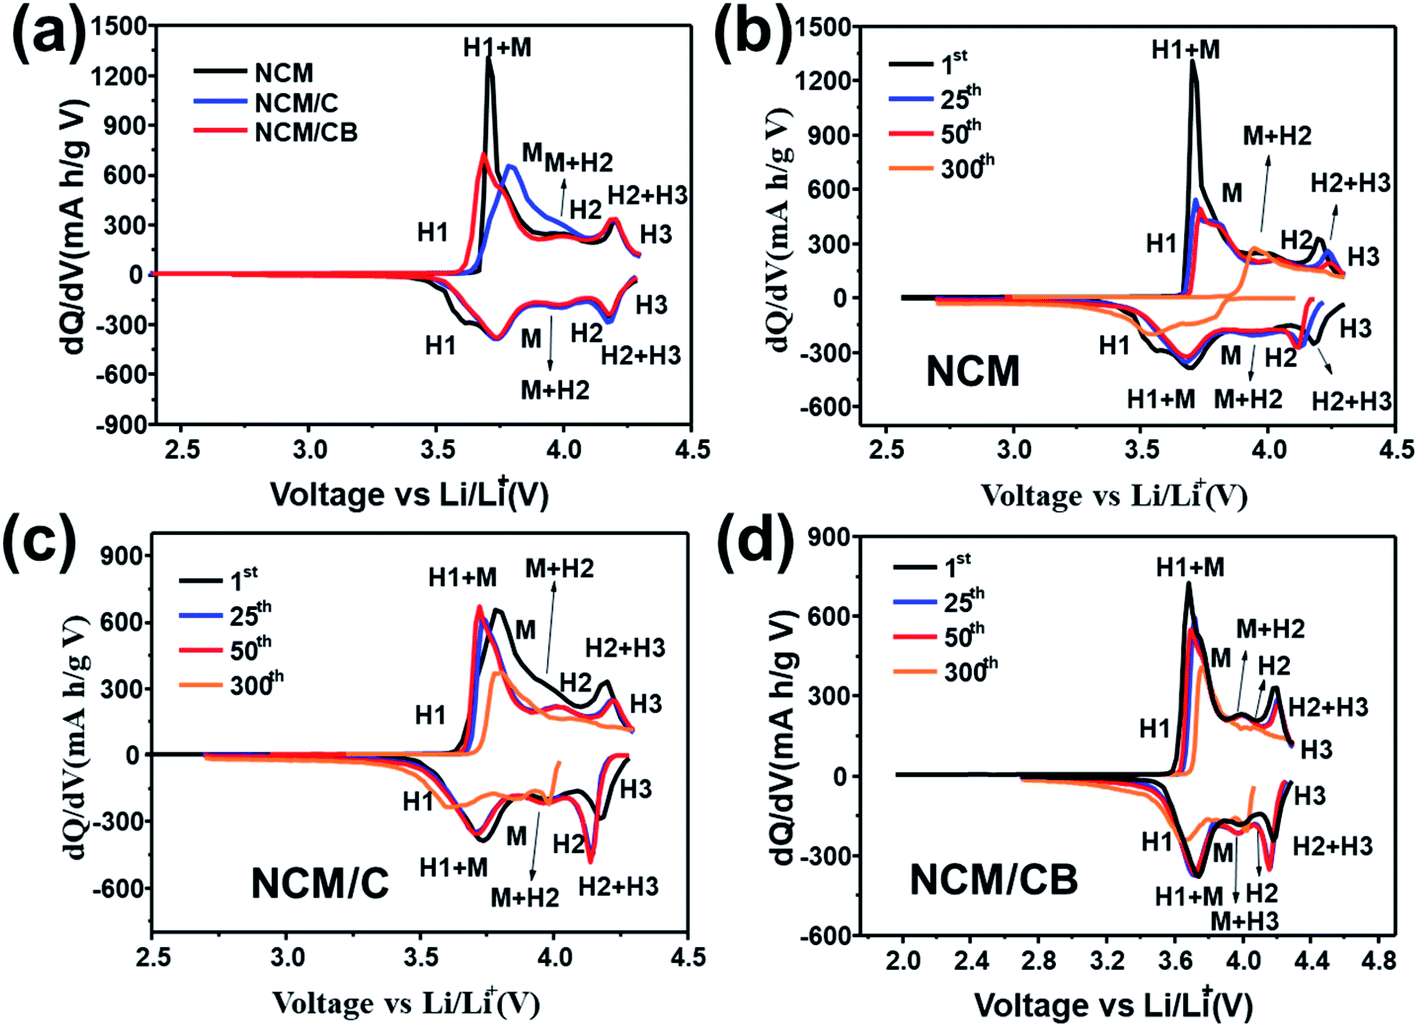 | ||
| Fig. 6 Differential capacity images of NCM, NCM/C and NCM/CB at 1st cycle (a). Differential capacity curves of NCM (b), NCM/C (c) and NCM/CB (d) at different cycle. | ||
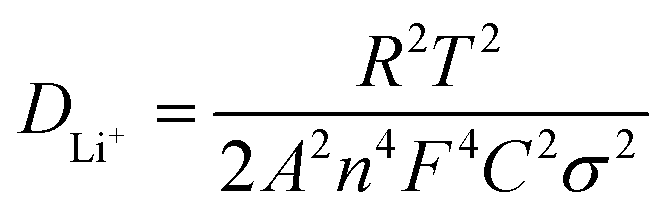
To further recognize the result of B and Co doping on the electrochemical kinetic, electrochemical impedance spectroscopy (EIS) were tested for electrodes before cycling. As Fig. 7a shows, the equivalent circuit model (inset) is form by a system resistance (Re), a constant phase element (CPE1), a charge-transfer resistance (Rct), and a Warburg impedance (W1). The surface charge transfer resistance is 71.28, 40.62 and 35.61 Ω for NCM, NCM/C and NCM/CB. The smaller Rct value of NCM/CB shows the improved ionic conductivity caused by the co-doping. The diffusion coefficient of lithium ion is calculated and the formula is as follows.
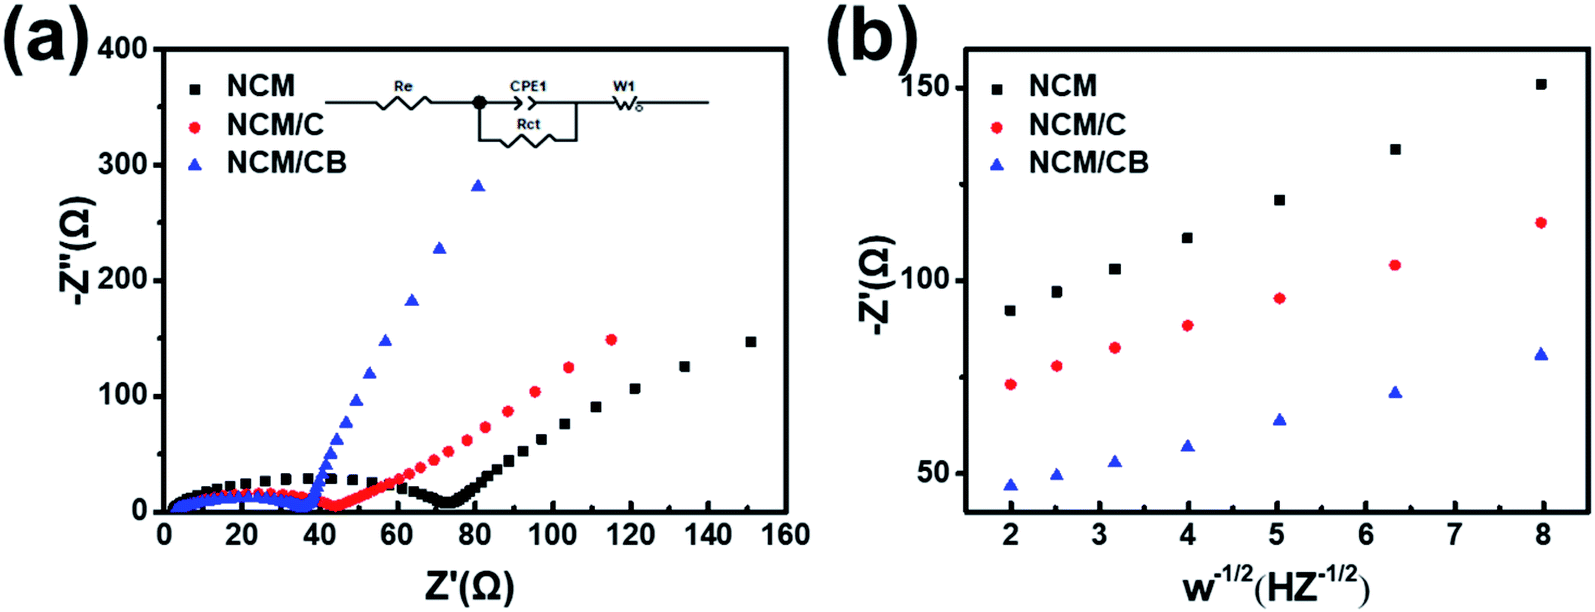 | ||
| Fig. 7 (a) EIS spectra before cycling. (b) Connection between real parts of the complex impedance and ω−1/2. | ||
The apparent lithium ion diffusion coefficient of NCM, NCM/C and NCM/CB were obtained to be 2.5996 × 10⁻¹² cm2 s−1, 5.2406 × 10⁻¹² cm2 s−1 and 7.7077 × 10⁻¹² cm2 s−1, correspondingly. Since the alike particle size, the lesser Rct and improved mobility of lithium ions of co-doping sample are caused by co-doping.
As shown in Fig. 8, the clear peak shift of (003) and existence of peak in the dQ/dV indicate that NCM/CB electrode suffers from incessant phase transition including the phase of H1, M, H2 and H3 At the beginning, as the distance between the layers increases, an irreparable structural transition occurs from H1 to M with the increase of delithiation at 3.6–3.8 V.39 At the same time, the (003) peak moves marginally to a lower angle. When further charged to 4.0 V, M and H2 phase are coexisted in the electrode, accompanying the change of (003) to a lower angle. When the charging finished (4.0–4.2 V), the phase transition from H2 to H3 originates from the destruction of the LiO6 layer caused by delithiation, in the company of the change of (003) peak to higher angle. During the discharge procedure, the (003) peak displays a similar angle change almost with the charging procedure, which means that the NCM/CB electrode has excellent structural reversibility.52,53
 | ||
| Fig. 8 (a) Ex situ XRD patterns of NCM/CB during the first charging/discharging procedure at 0.1C. (b) Corresponding charging/discharging curves. The ex situ XRD patterns of NCM/CB (c) and NCM (d) electrodes at dissimilar cycles at 1.0C. | ||
To further demonstrate the excellent structural stability of NCM/CB, ex situ XRD is used to analyze the structural stability of these materials after different cycles. It can be seen that (Fig. 8c and d) NCM/CB has better structural stability than NCM. It could be predicted that NCM/CB retains high reaction and kinetic activity during charge/discharge procedures on account of the well-maintained crystal structure.
Conclusion
In this work, minor content of Co and B were doped into the crystal of LiNi0.8Co0.1Mn0.1O2 cathode with cobalt acetate and boric acid. The doped material exhibits significant enhanced cycle stability (86.1% capacity retention at 1C after 300 cycle), especially at high rate (81.9% capacity retention at 5C after 300 cycle). The reasons for the improved structure stability, enhanced rate performance and cycle life of the cathode could be attributed to the reduced energy barrier of the Li+ insertion/extraction and alleviated content of Li/Ni mixing. We believe that this method will offer a directorial significance for the synthesis of other high-performance layered cathode materials.Conflicts of interest
There are no conflicts to declare.Acknowledgements
This work was supported by the National Natural Science Foundation of China (grant no. 21878195, 21805198, 21805018), Distinguished Young Scholars of Sichuan University (2017SCU04A08) and Huohua Ku project of Sichuan University (2018SCUH0094). Research Foundation for the Postdoctoral Program of Sichuan University (No. 2017SCU12018 and 2018SCU12045). Research Foundation for the Sichuan University and Zigong City Joint research project (2018CDZG-16). Thanks Dr Zhuo Zheng and for the help of data analysis.References
- Y. Xiao, X. D. Zhang, Y. F. Zhu, P. F. Wang, Y. X. Yin, X. Yang, J. L. Shi, J. Liu, H. Li, X. D. Guo, B. H. Zhong and Y. G. Guo, Adv. Sci., 2019, 1801908 CrossRef.
- G. Assat and J.-M. Tarascon, Nat. Energy, 2018, 3, 373–386 CrossRef CAS.
- H. Zhou, F. Xin, B. Pei and M. S. Whittingham, ACS Energy Lett., 2019, 4, 1902–1906 CrossRef CAS.
- F. Wu, N. Liu, L. Chen, Y. Su, G. Tan, L. Bao, Q. Zhang, Y. Lu, J. Wang and S. Chen, Nano Energy, 2019, 59, 50–57 CrossRef CAS.
- Y. Meesala, A. Jena, H. Chang and R.-S. Liu, ACS Energy Lett., 2017, 2, 2734–2751 CrossRef CAS.
- M. D. Radin, J. Vinckeviciute, R. Seshadri and A. Van der Ven, Nat. Energy, 2019, 4, 639–646 CrossRef CAS.
- L. Qiu, W. Xiang, W. Tian, C.-L. Xu, Y.-C. Li, Z.-G. Wu, T.-R. Chen, K. Jia, D. Wang, F.-R. He and X.-D. Guo, Nano Energy, 2019, 63, 2211–2855 CrossRef.
- X. Zeng, M. Li, D. Abd El-Hady, W. Alshitari, A. S. Al-Bogami, J. Lu and K. Amine, Adv. Energy Mater., 2019, 1900161 CrossRef.
- U.-H. Kim, H.-H. Ryu, J.-H. Kim, R. Mücke, P. Kaghazchi, C. S. Yoon and Y.-K. Sun, Adv. Energy Mater., 2019, 1803902 CrossRef.
- G. Chen, J. An, Y. Meng, C. Yuan, B. Matthews, F. Dou, L. Shi, Y. Zhou, P. Song, G. Wu and D. Zhang, Nano Energy, 2019, 57, 157–165 CrossRef CAS.
- T. Weigel, F. Schipper, E. M. Erickson, F. A. Susai, B. Markovsky and D. Aurbach, ACS Energy Lett., 2019, 4, 508–516 CrossRef CAS.
- W. Li, X. Liu, H. Celio, P. Smith, A. Dolocan, M. Chi and A. Manthiram, Adv. Energy Mater., 2018, 8, 1703154 CrossRef.
- Y. You, H. Celio, J. Li, A. Dolocan and A. Manthiram, Angew. Chem., Int. Ed., 2018, 57, 6480–6485 CrossRef CAS.
- Y. Su, G. Chen, L. Chen, Y. Lu, Q. Zhang, Z. Lv, C. Li, L. Li, N. Liu, G. Tan, L. Bao, S. Chen and F. Wu, ACS Appl. Mater. Interfaces, 2019, 11, 36697–36704 CrossRef CAS.
- T. Hatsukade, A. Schiele, P. Hartmann, T. Brezesinski and J. Janek, Origin of Carbon Dioxide Evolved during Cycling of Nickel-Rich Layered NCM Cathodes, ACS Appl. Mater. Interfaces, 2018, 10, 38892–38899 CrossRef CAS.
- U. H. Kim, D. W. Jun, K. J. Park, Q. Zhang, P. Kaghazchi, D. Aurbach, D. T. Major, G. Goobes, M. Dixit, N. Leifer, C. M. Wang, P. Yan, D. Ahn, K. H. Kim, C. S. Yoon and Y. K. Sun, Energy Environ. Sci., 2018, 11, 1271–1279 RSC.
- Y. Su, C. Gang, C. Lai, W. Li, Q. Zhang, Z. Yang, L. Yun, L. Bao, T. Jing and R. Chen, ACS Appl. Mater. Interfaces, 2018, 10, 6407–6414 CrossRef CAS.
- Z. Qiyu, S. Yuefeng, C. Lai, L. Yun, B. Liying, H. Tao, W. Jing, C. Renjie, T. Jing and W. Feng, J. Power Sources, 2018, 396, 734–741 CrossRef.
- S. Dou, L. Tao, R. Wang, S. El Hankari, R. Chen and S. Wang, Adv. Mater., 2018, 30, e1705850 CrossRef.
- C. Ma, C. Deng, X. Liao, Y. He, Z. Ma and H. Xiong, ACS Appl. Mater. Interfaces, 2018, 10, 36969–36975 CrossRef CAS.
- T. Chen, F. Wang, X. Li, X. Yan, H. Wang, B. Deng, Z. Xie and M. Qu, Appl. Surf. Sci., 2019, 465, 863–870 CrossRef CAS.
- J. An, L. Shi, G. Chen, M. Li, H. Liu, S. Yuan, S. Chen and D. Zhang, J. Mater. Chem. A, 2017, 5, 19738–19744 RSC.
- C. Xu, W. Xiang, Z. Wu, Y. Xu, Y. Li, Y. Wang, Y. Xiao, X. Guo and B. Zhong, ACS Appl. Mater. Interfaces, 2019, 11, 16629–16638 CrossRef CAS.
- M. J. Zhang, G. Teng, Y. K. Chen-Wiegart, Y. Duan, J. Y. P. Ko, J. Zheng, J. Thieme, E. Dooryhee, Z. Chen, J. Bai, K. Amine, F. Pan and F. Wang, J. Am. Chem. Soc., 2018, 140, 12484–12492 CrossRef CAS.
- Y.-D. Xu, W. Xiang, Z.-G. Wu, C.-L. Xu, Y.-C. Li, X.-D. Guo, G.-P. Lv, X. Peng and B.-H. Zhong, Electrochim. Acta, 2018, 268, 358–365 CrossRef CAS.
- B. Li, H. Yan, M. Jin, P. Yu, D. Xia, W. Huang, W. Chu and Z. Wu, Adv. Funct. Mater., 2015, 24, 5112–5118 CrossRef.
- S. W. Woo, S. T. Myung, H. Bang, D. W. Kim and Y. K. Sun, Electrochim. Acta, 2009, 54, 3851–3856 CrossRef CAS.
- Y. Su, Y. Yang, L. Chen, Y. Lu, L. Bao, G. Chen, Z. Yang, Q. Zhang, J. Wang, R. Chen, S. Chen and F. Wu, Electrochim. Acta, 2018, 292, 217–226 CrossRef CAS.
- K.-S. Lee, S.-T. Myung, J. Prakash, H. Yashiro and Y.-K. Sun, Electrochim. Acta, 2008, 53, 3065–3074 CrossRef CAS.
- Y. Liu, D. Ning, L. Zheng, Q. Zhang, L. Gu, R. Gao, J. Zhang, A. Franz, G. Schumacher and X. Liu, J. Power Sources, 2018, 375, 1–10 CrossRef CAS.
- J. Mao, K. Dai, M. Xuan, G. Shao, R. Qiao, W. Yang, V. S. Battaglia and G. Liu, ACS Appl. Mater. Interfaces, 2016, 8, 9116–9124 CrossRef CAS.
- P. Xue, S. Liu, X. Shi, C. Sun, C. Lai, Y. Zhou, D. Sui, Y. Chen and J. Liang, Adv. Mater., 2018, 30, 04165 CrossRef.
- C. L. Xu, W. Xiang, Z. G. Wu, Y. D. Xu, Y. C. Li, M. Z. Chen, X. D. Guo, G. P. Lv, J. Zhang and B. H. Zhong, ACS Appl. Mater. Interfaces, 2018, 10, 27821–27830 CrossRef CAS.
- Y. Liu, Z. Yang, J. Li, B. Niu, K. Yang and F. Kang, J. Mater. Chem. A, 2018, 6, 13883–13893 RSC.
- P. Li, S. Zhao, Y. Zhuang, J. Adkins, Q. Zhou and J. Zheng, Appl. Surf. Sci., 2018, 453, 93–100 CrossRef CAS.
- W. Xiang, W.-Y. Liu, J. Zhang, S. Wang, T.-T. Zhang, K. Yin, X. Peng, Y.-C. Jiang, K.-H. Liu and X.-D. Guo, J. Alloys Compd., 2019, 775, 72–80 CrossRef CAS.
- W. Xiang, C.-Q. Zhu, J. Zhang, H. Shi, Y.-T. Liang, M.-H. Yu, X.-M. Zhu, F.-R. He, G.-P. Lv and X.-D. Guo, J. Alloys Compd., 2019, 786, 56–64 CrossRef CAS.
- T. Chen, X. Li, H. Wang, X. Yan, L. Wang, B. Deng, W. Ge and M. Qu, J. Power Sources, 2018, 374, 1–11 CrossRef CAS.
- Y.-C. Li, W. Xiang, Y. Xiao, Z.-G. Wu, C.-L. Xu, W. Xu, Y.-D. Xu, C. Wu, Z.-G. Yang and X.-D. Guo, J. Power Sources, 2019, 423, 144–151 CrossRef CAS.
- J. S. Sanchez, A. Pendashteh, J. Palma, M. Anderson and R. Marcilla, Electrochim. Acta, 2018, 279, 44–56 CrossRef CAS.
- J. Zhu, Y. Ge, D. Kim, Y. Lu, C. Chen, M. Jiang and X. Zhang, Nano Energy, 2016, 20, 176–184 CrossRef CAS.
- C.-L. Xu, W. Xiang, Z.-G. Wu, Y.-C. Li, Y.-D. Xu, W.-B. Hua, X.-D. Guo, X.-B. Zhang and B.-H. Zhong, J. Alloys Compd., 2018, 740, 428–435 CrossRef CAS.
- C.-L. Xu, W. Xiang, Z.-G. Wu, Y.-D. Xu, Y.-C. Li, H.-T. Li, Y. Xiao, B.-C. Tan, X.-D. Guo and B.-H. Zhong, J. Alloys Compd., 2019, 777, 434–442 CrossRef CAS.
- Y.-C. Li, W. Xiang, Z.-G. Wu, C.-L. Xu, Y.-D. Xu, Y. Xiao, Z.-G. Yang, C.-J. Wu, G. P. Lv and X.-D. Guo, Electrochim. Acta, 2018, 291, 84–94 CrossRef CAS.
- B. Wu, X. Yang, X. Jiang, Y. Zhang, H. Shu, P. Gao, L. Liu and X. Wang, Adv. Funct. Mater., 2018, 28, 1803392 CrossRef.
- D. Ye, B. Wang, Y. Chen, G. Han, Z. Zhang, D. Hulicova-Jurcakova, J. Zou and L. Wang, J. Mater. Chem. A, 2014, 2, 18767–18774 RSC.
- C. Wu, Z. Zhang, Y. Tang, Z. Yang, Y. Li, B. Zhong, Z. G. Wu, X. Guo and S. X. Dou, ACS Appl. Mater. Interfaces, 2018, 28, 43740–43748 CrossRef.
- Y.-C. Li, W.-M. Zhao, W. Xiang, Z.-G. Wu, Z.-G. Yang, C.-L. Xu, Y.-D. Xu, E.-H. Wang, C.-J. Wu and X.-D. Guo, J. Alloys Compd., 2018, 766, 546–555 CrossRef CAS.
- X. Liu, G. Feng, E. Wang, H. Chen, Z. Wu, W. Xiang, Y. Zhong, Y. Chen, X. Guo and B. Zhong, ACS Appl. Mater. Interfaces, 2019, 11, 12421–12430 CrossRef CAS.
- X. Hu, H. Guo, W. Peng, Z. Wang, X. Li and Q. Hu, J. Electroanal. Chem., 2018, 822, 57–65 CrossRef CAS.
- G. Feng, X. Liu, Y. Wang, Z. Wu, C. Wu, R. Li, Y. Chen, X. Guo, B. Zhong and J. Li, RSC Adv., 2019, 9, 12710–12717 RSC.
- C. Wu, W. Hua, Z. Zhang, B. Zhong, Z. Yang, G. Feng, W. Xiang, Z. Wu and X. Guo, Adv. Sci., 2018, 5, 1800519 CrossRef.
- Y. Liu, E. Wang, R. Rajagopalan, W. Hua, B. Zhong, Y. Zhong, Z. Wu, X. Guo, S. Dou and J. Li, J. Power Sources, 2019, 412, 350–358 CrossRef CAS.
Footnote |
| † Electronic supplementary information (ESI) available. See DOI: 10.1039/c9ra07873h |
| This journal is © The Royal Society of Chemistry 2019 |