Surface engineering superparamagnetic nanoparticles for aqueous applications: design and characterization of tailored organic bilayers†
Received
30th April 2015
, Accepted 29th September 2015
First published on 30th September 2015
Abstract
Engineered superparamagnetic nanoparticles (NPs) have broad potential in biotechnologies, high contrast magnetic resonance imaging, and advanced environmental sensing and remediation technologies, among others. For successful environmental, aqueous-based applications, particle stability (as highly monodisperse and single domain nanocrystals) and specific surface functionality are critical to control. In this report, aqueous stabilization of 8 nm superparamagnetic iron oxide NPs is described and optimized using a series of surface engineered bilayers, exploring 13 ionic surfactants, which are systematically varied with regard to hydrophobic tail (size and properties) and polar head groups. As monodispersed aqueous suspensions, material libraries were evaluated through particle–particle aggregation kinetics (with varied ionic types and strengths) and long-term aqueous stabilities (up to one year). Optimal phase transfer approaches are presented, along with corresponding particle stability characterization data sets for each of the 13 ligands studied, which, when taken together, allow for flexible surface design strategies for a variety of superparamagnetic particle-based aqueous applications.
Nano impact
Advances in nanoscale engineering and material science not only allow for the precise size, shape and composition control of engineered nanoparticles, but also for tunable surface modification techniques needed aqueous stability for advanced environmental applications. In this report, we have systematically designed, synthesized, and evaluated water stable, 8 nm superparamagnetic iron oxide nanoparticles with a rational series of 13 bilayer surface structures. Detailed synthesis strategies, process efficiencies, and fundamental properties of each resulting particle suspension are summarized and compared under environmentally relevant conditions. Findings directly advances current knowledge for needed control/tailoring of particle surface chemistries with regard application of engineered superparamagnetic nanoparticles, which have broad, yet unique potential in next generation remediation and sensing environmental technologies, among others.
|
Introduction
Engineered magnetic nanoparticles (NPs) have attracted significant research interest over a variety of disciplines. In addition to large specific surface areas and typically high activities, tunable magnetic properties are key for advanced technological applications.1–3 Among such materials, iron oxide NPs are the most developed with potential applications in biomedical, biotechnology, data storage, catalysis, physical and environmental areas, among others, based on controllable size and shape, biocompatibility (typically low toxicity), and high surface affinity for heavy metal and metalloid ions.4–14 In particular, aqueous based magnetic fluids (ferrofluids) composed of single-domain iron oxide NPs have been used in various biological and medical applications.3,15 As an example, superparamagnetic, single-domain iron oxide NPs are used as T2 contrast agents, which induce (enhance) excitation and differential relaxation of surrounding protons, for magnetic resonance imaging (MRI) applications in clinical medicine and subsurface sensing.10,16,17 To achieve aqueous stabilities needed for such technologies, magnetic NPs are often surface modified with surfactant-type layers (mono- and bi-layers), with outwardly facing hydrophilic functional groups (e.g. carboxylic acids).18–21
Room temperature, aqueous-based, co-precipitation methods, using ferrous and ferric salts, are widely used to obtain relatively large amounts of ‘hydrophilic’ iron oxide NPs.3 Although the procedure is simple and convenient, this method is limited due to poor control over particle size (i.e. broad size distribution) along with the formation of large, non-stable aggregates.9,22 In contrast, iron oxide NPs with tunable sizes, narrow size distribution, and high (even single) crystallinity can be synthesized via decomposition of iron precursor(s) at high temperature (over 260 °C) in organic, apolar solvents.23,24 Various iron precursors, including iron cupferron, iron pentacarbonyl, iron acetylacetonate, and iron oleate have been used to prepare monodisperse iron oxide NPs for a range of particle sizes (4–30 nm).3,25 For such methods, oleic acid is widely used as a surface stabilizer during synthesis.5 The carboxylate group from oleic acid is chemisorbed onto the oxide surface as the NP is formed, with the hydrophobic long alkyl chain (C18) interfacing with the nonpolar solution. As a result, the NPs synthesized from this approach are monodispersed and stable in apolar organic solvents (e.g. hexane, chloroform, toluene, etc.).5,26 For effective phase transfer into water, additional surface modification is required.
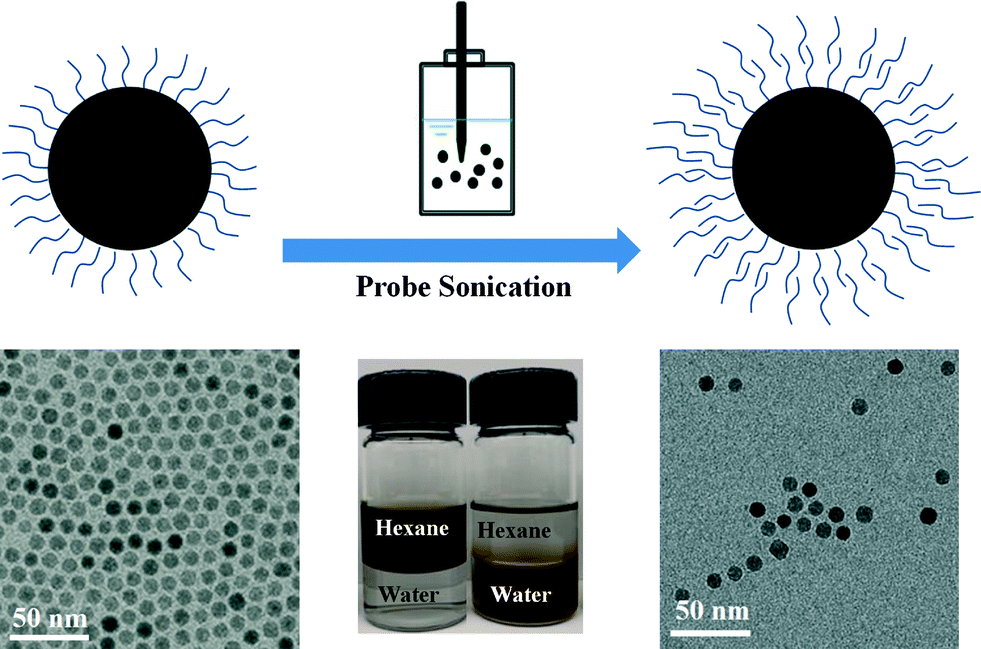
Various natural and synthetic surfactants, macromolecules, polyelectrolytes and polymers have been studied for the surface modification of engineered NPs.6,27–29 Ligand exchange and ligand addition(s) are two general strategies for NPs phase transfer (from an organic phase into water), which also typically require energy input in the form of mixing/stirring and/or sonication to facilitate the transfer process.9,30 For ligand exchange methods, original hydrophobic coatings associated with the NP surface are replaced by suitable amphiphiles which have both a high affinity for the NP surface and aqueous (hydrophilic) interface.5 In ligand addition methods (bilayer methods), the hydrophobic tail of the secondary ligand interacts with the first layer's hydrophobic tail, to effectively form a bilayer coating (as depicted in Fig. 1).31 The hydrophilic end of the secondary layer orients outward, allowing for phase transfer and aqueous stability.32 Depending on the balance of steric stabilization and bilayer stability during the phase transfer process, particles can be engineered to remain highly monodispersed and stable in the aqueous phase.31
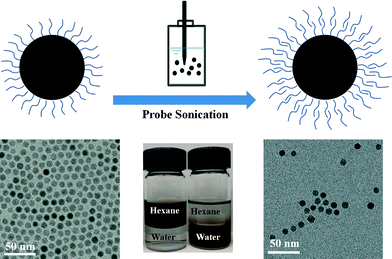 |
| | Fig. 1 Schematic representation for the phase transfer of NPs from nonpolar solvent to aqueous solution facilitated by a bilayer structure formation process. | |
In this work, 8 nm, monodisperse iron oxide, superparamagnetic NPs were prepared by pyrolysis of iron carboxylate salts in the presence of oleic acid and 1-octadecene. These particles were correspondingly transferred into water via a tailored ligand addition (bilayer formation) approach, which were characterized over a range of transfer conditions, including 13 different ligand types. Bilayer phase transfer procedures were optimized and reported based on transfer yield as a function of sonication amplitude, sonication time and surfactant concentration used for each ligand. Resulting aqueous NPs suspensions were characterized through transmission electron microscope (TEM) and surface charge via zeta (ζ) potential measurements. For each of the 13 surface stabilization strategies (bilayers), NP aggregation kinetics and long-term colloidal stabilities are quantitatively described as a function of ionic strength/type and storage time using time-resolved dynamic light scattering (TR-DLS).
Experimental
Materials
Iron(III) oxide (hydrated, catalyst grade, 30–50 mesh), oleic acid (technical grade, 90%), 1-octadecene (technical grade, 90%), oleic acid (OA, 99%), elaidic acid (EA, 99.0%), sodium stearate (SA, 99.0%), sodium palmitate (PA, 98.5%), sodium myristate (MA, 99%), sodium laurate (LA, 99%), sodium decanoate (DA, 98%), sodium monododecyl phosphate (SDP), sodium dodecyl sulfate (SDS, 99.0%), dodecyltrimethylammonium bromide (C12TAB, 98%), N,N-dimethyl-N-dodecylglycine betaine (EMPIGEN), sodium chloride (ACS reagent, 99.0%), calcium chloride dihydrate (ACS reagent, 99%), and nitric acid (trace metal grade) were all purchased from Sigma-Aldrich. Sodium ricinolate (RA, 90%) and sodium dodecylbenzenesulfonate (SDBS, 95%) were purchased from TCI America. Reagent grade of hexane, acetone, and ethanol were purchased and used without purification.
Synthesis of iron oxide NPs
Iron oxide NPs were prepared using a method previously reported.24 To synthesize 8 nm iron oxide NPs, 0.178 g FeO(OH) fine powder, 2.26 g oleic acid and 5.0 g 1-octadecene were stirred in a three-neck flask equipped with a heating mantle and temperature controller. The system was kept at 120 °C for 1 h to remove residual water and then heated to 320 °C for 1 h under argon condition. After the reaction at high temperature, the resulting brown-black colloid was purified by acetone and methanol; for details, the synthesized colloid (10 ml) was collected in a centrifuge tube mixing with 40 ml of ethanol/acetone solution and centrifuged at 6000 rpm for 15 min. This procedure was repeated 4–5 times to remove unreacted iron salts, excess organic moieties. Purified iron oxide NPs were finally collected in hexanes and stored at 4 °C.
Phase transfer of iron oxide NPs
The purified NPs were transferred from hexane to water by ligand addition (bilayer) method using a probe sonicator.10,31 Specifically, 1.0 mL of NPs in hexane solution (1–5 g L−1) and variable amounts of ligand were added to 10 mL of ultrapure water (Millipore, 18.2 Ω) in a glass vial. The mixture of organic and aqueous phase was then subjected to a probe sonicator (UP 50H, Dr. Hielscher, GMHB) for 3–6 min at various amplitude (60–75%) and full cycle. The cloudy and colored suspension after sonication was kept stirred for 1 day for the evaporation of residual hexane. The aqueous phase was collected and the NPs were purified via ultracentrifugation (Sorvall WX Ultra 80, Thermo scientific), membrane filtration (Ultrafiltration cellulose membranes, 100 KDa MWCO), followed by redispersion and filtration through a syringe filter (pore size of 0.2 um, Millipore).
Transmission electron microscope (TEM)
NPs core size was characterized by transmission electron microscopy (TEM, FEI Tecnai G2 Spirit) operated at 120 kV. TEM samples were prepared by placing a small drop (10 uL) of the diluted NPs suspension on a carbon coated copper grids (Electron Microscopy Sciences) and left to dry at room temperature (22 ± 0.5 °C). The average diameter (with size distribution) was obtained by counting more than 1000 randomly chosen NPs from the TEM micrographs using ImageJ software (National Institutes of Health).
Inductively coupled plasma optical emission spectroscopy (ICP-OES)
To determine the iron concentration of NPs in both hexane and water, iron oxide NPs were digested by strong nitric acid (10%) and analyzed with inductively coupled plasma optical emission spectroscopy (ICP-OES, Perkin Elmer ELAN DRC).
Total organic carbon (TOC)
Bi-layers coating surface concentrations were quantified using a total organic carbon analyzer (TOC-L, Shimadzu Scientific Instrument, Inc., MD; 680 °C), similar to others studying inorganic nanoparticles stabilized by organic coatings.33,34 All NPs samples were diluted to the same concentration (as Fe). Before measurement, samples were acidified (HCl) to remove any inorganic carbonates.
Superconducting quantum interference device (SQUID)
Magnetization measurements were carried out with a superconducting quantum interference device (SQUID) magnetometer (Quantum Design MPMS 5XL SQUID). Magnetization and hysteresis data were collected at a temperature of 300 K up to 5 T with powders of NPs.
Solution chemistry
Serial concentrations of salt stock solutions (ACS grade NaCl and CaCl2) were prepared and filtrated (pore size of 0.2 μm, Millipore) before use. All DLS and zeta potential measurements were conducted at room temperature (22 ± 0.5 °C).
Dynamic light scattering (DLS)
The hydrodynamic diameters and zeta (ζ) potentials of NPs in water were measured by dynamic light scattering (Zetasizer, Malvern Nano ZS, UK). Triplicate samples were prepared and measured for the size and zeta potential analysis. The average value and the standard deviation of size and zeta potential were calculated from at least 5 measurements.
Aggregation kinetics
The aggregation kinetics of iron oxide NPs in the presence of salt was examined by DLS equipped with a HeNe 633 nm laser (Zetasizer, Malvern Nano ZS), operating in backscattering mode at a scattering angle of 173°. Before each aggregation measurement, a predetermined volume of NPs stock solution and ultrapure water were added into a vial and pH was adjusted to 7.0 ± 0.2. Then a certain amount of salt solution was added into the vial to make the total volume of sample to be 1 mL and the concentration of NPs (as Fe) was 1 mg L−1. Samples were transferred into the DLS measurement chamber after a short time of vortex. Data points were measured every 15 s and recorded continuously for 20 to 60 min, depending on the aggregation rate of each sample. The attachment efficiency, α, of the iron oxide NPs in the presence of monovalent (Na+) and divalent (Ca2+) cations was calculated by the following equation:35
where k is the initial aggregation rate constant at examined salt concentrations and kfast is the aggregation rate under diffusion-limited (fast) aggregation conditions.
Results and discussion
Bilayer phase transfer strategies
Fig. 1 schematically illustrates the general procedure of the bilayer phase transfer approach used in this study. 8.1 ± 0.6 nm iron oxide NPs were prepared from decomposition of iron carboxylate in organic media (1-octadecene) and surface stabilized (in organic phase) with oleic acid. These materials were chosen as they are not only relevant to environmental sensing and remediation applications,4,8,10,11,14 but also because they can be synthesized as highly monodispersed NPs with narrow size distribution as seen from Fig. 1. SQUID analysis indicates these NPs are superparamagnetic at 300 K with negligible coercivity, thus net magnetization of zero in the absence of an external magnetic field (Fig. S1 in the ESI†).
Bilayer formations were achieved by mixing varied amounts of select surfactant with iron oxide NPs suspension in hexane and ultrapure water (two phases) via probe sonication, as detailed in Tables S1–S12 for each ligand in the ESI.† This process of particle transfer and subsequent stabilization from hexane into water is visualized in Fig. S2 in the ESI.† For all systems described, when NPs are transferred from hexane into water, they remain monodispersed as observed from TEM micrographs (Fig. 1 and Fig. S3 in the ESI†) and DLS data (Table 1).
Table 1 Optimized phase transfer conditions for colloidally stable iron oxide NPs using different surfactants
| Outer layer |
Amplitude (%) |
Surfactant conc. (mM) |
Sonication time (min) |
Hydrodynamic size (nm) |
Maximum transfer yield (%) |
| Oleic acid |
60 |
10–30 μL |
5 |
15.6 ± 1.3 |
70 |
| Ricinoleic acid |
70 |
10–20 |
5 |
20.9 ± 1.7 |
85 |
| Elaidic acid |
75 |
50 μL |
4–6 |
18.5 ± 4.3 |
26 |
| Stearic acid |
70 |
10 |
5 |
17.1 ± 2.1 |
75 |
| Palmitic acid |
65 |
5–20 |
6 |
23.2 ± 2.8 |
70 |
| Myristic acid |
65 |
5–20 |
4–5 |
20.9 ± 1.4 |
84 |
| Lauric acid |
75 |
10 |
3–4 |
19.2 ± 0.4 |
89 |
| Decanoic acid |
75 |
5–10 |
4–5 |
25.1 ± 0.7 |
59 |
| SDP |
70 |
10 |
3–4 |
23.4 ± 3.5 |
95 |
| SDS |
70 |
5–20 |
3–4 |
20.6 ± 0.7 |
79 |
| SDBS |
70 |
10–20 |
5–6 |
18.2 ± 3.4 |
68 |
| C12TAB |
75 |
10 |
4 |
20.7 ± 1.0 |
47 |
| EMPIGEN |
70 |
40 |
5–6 |
17.3 ± 1.5 |
68 |
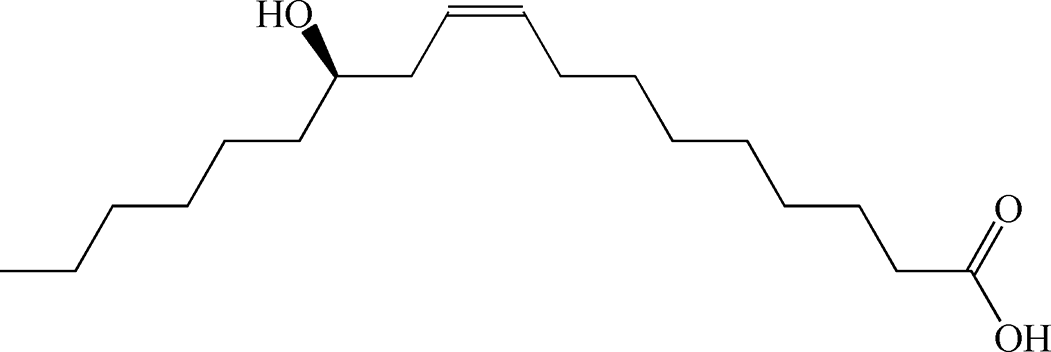
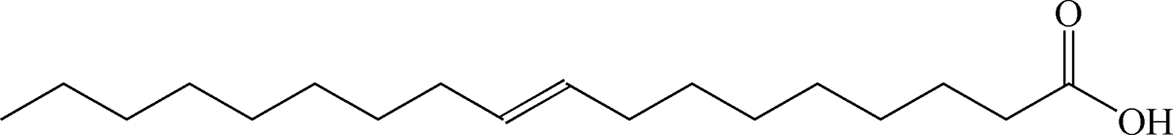
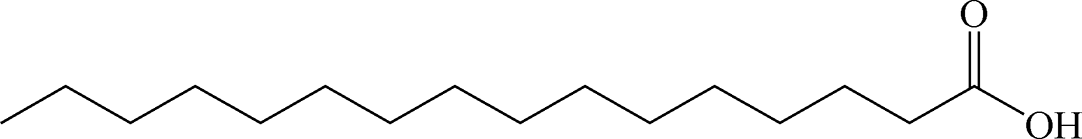
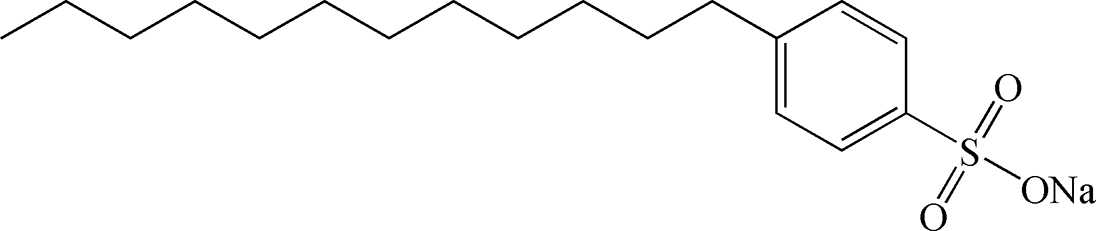
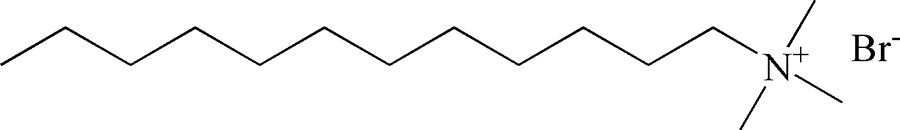
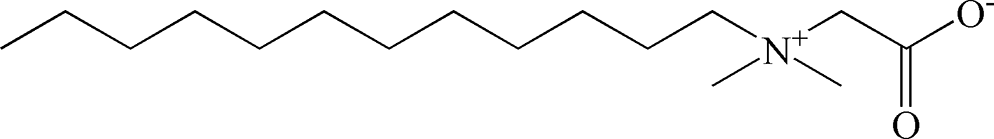
Table 1 summarizes the optimized conditions (taken from Tables S1–S12 in the ESI†) for 11 negatively charged, 1 positively charged and 1 zwitterionic surfactant as the second, outer layer (oleic acid remains as the first layer). Table 2 depicts the chemical structure for each, including unsaturated or saturated organic acids containing one- or multi-functional groups, such as oleic acid (OA), ricinoleic acid (RA), elaidic acid (EA), stearic acid (SA), palmitic acid (PA), myristic acid (MA), lauric acid (LA), and decanoic acid (DA), which maintain a carboxylic functional head group.31,36 A series of ionic surfactants that are similar in hydrophobic tail size (C12) and properties (saturated, aliphatic) but have systematically varied polar head groups are also evaluated. These surfactants include C12TAB (dodecyltrimethylammonium bromide) which has a positively charged head group; SDS (sodium dodecyl sulfate) with a negatively charged, sulfate head group; EMPIGEN (N,N-dimethyl-N-dodecylglycine betaine), which has a zwitterionic head group; SDBS (sodium dodecylbenzenesulfonate), which contains a benzene ring before the terminal group, lowering the overall (end) charge and providing an aromatic group near surface; and last, SDP (sodium monododecyl phosphate), which has a phosphate head group with a net −2 ionic head charge.12,15,21,37–43
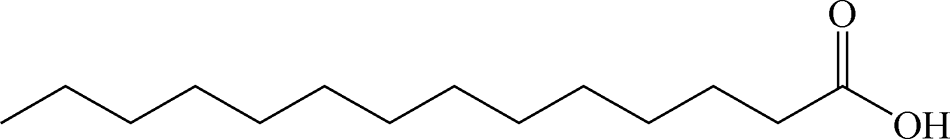
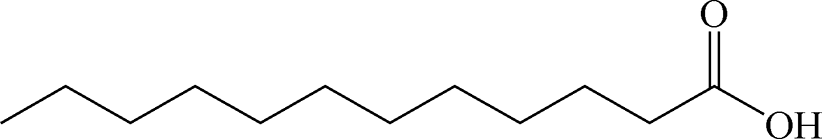
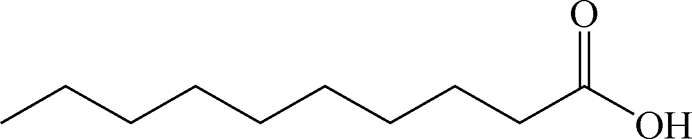
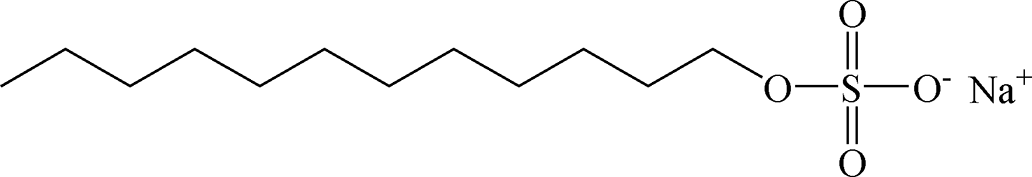
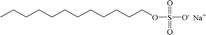
Table 2 Chemical structure of surfactants tested
| Outer layer |
Type |
Chemical structure |
| Oleic acid |
Anionic |
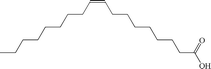
|
| Ricinoleic acid |
Anionic |

|
| Elaidic acid |
Anionic |
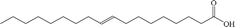
|
| Stearic acid |
Anionic |
|
| Palmitic acid |
Anionic |

|
| Myristic acid |
Anionic |
|
| Lauric acid |
Anionic |

|
| Decanoic acid |
Anionic |
|
| SDP |
Anionic |
|
| SDS |
Anionic |
|
| SDBS |
Anionic |
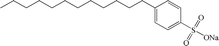
|
| C12TAB |
Cationic |
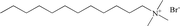
|
| EMPIGEN |
Zwitterionic |
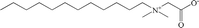
|
For each ligand, Tables S1–S12 in the ESI† show the detailed hydrodynamic diameter and transfer yield as a function of sonication amplitude, sonication time and surfactant concentration tested. The sonication amplitude used in our study ranges between 60% and 75% (UP 50H, 50 watts, 30 kHz). We observed that it was not efficient to transfer these NPs from hexane into water when the sonication amplitude was below 50%, and while under high sonication amplitude (>90%), aggregates of NPs were seen during the transfer process. Typically, phase transfer process was completed in a short time (3–6 min), and longer sonication time did not further improve the phase transfer efficiencies. After phase transfer and purification (ultracentrifugation, ultrafiltration and syringe filtration described above), aqueous NP suspensions were characterized by DLS at room temperature and stored in the dark. For most, the hydrodynamic diameter of NPs coated with bilayered surface stabilizers are around 20 nm, indicating these NPs have a very thin and compact (bilayer) coating structures. Oleic acid (OA) bilayer coated NPs have the smallest hydrodynamic size of 15.6 ± 1.3 nm while the decanoic acid (DA) coated NPs have the largest hydrodynamic size of 25.1 ± 0.7 nm. Phase transfer yield (%) was calculated by measuring the total iron concentration transferred to water compared to initial iron concentration added to the hexane solution. The highest observed yield was 95% for SDP coated NPs, which as a phosphate has the highest formal charge (−2) head group of all ligands evaluated, while C12TAB and elaidic acid surfactant reached a maximum of 47% and 26%, respectively. Generally, most of the surfactants allow for relatively high transfer efficiencies but never reaching 100% due to the difficulty to mixing limitations and interfacial partitioning of/at the two different phases.31 For optimized phase transfer conditions, particle coating densities, as measured by total organic carbon (TOC), for the 13 surfactants (as outer layers) range from 80–105 ppm (ca. 4900–6650 mol of outer layer surfactant per mol NP, or as 3.16–5.0 × 10⁻⁵ mol outer layer surfactant per m2 of NP as tabulated in Table S13, in the ESI†). Similar coating densities allow for surface charge, aggregation kinetic(s), and colloidal stability comparisons, which are discussed below.
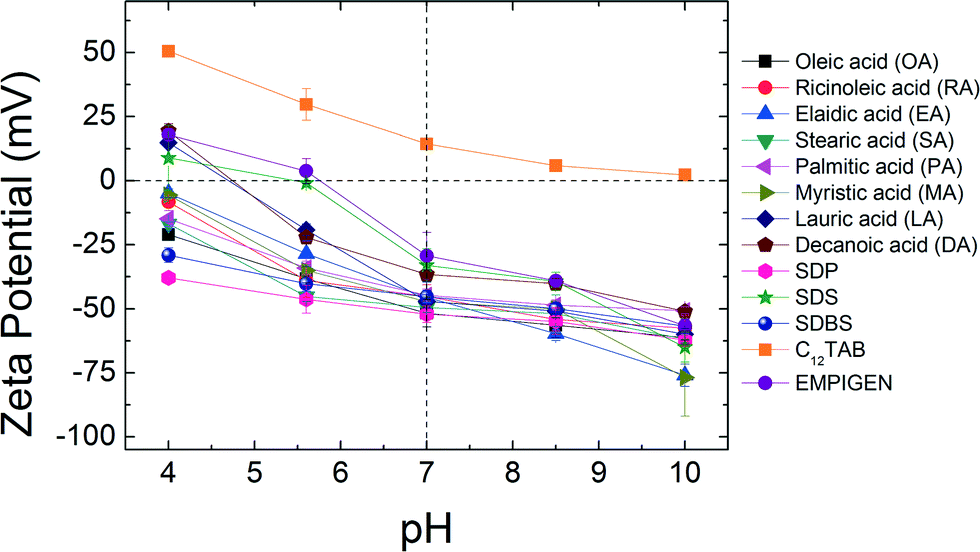
Surface charge
Zeta potential measurements were conducted at pH 4.0, pH 5.6, pH 7.0, pH 8.5 and pH 10.0 at room temperature (22 ± 0.5 °C) for each (optimized) NPs aqueous suspension (Fig. 2). As expected, at elevated pH, NPs surface charge relatively increases (for negatively charged particles) while at lower pH, they become more positively charged. For example, ζ-potential values of lauric acid coated NPs (LA-NPs) went from −60.0 ± 2.24 mV to +14.9 ± 1.38 mV as pH decreased from 10.0 to 4.0. The outer coatings can also affect the surface charge of NPs to varying degrees. While ζ-potentials of OA, RA, EA, SA, PA, MA, SDP, and SDBS coated NPs remain negatively charged for the entire range of pH values examined in this study, ζ-potentials of C12TAB remain positive. For LA, DA, SDS and EMPIGEN coated NPs, ζ-potentials changed from positive to negative as pH increased from 4.0 to 10.0. Under neutral pH condition, the absolute zeta potential values of all the bilayer coated NPs are far from zero, which is key for aqueous stability via electrostatic repulsion forces.5
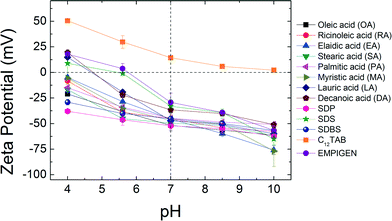 |
| | Fig. 2 Zeta potentials of bilayer coated NPs as a function of pH. | |
Aggregation kinetics
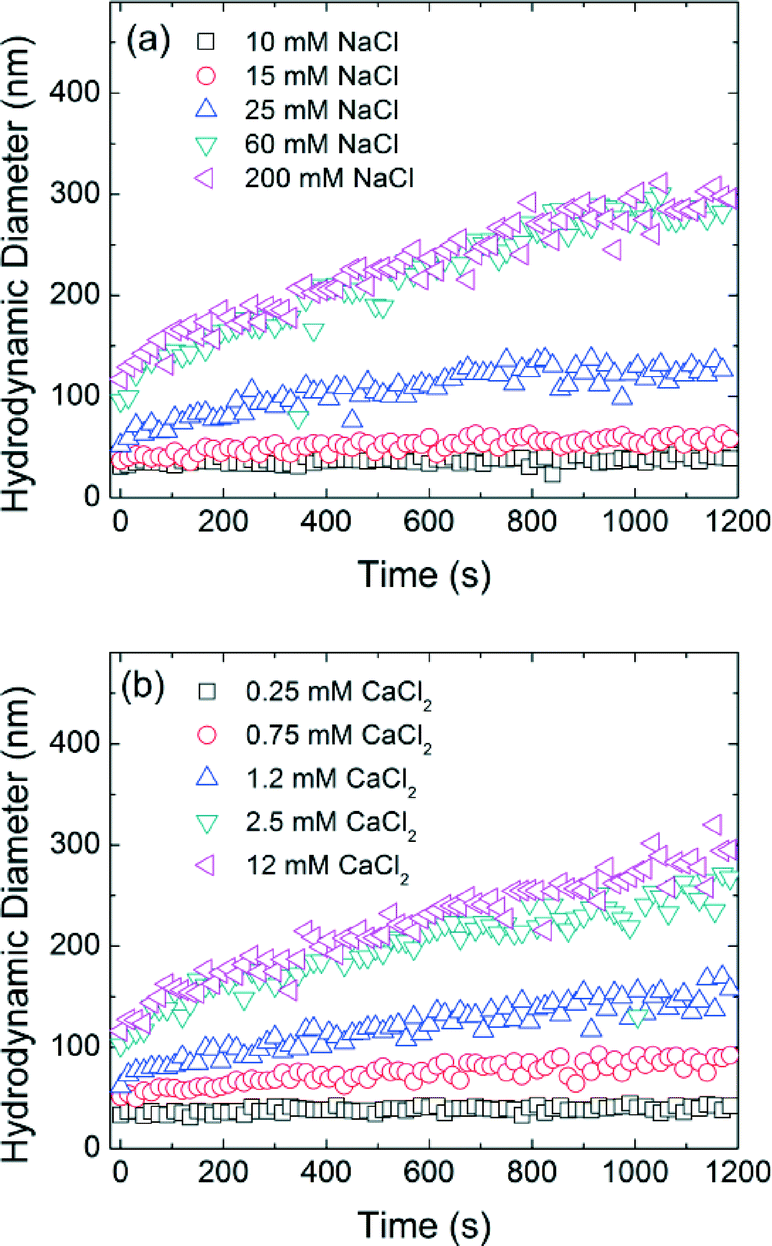
Time resolved dynamic light scattering (TR-DLS) is widely used to compare and describe aggregation behavior of engineered NPs.6,27,44–47 Here, as an example, Fig. 3 shows the aggregation profiles of decanoic acid coated iron oxide NPs (DA-NPs) in the presence of varied NaCl and CaCl2 concentrations at pH 7.0. A linear increase in the hydrodynamic diameter of NPs is observed during the early aggregation stage and the aggregation rate then decreases as the particle concentration correspondingly decreases (with aggregation occurrence).45 The initial aggregation rate of DA-NPs increased from 0.015 nm s−1 to 0.212 nm s−1 when the NaCl concentration was increased from 10 mM to 25 mM. However, the aggregation rates are similar at 60 mM NaCl (0.282 nm s−1) and 200 mM NaCl (0.293 nm s−1) concentrations, indicating the aggregate rate is invariant to the additional increase in higher salt concentration. In the presence of a divalent cation (Ca2+), similar behavior was observed, but at relatively lower cation concentrations. The aggregation rate was calculated to be 0.156 nm s−1 in the presence of 1.2 mM Ca2+, which is more than 10-folds of the aggregation rate in the presence of 10 mM Na+. Due to the effective charge neutralization capacity/association by divalent cation, Ca2+ is more efficient in destabilizing the NPs, which has been widely observed by others.35,45,46
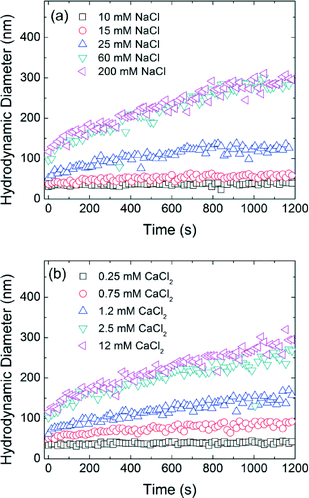 |
| | Fig. 3 Aggregation profiles of DA-NPs in the presence of (a) NaCl and (b) CaCl2 at pH 7.0. | |
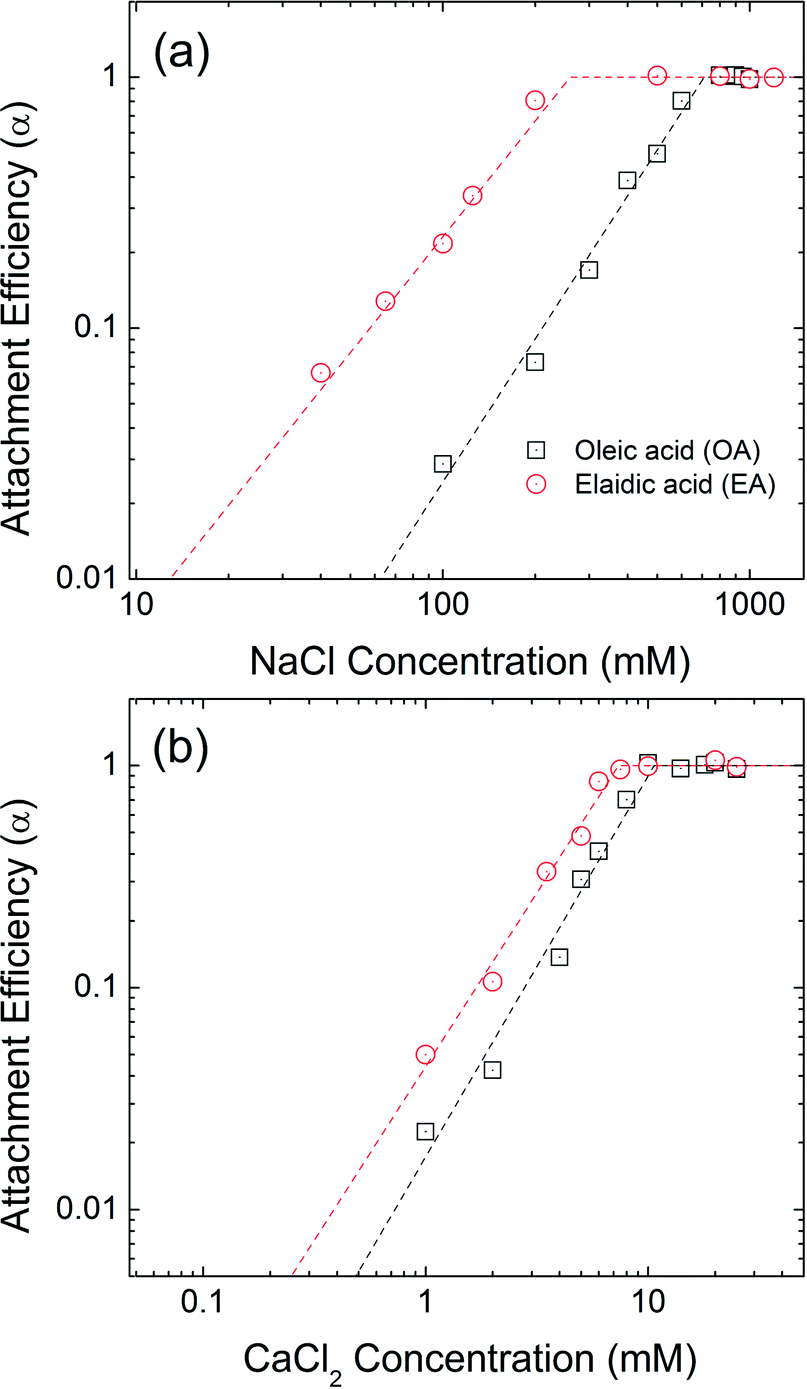
Isomeric effect
The aggregation attachment efficiencies (α) of oleic acid (OA) and elaidic acid (EA), which are cis and trans with regard to the C9![[double bond, length as m-dash]](https://www.rsc.org/images/entities/char_e001.gif) C10 double bond, respectively, coated NPs as a function of electrolyte concentrations (NaCl and CaCl2) are shown in Fig. 4. Observed aggregation profiles clearly follow classical DLVO type interactions where electrostatic repulsion and van der Waals attraction forces dominate particle stability.46,48 At low salt concentration (reaction-limited regime), an increase in the electrolyte concentration provides more cations to effectively neutralize the surface charge of NPs, leading to an increase in the attachment efficiency value due to decreased energy barriers to aggregation between charged NPs. EA-NP α values increased from 0.066 to 0.807 when NaCl was increased from 40 mM to 200 mM. When the salt concentration was high enough to suppress the energy barrier for aggregation, α reached 1, meaning virtually all collisions between NPs result in aggregation. This regime is defined as diffusion-limited regime. Similar aggregation behaviors were also found in other bilayer coated NPs.35,44–46 The critical coagulation concentration (CCC) value is derived from the intersection of the extrapolation from the diffusion-limited (fast aggregation) and reaction-limited (slow aggregation) regimes.44,49 For reference, a summary of CCC values for all 13 bilayers described, as a function of NaCl and CaCl2, is presented in Table S14 in the ESI.†
C10 double bond, respectively, coated NPs as a function of electrolyte concentrations (NaCl and CaCl2) are shown in Fig. 4. Observed aggregation profiles clearly follow classical DLVO type interactions where electrostatic repulsion and van der Waals attraction forces dominate particle stability.46,48 At low salt concentration (reaction-limited regime), an increase in the electrolyte concentration provides more cations to effectively neutralize the surface charge of NPs, leading to an increase in the attachment efficiency value due to decreased energy barriers to aggregation between charged NPs. EA-NP α values increased from 0.066 to 0.807 when NaCl was increased from 40 mM to 200 mM. When the salt concentration was high enough to suppress the energy barrier for aggregation, α reached 1, meaning virtually all collisions between NPs result in aggregation. This regime is defined as diffusion-limited regime. Similar aggregation behaviors were also found in other bilayer coated NPs.35,44–46 The critical coagulation concentration (CCC) value is derived from the intersection of the extrapolation from the diffusion-limited (fast aggregation) and reaction-limited (slow aggregation) regimes.44,49 For reference, a summary of CCC values for all 13 bilayers described, as a function of NaCl and CaCl2, is presented in Table S14 in the ESI.†
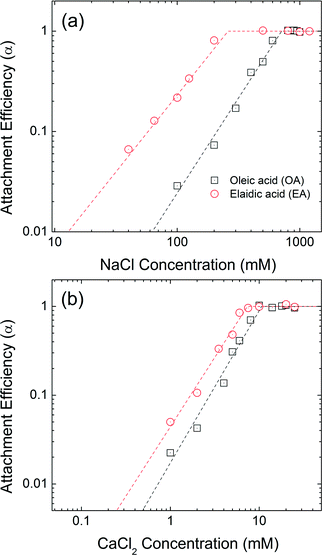 |
| | Fig. 4 Attachment efficiencies of OA-NPs and EA-NPs as functions of (a) NaCl and (b) CaCl2 concentrations at pH 7.0. | |
The CCC values for OA-NPs are 710 mM for NaCl and 10.6 mM for CaCl2, while the CCC values for EA-NPs are 260 mM for NaCl and 7.4 mM CaCl2. The α value for OA-NPs is comparatively smaller than that of EA-NPs under the same electrolyte concentration in the reaction-limited regime. We hypothesize that cis (oleyl) forms of unsaturated–unsaturated oleyl carbon chains may lead to enhancement in bilayer stability due, in part to, stronger van der Waals (primarily as London type forces) interactions, as the tails are sterically aligned, with lower (molecular) degree(s) of freedom, compared to the relatively straighter EA-(trans-)unsaturated–OA-(cis-)unsaturated carbon chain.
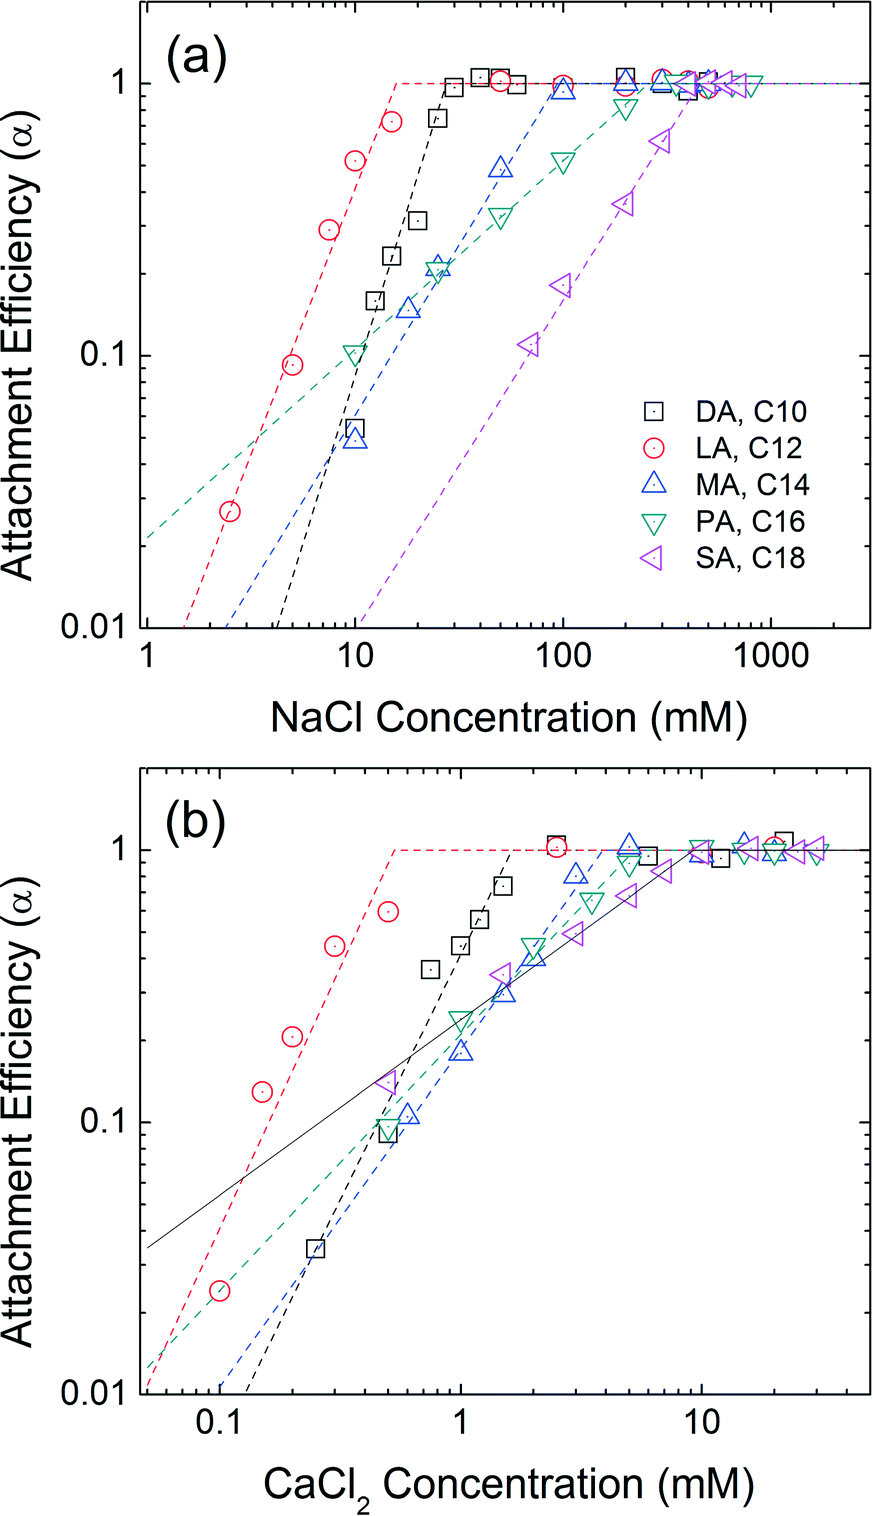
Effect of chain length
A series of saturated fatty acids differing in chain length, but with the identical carboxylic acid head groups, were applied and evaluated as the second, outwardly facing layer(s). Decanoic acid (DA, C10), lauric acid (LA, C12), myristic acid (MA, C14), palmitic acid (PA, C16), and stearic acid (SA, C18) are similar n-alkanoic acids with 10–18 carbons. The progressive increase in the carbon number allows us to directly compare the effect of second layer chain length on the colloidal stability. Fig. 5 represents the aggregation attachment efficiencies of DA-NPs, LA-NPs, MA-NPs, PA-NPs, and SA-NPs as functions of NaCl and CaCl2 concentrations at pH 7.0. The CCC values in the presence of NaCl are 27 mM, 16 mM, 94 mM, 257 mM and 452 mM for DA-NPs, LA-NPs, MA-NPs, PA-NPs, and SA-NPs, respectively. The CCC values in the presence of CaCl2 are 1.6 mM, 0.5 mM, 3.9 mM, 5.3 mM and 9.3 mM for DA-NPs, LA-NPs, MA-NPs, PA-NPs, and SA-NPs, respectively. Except for DA-NPs, the CCC values increases as the carbon chain length increases from C12 to C18. It is hypothesized that the longer the alkyl chain length of surfactant, the stronger (net increase) hydrophobic and/or van der Waals (primarily as London type) interactions between the first and second layer tail groups.18
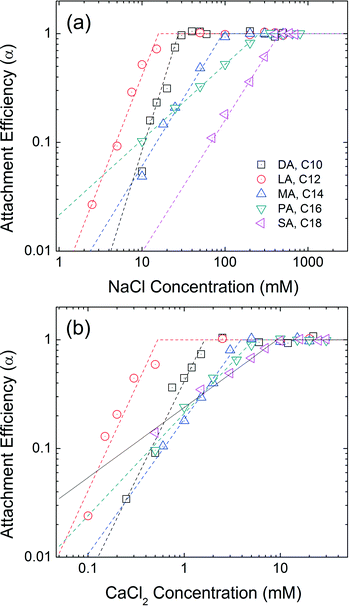 |
| | Fig. 5 Attachment efficiencies of DA-NPs (C10), LA-NPs (C12), MA-NPs (C14), PA-NPs (C16), and SA-NPs (C18) as functions of (a) NaCl and (b) CaCl2 concentrations at pH 7.0. | |
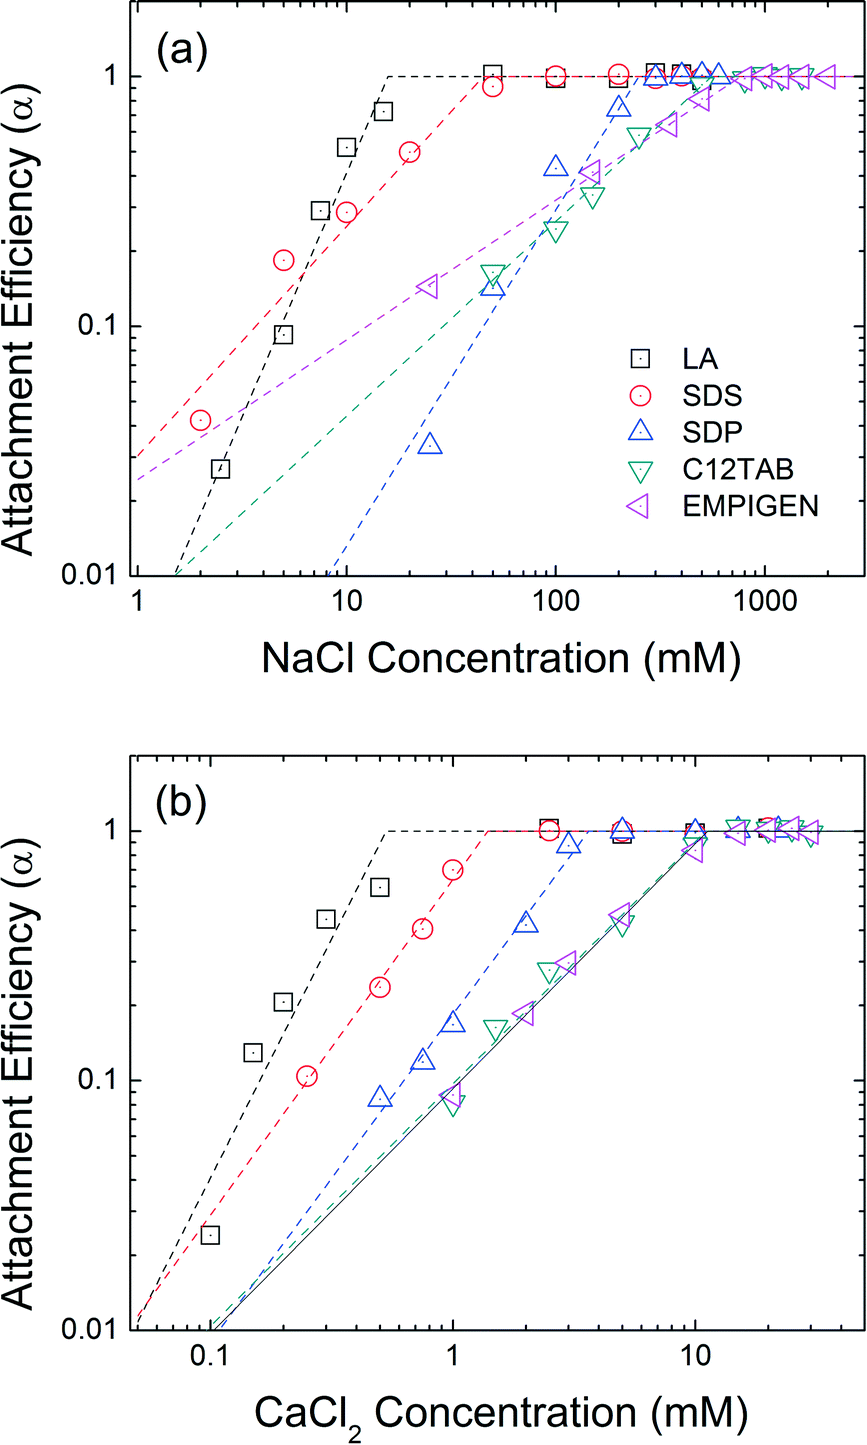
Head group functionality
The effect of head group functionality on NPs colloidal stability is compared in Fig. 6. LA, SDS, SDP, C12TAB, and EMPIGEN have similar size (C12) and type (unsaturated, aliphatic) of hydrophobic tails but vary with regard to functional head groups. Carboxylate group functionalized LA-NPs have CCC values of 16 mM NaCl and 0.5 mM CaCl2. SDS coated NPs with a sulfate functional head group has CCC values of 45 mM NaCl and 1.4 mM CaCl2. With phosphate based hydrophilic head group, SDP-NPs have a higher CCC values in NaCl (250 mM) and CaCl2 (3.6 mM). The highest CCC values were obtained when positive and zwitterionic functionalized second layer was applied. C12TAB and EMPIGEN coated NPs have the CCC values of 555 mM and 766 mM for NaCl, 11.1 mM and 11.3 mM for CaCl2, respectively.
 |
| | Fig. 6 Attachment efficiencies of LA-NPs, SDS-NPs, SDP-NPs, C12TAB-NPs, and EMPIGEN-NPs as functions of (a) NaCl and (b) CaCl2 concentrations at pH 7.0. | |
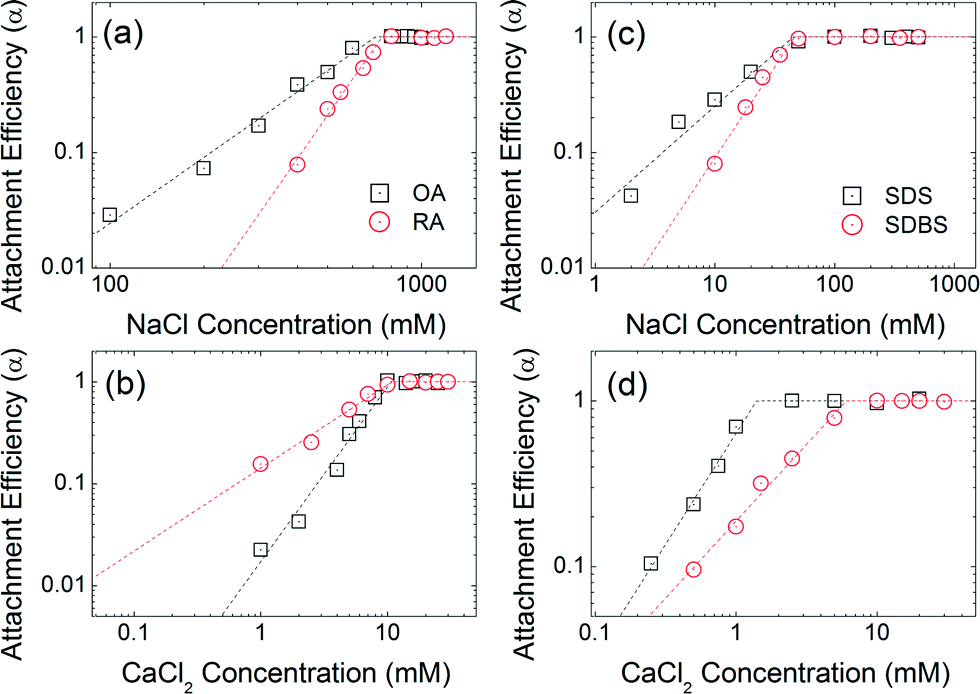
Co-functional surfactants
Fig. 7 compares the attachment efficiencies of oleic acid (OA), ricinoleic acid (RA), sodium dodecyl sulfate (SDS) and sodium dodecylbenzenesulfonate (SDBS) coated NPs similarly over a range of ionic strengths and types. Ricinoleic acid has one more hydroxyl group compared to oleic acid, offering additional negative charge and additional Debye forces within the bilayer. The CCC values of RA-NPs (746 mM NaCl and 10.8 mM CaCl2) are higher than that of OA-NPs (710 mM NaCl and 10.6 mM CaCl2). The CCC value of SDS-NPs (45 mM) is similar to that of SDBS-NPs (46 mM) for NaCl. However, in the presence of CaCl2, the CCC value of SDBS-NPs (6 mM) is relatively higher than that of SDS coated NPS (1.4 mM). Based on a recent report by Rimmen et al., such behavior is hypothesized to be due to the cation–π interaction between electron rich benzene group from the SDBS and divalent calcium cation.50 Taken together, aggregation kinetics and CCC values of bilayer coated iron oxide NPs differ significantly as a function of head group functionality, in addition to tail chain length and geometries, highlighting the importance of systematically understanding (and thus design of) capping layer(s) for desired surface functionality and overall colloidal stability.6,51
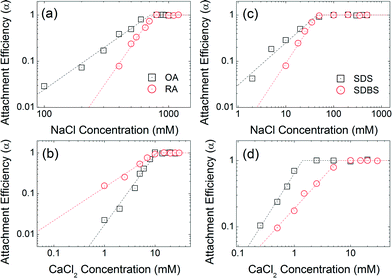 |
| | Fig. 7 Attachment efficiencies of OA-NPs and RA-NPs as functions of (a) NaCl and (b) CaCl2 concentrations at pH 7. Attachment efficiencies of SDS-NPs and SDBS-NPs as functions of (c) NaCl and (d) CaCl2 concentrations at pH 7.0. | |
Long-term stability
In addition to short-term aggregation studies, long-term stability of all materials in water was evaluated. Libraries of samples were sealed and stored in the dark at room temperature and DLS size measurements were taken at 1 day (d), 1–2 weeks (wk), 1–6 months (mo) and 1 year (yr). Fig. 8 shows the change in hydrodynamic diameter of NPs in ultrapure water as a function of time. The initial hydrodynamic diameters for these NPs were around 20 nm and the sizes were still below 50 nm after one year of storage. For example, RA coated NPs demonstrate negligible size change (<2 nm) during the entire time (one year).
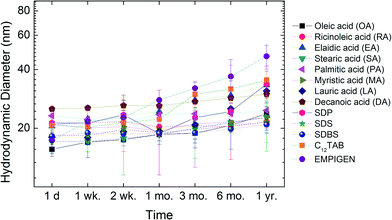 |
| | Fig. 8 Long-term stability of bilayer coated NPs in ultrapure water. | |
Conclusions
In summary, we provide an effective and general approach for aqueous stable, monodispersed, superparamagnetic NPs with a series of organic bilayer coatings. As described, bilayer surface modification methods not only provide stable, monodisperse suspensions but also allow for variable surface chemistries to tune surface charge, colloidal stability and functionality, as needed for application. Further, such methods can be modified to engineer water-stable NPs analogs with different core compositions (e.g. metal oxides), sizes, and shapes.52
Acknowledgements
This work is supported by American Chemical Society's Petroleum Research Fund (#52640-DNI10), the National Science Foundation (NSF) (CBET, #1236653 and #1437820), and U.S. Army Corps of Engineers (W912HZ-13-2-0009-P00001). TEM, DLS, Ultracentrifugation, and ICP-OES measurements were provided by the Nano Research Facility (NRF) at Washington University in St. Louis, a member of the National Nanotechnology Infrastructure Network (NNIN), which is supported by the NSF (#ECS-0335765). All SQUID measurements were performed at the UCSB MRL Shared Experimental Facility, which is supported by the NSF MRSEC Program Award No. DMR 1121053 (and is a member of the NSF-funded Materials Research Facilities Network).
References
- D. Ho, X. Sun and S. Sun, Acc. Chem. Res., 2011, 44, 875–882 CrossRef CAS PubMed.
- N. A. Frey, S. Peng, K. Cheng and S. Sun, Chem. Soc. Rev., 2009, 38, 2532–2542 RSC.
- S. Laurent, D. Forge, M. Port, A. Roch, C. Robic, L. Vander Elst and R. N. Muller, Chem. Rev., 2008, 108, 2064–2110 CrossRef CAS PubMed.
- N. Bayat, V. R. Lopes, M. Sanchez-Dominguez, R. Lakshmanan, G. K. Rajarao and S. Cristobal, Environ. Sci.: Nano, 2015, 2, 380–394 RSC.
- R. de Palma, S. Peeters, M. J. van Bael, H. van den Rul, K. Bonroy, W. Laureyn, J. Mullens, G. Borghs and G. Maes, Chem. Mater., 2007, 19, 1821–1831 CrossRef CAS.
- N. Saleh, H.-J. Kim, T. Phenrat, K. Matyjaszewski, R. D. Tilton and G. V. Lowry, Environ. Sci. Technol., 2008, 42, 3349–3355 CrossRef CAS PubMed.
- M. A. White, J. A. Johnson, J. T. Koberstein and N. J. Turro, J. Am. Chem. Soc., 2006, 128, 11356–11357 CrossRef CAS PubMed.
- C. T. Yavuz, J. T. Mayo, W. W. Yu, A. Prakash, J. C. Falkner, S. Yean, L. Cong, H. J. Shipley, A. Kan, M. Tomson, D. Natelson and V. L. Colvin, Science, 2006, 314, 964–967 CrossRef PubMed.
- S. I. C. J. Palma, M. Marciello, A. Carvalho, S. Veintemillas-Verdaguer, M. D. P. Morales and A. C. A. Roque, J. Colloid Interface Sci., 2015, 437, 147–155 CrossRef CAS PubMed.
- W. Li, D. Liu, J. Wu, C. Kim and J. D. Fortner, Environ. Sci. Technol., 2014, 48, 11892–11900 CrossRef CAS PubMed.
- S. C. N. Tang and I. M. C. Lo, Water Res., 2013, 47, 2613–2632 CrossRef CAS PubMed.
- M. Lattuada and T. A. Hatton, Langmuir, 2007, 23, 2158–2168 CrossRef CAS PubMed.
- S. Krajangpan, H. Kalita, B. J. Chisholm and A. N. Bezbaruah, Environ. Sci. Technol., 2012, 46, 10130–10136 CAS.
- W. Yantasee, C. L. Warner, T. Sangvanich, R. S. Addleman, T. G. Carter, R. J. Wiacek, G. E. Fryxell, C. Timchalk and M. G. Warner, Environ. Sci. Technol., 2007, 41, 5114–5119 CrossRef CAS PubMed.
- X. Q. Xu, H. Shen, J. R. Xu and X. J. Li, Appl. Surf. Sci., 2004, 221, 430–436 CrossRef CAS.
- S. Sulek, B. Mammadov, D. I. Mahcicek, H. Sozeri, E. Atalar, A. B. Tekinay and M. O. Guler, J. Mater. Chem., 2011, 21, 15157–15162 RSC.
- H. B. Na, I. C. Song and T. Hyeon, Adv. Mater., 2009, 21, 2133–2148 CrossRef CAS.
- E. Tombácz, D. Bica, A. Hajdú, E. Illés, A. Majzik and L. Vékás, J. Phys.: Condens. Matter, 2008, 20, 204103 CrossRef PubMed.
- L. Shen, P. E. Laibinis and T. Alan Hatton, J. Magn. Magn. Mater., 1999, 194, 37–44 CrossRef CAS.
- A. Wooding, M. Kilner and D. B. Lambrick, J. Colloid Interface Sci., 1992, 149, 98–104 CrossRef CAS.
- H. Yang, H. Zhou, C. Zhang, X. Li, H. Hu, H. Wu and S. Yang, Dalton Trans., 2011, 40, 3616–3621 RSC.
- T. Zhang, J. Ge, Y. Hu and Y. Yin, Nano Lett., 2007, 7, 3203–3207 CrossRef CAS PubMed.
- Y. Wang, J. F. Wong, X. Teng, X. Z. Lin and H. Yang, Nano Lett., 2003, 3, 1555–1559 CrossRef CAS.
- W. W. Yu, J. C. Falkner, C. T. Yavuz and V. L. Colvin, Chem. Commun., 2004, 2306–2307 RSC.
- J. Park, K. An, Y. Hwang, J.-G. Park, H.-J. Noh, J.-Y. Kim, J.-H. Park, N.-M. Hwang and T. Hyeon, Nat. Mater., 2004, 3, 891–895 CrossRef CAS PubMed.
- K. Yang, H. Peng, Y. Wen and N. Li, Appl. Surf. Sci., 2010, 256, 3093–3097 CrossRef CAS.
- F. Gambinossi, S. E. Mylon and J. K. Ferri, Adv. Colloid Interface Sci., 2014, 222, 332–349 CrossRef PubMed.
- N. Saleh, T. Phenrat, K. Sirk, B. Dufour, J. Ok, T. Sarbu, K. Matyjaszewski, R. D. Tilton and G. V. Lowry, Nano Lett., 2005, 5, 2489–2494 CrossRef CAS PubMed.
- E. M. Hotze, T. Phenrat and G. V. Lowry, J. Environ. Qual., 2010, 39, 1909–1924 CrossRef CAS PubMed.
- Y. Xu, Y. Qin, S. Palchoudhury and Y. Bao, Langmuir, 2011, 27, 8990–8997 CrossRef CAS PubMed.
- A. Prakash, H. Zhu, C. J. Jones, D. N. Benoit, A. Z. Ellsworth, E. L. Bryant and V. L. Colvin, ACS Nano, 2009, 3, 2139–2146 CrossRef CAS PubMed.
- W. W. Yu, E. Chang, J. C. Falkner, J. Zhang, A. M. Al-Somali, C. M. Sayes, J. Johns, R. Drezek and V. L. Colvin, J. Am. Chem. Soc., 2007, 129, 2871–2879 CrossRef CAS PubMed.
- D. N. Benoit, H. Zhu, M. H. Lilierose, R. A. Verm, N. Ali, A. N. Morrison, J. D. Fortner, C. Avendano and V. L. Colvin, Anal. Chem., 2012, 84, 9238–9245 CAS.
- J.-f. Liu, Z.-S. Zhao and G.-B. Jiang, Environ. Sci. Technol., 2008, 42, 6949–6954 CrossRef CAS PubMed.
- K. L. Chen, S. E. Mylon and M. Elimelech, Environ. Sci. Technol., 2006, 40, 1516–1523 CrossRef CAS PubMed.
- A. Wooding, M. Kilner and D. B. Lambrick, J. Colloid Interface Sci., 1991, 144, 236–242 CrossRef CAS.
- Y.-W. Choi, H. Lee, Y. Song and D. Sohn, J. Colloid Interface Sci., 2015, 443, 8–12 CrossRef CAS PubMed.
- D. Kim, M. K. Chae, H. J. Joo, I.-h. Jeong, J.-H. Cho and C. Lee, Langmuir, 2012, 28, 9634–9639 CrossRef CAS PubMed.
- C.-C. Huang, K.-Y. Chuang, C.-P. Chou, M.-T. Wu, H.-S. Sheu, D.-B. Shieh, C.-Y. Tsai, C.-H. Su, H.-Y. Lei and C.-S. Yeh, J. Mater. Chem., 2011, 21, 7472–7479 RSC.
- H. Fan, E. Leve, J. Gabaldon, A. Wright, R. E. Haddad and C. J. Brinker, Adv. Mater., 2005, 17, 2587–2590 CrossRef CAS.
- Y. Sahoo, H. Pizem, T. Fried, D. Golodnitsky, L. Burstein, C. N. Sukenik and G. Markovich, Langmuir, 2001, 17, 7907–7911 CrossRef CAS.
- L. Shen, P. E. Laibinis and T. A. Hatton, Langmuir, 1998, 15, 447–453 CrossRef.
- Z. Wang, A. Lam and E. Acosta, J. Surfactants Deterg., 2013, 16, 397–407 CrossRef CAS.
- A. R. Petosa, D. P. Jaisi, I. R. Quevedo, M. Elimelech and N. Tufenkji, Environ. Sci. Technol., 2010, 44, 6532–6549 CrossRef CAS PubMed.
- I. Chowdhury, M. C. Duch, N. D. Mansukhani, M. C. Hersam and D. Bouchard, Environ. Sci. Technol., 2013, 47, 6288–6296 CrossRef CAS PubMed.
- X. Huangfu, J. Jiang, J. Ma, Y. Liu and J. Yang, Environ. Sci. Technol., 2013, 47, 10285–10292 CAS.
- R. Huang, R. P. Carney, F. Stellacci and B. L. T. Lau, Langmuir, 2013, 29, 11560–11566 CrossRef CAS PubMed.
- D. Dickson, G. Liu, C. Li, G. Tachiev and Y. Cai, Sci. Total Environ., 2012, 419, 170–177 CrossRef CAS PubMed.
- J.-D. Hu, Y. Zevi, X.-M. Kou, J. Xiao, X.-J. Wang and Y. Jin, Sci. Total Environ., 2010, 408, 3477–3489 CrossRef CAS PubMed.
- M. Rimmen, J. Matthiesen, N. Bovet, T. Hassenkam, C. S. Pedersen and S. L. S. Stipp, Langmuir, 2014, 30, 9115–9122 CrossRef CAS PubMed.
- J. Liu, S. Legros, G. Ma, J. G. C. Veinot, F. von der Kammer and T. Hofmann, Chemosphere, 2012, 87, 918–924 CrossRef CAS PubMed.
- S. S. Lee, W. Li, C. Kim, M. Cho, J. G. Catalano, B. J. Lafferty, P. Decuzzi and J. D. Fortner, Environ. Sci.: Nano, 2015, 2, 500–508 RSC.
Footnote |
| † Electronic supplementary information (ESI) available: Supporting information includes SQUID data, detailed images of phase transfer process, TEM micrographs of NPs transfer into water, and 14 tables. See DOI: 10.1039/c5en00089k |
|
| This journal is © The Royal Society of Chemistry 2016 |
Click here to see how this site uses Cookies. View our privacy policy here.