 Open Access Article
Creative Commons Attribution 3.0 Unported Licence
How many enzyme molecules are needed for discrimination oriented applications?
Jerzy
Gorecki
*a,
Joanna N.
Gorecka
b,
Bogdan
Nowakowski
ac,
Hiroshi
Ueno
d and
Kenichi
Yoshikawa
 d
d
aInstitute of Physical Chemistry, Polish Academy of Sciences, Kasprzaka 44/52, 01-224 Warsaw, Poland. E-mail: jgorecki@ichf.edu.pl
bInstitute of Physics, Polish Academy of Sciences, al. Lotnikow 32/46, 02-668 Warsaw, Poland
cSGGW, Warsaw University of Life Sciences, Nowoursynowska 159, 02-776 Warsaw, Poland
dFaculty of Life and Medical Sciences, Doshisha University, Kyoto 610-0394, Japan
First published on 27th June 2016
Abstract
Chemical reactions establish a molecular mechanism for information processing in living organisms. Here we consider a simple enzymatic reaction model that can be used to discriminate parameters characterizing periodic reagent inflow. Numerical simulations based on the kinetic equations show that there exist a range of inflow frequencies and amplitudes in which the time evolution of the system is very sensitive to small changes in the values of these parameters. However, the kinetic equations are derived for the thermodynamic limit, whereas in a real biological medium, like a cell, the number of enzyme molecules is an integer and finite. We use stochastic simulations to estimate discriminator reliability as a function of the number of enzyme molecules involved. For systems with 10![[thin space (1/6-em)]](https://www.rsc.org/images/entities/char_2009.gif) 000 molecules the functionality predicted by kinetic equations is confirmed. If the number of molecules is decreased to 100, discrimination becomes unreliable.
000 molecules the functionality predicted by kinetic equations is confirmed. If the number of molecules is decreased to 100, discrimination becomes unreliable.
1 Introduction
Living organisms use chemical reactions to acquire and process information about the environment they live in. High-level organisms have developed a spatial structure (the nerve system) that performs information processing tasks. The functionality of a nerve system is based on reaction–diffusion type phenomena proceeding in an excitable medium.1 A structure similar to the nerve system is missing in simple organisms. Therefore, it can be expected that the necessary information processing ability is incorporated into the metabolic pathway. This observation motivates investigation on computational strategies based on enzymatic processes characterized by a complex, nonlinear chemical kinetics and exhibiting a rich variety of stationary spatio-temporal patterns.2–4Enzymatic systems can accept and transform information in the form of chemical substrates with particular properties that meet the binding specificity criteria of a selected enzyme. The input information can be coded in concentrations of specific molecules that undergo catalyzing reactions leading to products with different properties than that of input reagents. The output information is coded in concentrations of products. Of course, products can participate in subsequent reaction steps. Transformations of products into other molecules can be regarded as the following information processing operations. Studies on networks of connected enzyme-catalyzed reactions with additional chemical and enzymatic processes that incorporate filtering steps into the reaction cascades5 demonstrated that scaled logic variables for the inputs, outputs and intermediate products can be useful for describing the functionality of an enzyme cascade.
The majority of experimental studies on (bio-)chemical information processing have focused on the binary logic.6 A convex line representing the relationship between the substrate concentration and the rate of product generation, observed for example for the Michaelis–Menten kinetics,7 is typical for enzymatic reactions. For such a relationship there is an identifiable linear regime, typically near the zero concentration, as well as the saturation regime for higher concentrations. In such a case the relationship between reagent concentrations and binary logic values is straightforward: the high concentrations represent the logic TRUE state, the low concentrations are interpreted as the logic FALSE. However, enzymatic reactions with a convex relationship between the substrate concentration and the product production rate are not the most suitable for enzymatic information processing applications. A sigmoid, filter like relationship between the substrate concentration and the product generation rate seems to be more suited, because it gives a better balance between low and high values of concentrations.
The sigmoidal relationship often appears for appropriately chained enzymatic reactions.8,9 Therefore, it can be designed on demand by coupling an enzymatic process characterized by a convex kinetics with other reactions10 (see also Section 2). Various physical or chemical stimuli can be applied to adjust the relationship between the substrate concentration and the product generation rate. It was demonstrated that in the enzymatic reaction involving glucose oxidase system response depends on the initial concentration of hexokinase and ATP.10 Even more interesting is that the transition between convex and sigmoidal kinetics can be achieved by system illumination.11
The sigmoidal relationship between the substrate concentration and the rate of product production is expected for allosteric enzymatic reactions.12–14 Allosteric regulation is one of the many ways in which enzyme activity can be controlled. A typical enzyme contains binding sites where substrate molecules can be attached and the catalytic site where the activation energy is reduced and the reaction, specific for a given enzyme, proceeds. The allosteric enzymes contain another region, separated from the substrate binding site and the catalytic site, to which small, regulatory molecules (called allosteric regulatory molecules) can attach to and thereby control the catalytic activity. The allosteric regulatory molecules modify the conformation and vibrational modes of the enzyme. Such changes are transduced to the active site and affect the reaction rate. Allosteric interactions can either inhibit or activate enzymes. The regulating reactions can couple with the main enzymatic process. In Section 2 we give an example of allosteric reaction for which the sigmoidal rate is observed if the rates of reactions are appropriately selected. A biocatalytic system with a double-sigmoid characteristic (sigmoidal relationship with respect to two types of molecules) is especially interesting because it can directly operate on two input signals.15–17 Enzymatic reactions capable of recognizing two specific molecules or ions in the solution (for example Mg2+ and Ca2+![[thin space (1/6-em)]](https://www.rsc.org/images/entities/char_2009.gif) 15,18) were identified and their application in the construction of logic gates (the AND binary gate,19 the OR binary gate20) was reported. Enzymatic systems can also perform more complex computational tasks like three-input logic gates or molecular full adders.21,22
15,18) were identified and their application in the construction of logic gates (the AND binary gate,19 the OR binary gate20) was reported. Enzymatic systems can also perform more complex computational tasks like three-input logic gates or molecular full adders.21,22
The theoretical analysis of information processing using enzymatic reactions, presented in the papers cited above, was based on the deterministic kinetic equations valid in the thermodynamic limit. However, the volume of a real living cell is finite and the number of enzyme molecules is limited. For a small number of enzyme molecules involved, the internal fluctuations can have a significant influence on the chemical kinetics. In this paper we study the influence of the system size on a prototype of an enzymatic binary discriminator in order to estimate the minimum number of molecules needed to perform such a task reliably.
An enzymatic system that can distinguish which of two classes a given case belongs to is important because a significant part of the computational activity of living organisms is related to decision making. Information has to be processed in order to find the optimum condition for their existence in a time dependent environment. The time dependent environment includes many periodic stimuli, like the temperature or illumination in a day–night cycle or the frequency related to a circadian rhythm. Therefore, the discrimination of the amplitude or frequency of an external periodic stimulus can be important in the search for the optimum living conditions. Many decision making problems require a binary (YES or NO) answer. Having in mind that information processing ability of living organisms is based on biochemical reactions we introduce an enzymatic reaction model that can be applied for decision making problems in which the input information is coded in periodically changing inflow of reagents.
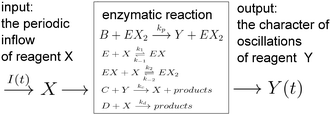
The papers on enzymatic computing cited above were based on information coded in time-independent, stationary concentrations of selected reagents. In this paper we discuss a new approach to enzymatic computing with information coded in periodic oscillations of reagent concentrations. The input variables are parameters describing the inflow of a selected reagent X into a medium in which an enzymatic reaction proceeds (the amplitude A and the frequency f). The output information is coded in the type of oscillations of another reagent Y. The information and the matter flows through the discriminator are schematically illustrated in Fig. 1.
We have shown23,24 that a chemical system characterized by a sigmoidal kinetics is especially suitable for discrimination of frequency and amplitude characterizing the inflow of reagents. For such a system there is a range of parameters in which the system is bistable and its stable states belong to two separate classes S1 and S2. Periodically perturbed bistable system oscillates. The location of system oscillations in the X × Y space depends on the amplitude and frequency of the inflow. In particular we can distinguish oscillations covering the states in class S1 and oscillations between states in class S2. Numerical simulations have shown that for a sigmoidal reaction kinetics a marginal change of inflow parameters (amplitude or frequency) can force a sharp transition between oscillations of Y belonging to different classes.23,24 The transition occurs in a narrow range of perturbation parameters. The difference between various oscillation types can be easily observed because they occur in various regions of Y concentration. Therefore, an enzymatic reaction exhibiting hysteresis seems to be a good candidate for a discriminator of inflow properties.
This paper is organized as follows: in Section 2 we introduce a simple model of enzymatic reaction and we demonstrate that it can operate as a binary discriminator of the inflow parameters. In Section 3 we introduce a stochastic model for the considered reaction and describe the simulation algorithm that mixes a discrete description of enzyme complexes with a continuous description of other reagents. The results of numerical simulations are presented in the next section.
2 Determination of inflow properties with enzymatic reactions
We consider a reaction model in which the enzyme molecule E with two attached molecules of reagent X forms the complex EX2 which catalyzes the transformation of the reactant B into the final product Y:We assume that the formation of EX2 complex is described by two chained reversible reactions:
The model based on equations given above would lead to unbounded growth in concentration of Y. In order to have a stationary state with finite concentrations we take into account the transformation of product Y into reactant X:
In the considered model we also include the inflow of X molecules with the time dependent rate I(t):
For the following analysis we assume that concentrations of B, C and D molecules are large if compared to the other reagents and their changes in time are negligible. The evolution of the system is described by time dependent concentrations of E, EX, EX2, X and Y denoted as e(t), f(t), g(t), x(t) and y(t), respectively. The total number of enzyme molecules in its free and complexed forms remains constant in time. Let us denote it as e0. This constrain can be used to calculate e(t) if f(t) and g(t) are known. The time evolution of the medium with reactions listed above is described by the set of equations:
| e(t) = e0 − f(t) − g(t) | (1) |
 | (2) |
 | (3) |
 | (4) |
 | (5) |
If we assume that the reactions involving an enzyme and its complexes are faster than those leading to productsC and productsD then the concentrations of complexes EX and EX2 can be regarded as quasistationary ones that immediately adjust to the local values of x(t) and y(t). The corresponding values of e(t), f(t) and g(t) are:
 | (6) |
 | (7) |
 | (8) |
In such a case the time evolution of the system is described by two kinetic equations for x(t) and y(t):
 | (9) |
 | (10) |
The reduced model leads to a kinetic term in a Hill-like form25 with the Hill coefficient equal to 2. Such a value has been observed for allosteric reactions characterized by a positive cooperativity.13,26 The reaction rates and constant concentrations can be adjusted such that the kinetic term in eqn (10) has a sigmoidal form. As we know23,24 a chemical system characterized by a sigmoidal kinetics can be used for discrimination of periods and amplitudes characterizing the inflow of reagents.
For the system described by eqn (9) and (10) we obtain a sigmoid-shaped nullcline R(x, y) = 0 if the rate constants are k1 = 2, k−1 = 2, k2 = 4, k−2 = 2, and kp = 1820, the rate constants for the slow reactions lead to products kc = 0.1 and kd = 1 and the total concentration of enzyme is e0 = 0.001. The locations of the R(x, y) = 0 nullcline and the Q(x, y, t) = 0 nullcline are illustrated in Fig. 2. The nullcline Q(x, y, t) = 0 is shown for three different values of reagent inflow: I(t) ≡ 0 (no inflow of X), I(t) ≡ 0.0335807 = A2 and I(t) ≡ 0.0862972 = A1. The last two values of inflow correspond to cases when the nullcline Q(x, y, t) is tangential to the nullcline R(x, y). At the beginning we consider an inflow that remains constant after it is switched on at t = 0, i.e.: I(t) = I0·Θ(t), where Θ(t) is the Heaviside step function. Let the initial (t = 0) state of the system is x(t = 0) = y(t = 0) = 0, which is the steady state if there is no inflow of X. If the inflow I0 < A2 then the system has a single, stable stationary state (xs, ys) for which xs < 0.202441 and ys < 1.16144. For I0 > A1 the system has a single, stable stationary state (xs, ys) for which xs > 0.657363 and ys > 6.23782. If A2 < I0 < A1 then the system of eqn (9) and (10) is bistable and shows hysteresis. Having in mind results of our recent papers23,24 it is expected that the considered reaction model can function as a discriminator of frequency and amplitude of a time dependent inflow.
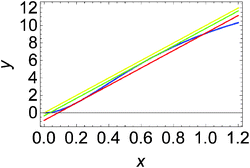 | ||
| Fig. 2 Positions of nullclines for the dynamical system defined by eqn (9) and (10) in the phase space (x, y). The nullcline R(x, y) = 0 is plotted with the blue line. The nullcline Q(x, y, t) = 0 is shown for a few cases: I(t) ≡ 0 (the yellow line), I(t) ≡ 0.0335807 = A2 (the green line) and I(t) ≡ 0.0862972 = A1 (the red line). For the selected parameters of the model, the concentrations at tangential points are (x1, y1) = (0.202441, 1.16144) and (x2, y2) = (0.657363, 6.23782). | ||
Upon selecting the model parameters we intentionally made enzyme concentration much smaller than concentrations of other reagents to agree with the stochastic model described in Section 3. In the stochastic model we assume discrete numbers of the enzyme and its complexes, whereas average concentrations describe the time evolution of other reagents.
In the considered set of rate constants the rates kc and kd are not significantly lower than the other rates thus we do not expect that the reduced model (eqn (9) and (10)) is a good approximation for the full one (eqn (1)–(5)). Nevertheless, we found the reduced model useful for the estimation of reaction parameters for which a sharp transition in the types of oscillations of y(t) as a function of amplitude and frequency of periodic inflow of X molecules is observed.
In the following we consider a periodic inflow of X described by the formula:
| I(t) = A·(sin(2πνt + ϕ0) + 1)·Θ(t) |
Fig. 3 illustrates the discrimination potential of the considered enzymatic model. The time evolution of y(t) in the interval t ∈ [6000, 8000] is shown for a few values of A and ν. The time interval in which the evolution is studied has been selected such that the system arrives to a stationary type of oscillations after the time tmin = 6000. Time tmax = 8000 is long enough to confirm that oscillations are stationary. Depending on the values of ν and A we observe two significantly different oscillation types: either ∀t∈[tmin,tmax]![[thin space (1/6-em)]](https://www.rsc.org/images/entities/char_2009.gif) y(t) < 5 or ∀t∈[tmin,tmax]
y(t) < 5 or ∀t∈[tmin,tmax]![[thin space (1/6-em)]](https://www.rsc.org/images/entities/char_2009.gif) y(t) > 6. On the basis of this property we can introduce the following classification of oscillations. Let us define:
y(t) > 6. On the basis of this property we can introduce the following classification of oscillations. Let us define:
ymin = mint∈[tmin,tmax]![[thin space (1/6-em)]](https://www.rsc.org/images/entities/char_2009.gif) y(t) y(t) | (11) |
ymax = maxt∈[tmin,tmax]![[thin space (1/6-em)]](https://www.rsc.org/images/entities/char_2009.gif) y(t) y(t) | (12) |
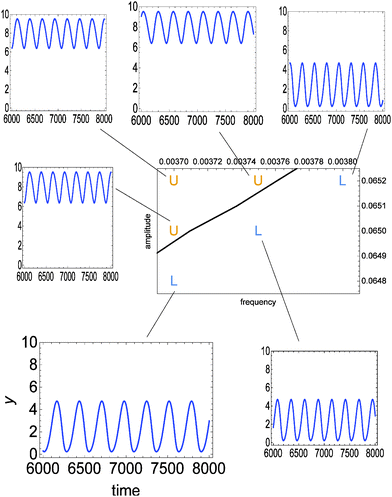 | ||
| Fig. 3 The time evolution of y(t) in the interval t ∈ [6000, 8000] calculated from the full reaction model (eqn (1)–(5)) for a few values of amplitude A and frequency ν. In all cases ϕ0 = 3·π/2. The considered pairs of (ν, A) ∈ {(0.00370, 0.0648), (0.00370, 0.0650), (0.00370, 0.0652), (0.00375, 0.0650), (0.00375, 0.0652), (0.00380, 0.0652)} are marked in the phase space. The solid line separates the region where oscillations at low (L) and high (U) values of y are observed. | ||
The line separating type-L from type-U oscillations in the phase space ν, A is shown in Fig. 3 and 4. It is calculated from a numerical solution of eqn (1)–(5). For classification oriented tasks it is important that the boundary region between domains corresponding to different oscillation types is very narrow. In Fig. 3 the location of points (ν, A) for which the transition between type-L and type-U oscillations occurs inside the interval [tmin, tmax] is smaller than the line width. Therefore, the considered enzymatic system can precisely detect small changes in amplitude or frequency if they occur near the line separating oscillations with different character. The relative changes in these parameters of the order of 10−3 lead to distinctly different oscillation types (U or L). A significant difference in values of y can be used to couple the result of discrimination with the subsequent steps of chemical information processing.
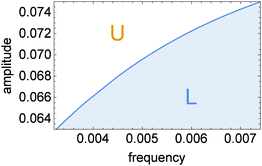 | ||
| Fig. 4 The phase diagram showing the oscillation type as a function of inflow parameters (ν, A). The solid line corresponds to the full reaction model. | ||
The proposed discrimination method is based on the location of a given oscillation type with respect to the line separating different types of oscillations. Let us denote points on this line as (νc, Ac). As seen in Fig. 4νc treated as a function of Ac is an increasing function νc = Z(Ac). For example, if we like to determine if the frequency of inflow ν is higher than ν0 then we should select the inflow amplitude equal to A = Z−1(ν0) and observe the character of oscillations. If we observe type-U oscillations then ν < ν0. Observation of type-L oscillations indicates that ν > ν0. The derivative of A = Z−1(ν) decreases with ν thus the sensitivity of the method changes with the frequency ν0. In order to detect a high frequency inflow, the inflow amplitude should be selected with much higher precision than for 0.0032 ≤ νc ≤ 0.004. One can also use the transition between type-L and type-U oscillations to determine the inflow amplitude. Unlike for frequency, the range of discriminated amplitudes does not extend outside the interval [A1/2, A1]. If the amplitude A > A1 then, at a high frequency ν the inflow of control molecules is close to the average inflow A. For such inflow the steady state of the system is located at the upper stable branch of the R(x, y) = 0 nullcline and no transition between oscillation character is expected.
3 Stochastic model of time evolution for a small number of enzyme molecules
In the stochastic analysis of the time evolution of the considered enzymatic system we assume that the internal fluctuations are related to a small number of enzyme molecules. The numbers of molecules of all other reactants (B, C, D, X and Y) are large and these reagents are described by their average concentrations. This assumption is consistent with selected parameters of the reaction model. The sum of enzyme concentrations in the free and complexed forms is e0 = 0.001 concentration unit, whereas concentrations of X and Y at oscillation minima are over 50 times larger.The state of the system is described by three stochastic variables representing the numbers of molecules of E, EX, and EX2 as functions of time (denoted as NE(t), NEX(t) and NEX2(t), respectively) and by concentrations x(t) and y(t). Let us assume that the total number of enzyme molecules in free and all complexed forms is N0 and that the volume of the system is Ω(=N0/e0 = 1000N0). At time t = 0 the state of the system is characterized by  and y(t = 0). The time evolution of such a system is described by a master equation for the conditional probability distribution
  coupled with the stochastic differential equations for x(t) and y(t):
 | (13) |
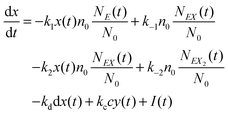 | (14) |
| NE(t) = N0 − NEX(t) − NEX2(t) | (15) |
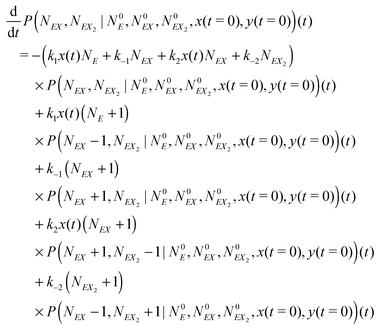 | (16) |
The kinetic Monte Carlo method27 can be applied for numerical simulations of system time evolutions. According to eqn (16) the probability that a system remains in its initial state:  at time t is described by the equation:
 | (17) |
The solution of this equation is:
 | (18) |
 | (19) |
On the basis of eqn (19) we can apply the following method of numerical stochastic simulations of the system, based on the kinetic Monte Carlo algorithm:27
(1) At time t the system state is  ,
,
(2) Find the time δt at which the first reaction involving the enzyme occurs by selecting a random number r from the uniform distribution in the interval [0, 1] and solving the equation:
 | (20) |
 | (21) |
(3) Identify the process involving the enzyme that occurred at δt by selecting the specific process with probabilities equal to:
and
respectively.
(4) Modify the numbers NE, NEX and NEX2 according to the process selected in step (3) and change the value of x by ±e0/N0 to take into account production or consumption of a single X molecule in the selected reaction.
(5) Update time (t = t + δt) and repeat (1) until the selected time of system simulation (tmax) is reached.
4 Results
The algorithm described in the previous section generates a stochastic evolution that takes into account the discrete character of reactions involving the enzyme. Having the value of y(t) we can define the probability pU that the evolution belongs to type-U oscillations as:| pU = μ(y(s) > 6|s ∈ [tmin, tmax])/(tmax − tmin) | (22) |
| pL = μ(y(s) ≤ 6|s ∈ [tmin, tmax])/(tmax − tmin) | (23) |
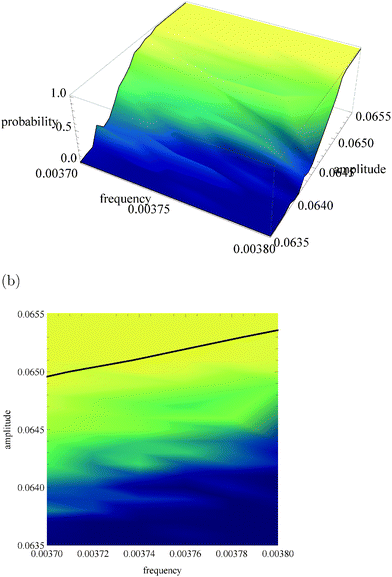
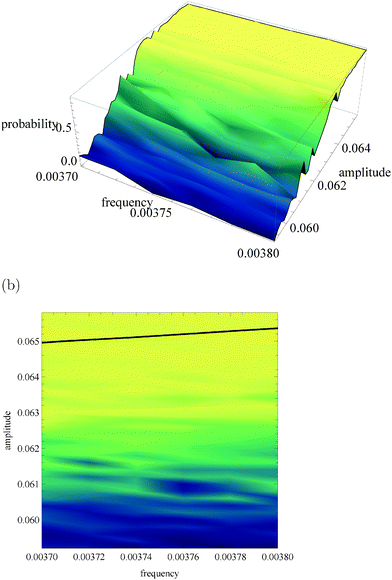
Fig. 5a, 6a and 7a show pU(ν, A) in the form of 3D plots for N0 = 10![[thin space (1/6-em)]](https://www.rsc.org/images/entities/char_2009.gif) 000, 1000 and 100, respectively. For each pair (ν, A) the result is averaged over 50 independent evolutions that are initiated from: NEX(t = 0) = NEX2(t = 0) = 0, NE(t = 0) = N0, x(t = 0) = 0 and y(t = 0) = 0. The range of ν and A is the same as that used in Fig. 3. The same result, showing the value of pU(ν, A) coded in color, is given in Fig. 5b, 6b and 7b. The black solid line in these figures separates regions of type-L and type-U oscillations obtained from phenomenological kinetic equations describing the full reaction model (eqn (1)–(5)) and it is the same as in Fig. 3 and 4.
000, 1000 and 100, respectively. For each pair (ν, A) the result is averaged over 50 independent evolutions that are initiated from: NEX(t = 0) = NEX2(t = 0) = 0, NE(t = 0) = N0, x(t = 0) = 0 and y(t = 0) = 0. The range of ν and A is the same as that used in Fig. 3. The same result, showing the value of pU(ν, A) coded in color, is given in Fig. 5b, 6b and 7b. The black solid line in these figures separates regions of type-L and type-U oscillations obtained from phenomenological kinetic equations describing the full reaction model (eqn (1)–(5)) and it is the same as in Fig. 3 and 4.
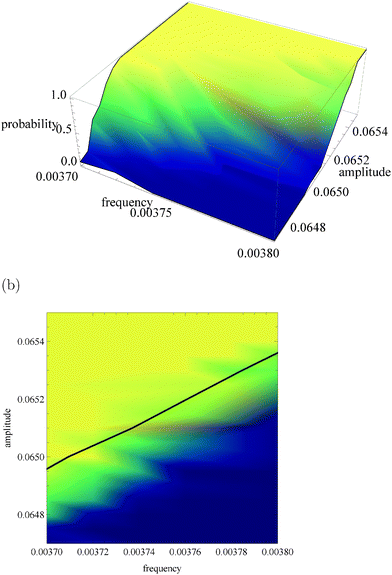 | ||
Fig. 5 The function pU(ν, A) for N0 = 10![[thin space (1/6-em)]](https://www.rsc.org/images/entities/char_2009.gif) 000. (a) 3D plot of probability; (b) the same data as a surface plot; the solid line separates regions of type-L and type-U oscillations and it is the same as on Fig. 3 and 4. 000. (a) 3D plot of probability; (b) the same data as a surface plot; the solid line separates regions of type-L and type-U oscillations and it is the same as on Fig. 3 and 4. | ||
 | ||
| Fig. 6 The function pU(ν, A) for N0 = 1000. (a) 3D plot of probability; (b) the same data as a surface plot; the solid line separates regions of type-L and type-U oscillations and it is the same as in Fig. 3 and 4. | ||
 | ||
| Fig. 7 The function pU(ν, A) for N0 = 100. (a) 3D plot of probability, (b) the same data as a surface plot, the solid line separates regions of type-L and type-U oscillations and it is the same as on Fig. 3 and 4. | ||
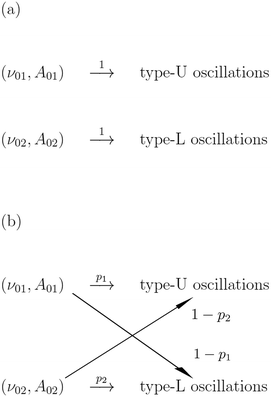
In order to make a qualitative estimation of discriminator reliability let us simplify the device and assume that the binary input information is introduced in the form of two different inflows. One of them is characterized by the frequency ν01 and the amplitude A01 (state 0) and the other is described by (ν02, A02) (state 1). The discriminator is supposed to recognize the input and produce type-U oscillations in the first case and type-L oscillations in state 1. At the beginning let us consider ν01 = ν02 = 0.0037, A01 = 0.0652 and A02 = 0.0648. According to the results shown in Fig. 2 the reaction with a large number of enzyme molecules performs the required operation, so it discriminates the input inflow according to its amplitude. The discriminator accuracy is better than 0.0004 amplitude unit. Similarly for A01 = A02 = 0.065, ν01 = 0.0037 and ν02 = 0.0038 the reaction functions as a discriminator of the inflow frequency. Such simplified discrimination activity can be interpreted as a signal transmission through a communication channel. The idea is illustrated in Fig. 8. The basic quantity characterizing a communication channel is the channel capacity.28 It represents the maximum amount of information that can be transmitted through the channel within a single operation. If the number of enzyme molecules is very large then the reaction works as a noiseless binary communication channel and for both amplitude and frequency discrimination its capacity is Camp = Cfreq = 1 bit. In the case of a small number of molecules the reaction represents a noisy communication channel with probabilities of correct discrimination p1 and p2. For the considered numbers of molecules the value of p1 = pU(ν, A) is given in Fig. 5–7. The value of p2 = 1 − pU(ν, A). The capacity of asymmetric binary channel is:
| C = βh(p1) + (1 − β)h(p2) − h(βp1 + (1 − β)(1 − p2)) | (24) |
and
If p1 = 1 − p2 then the channel capacity C = 0. It reflects an obvious fact that a channel that gives exactly the same answer to both input values does not transmit any information.
For N0 = 10![[thin space (1/6-em)]](https://www.rsc.org/images/entities/char_2009.gif) 000 (Fig. 5) the system response to an oscillating inflow, predicted by the deterministic kinetic equations agrees well with the stochastic simulations. The phenomenological line separating regions corresponding to different oscillation types is located in the region where the gradient of pU(ν, A) is large. It gives a reasonable estimation for separation of the region where pU(ν, A) is small (blue color) from the region where pU(ν, A) ∼ 1 (yellow color). A more precise separation of these regions can be obtained if the separating line is shifted by 0.0001 unit towards smaller amplitudes. Therefore, it can be expected that the system with N0 = 10
000 (Fig. 5) the system response to an oscillating inflow, predicted by the deterministic kinetic equations agrees well with the stochastic simulations. The phenomenological line separating regions corresponding to different oscillation types is located in the region where the gradient of pU(ν, A) is large. It gives a reasonable estimation for separation of the region where pU(ν, A) is small (blue color) from the region where pU(ν, A) ∼ 1 (yellow color). A more precise separation of these regions can be obtained if the separating line is shifted by 0.0001 unit towards smaller amplitudes. Therefore, it can be expected that the system with N0 = 10![[thin space (1/6-em)]](https://www.rsc.org/images/entities/char_2009.gif) 000 enzyme molecules should work as a reliable discriminator of the periodic inflow, just as described in Section 2. The reliability of amplitude and frequency discriminators described above, measured as the capacity of asymmetric channels, is equal to: Camp = 0.355 bit and Cfreq = 0.882 bit. The capacity of the amplitude discriminator can be increased if the input amplitudes are decreased by 0.0001 unit. For ν01 = ν02 = 0.0037, A01 = 0.0651 and A02 = 0.0647 we obtain Camp2 = 0.849 bit. Therefore, for N0 = 10
000 enzyme molecules should work as a reliable discriminator of the periodic inflow, just as described in Section 2. The reliability of amplitude and frequency discriminators described above, measured as the capacity of asymmetric channels, is equal to: Camp = 0.355 bit and Cfreq = 0.882 bit. The capacity of the amplitude discriminator can be increased if the input amplitudes are decreased by 0.0001 unit. For ν01 = ν02 = 0.0037, A01 = 0.0651 and A02 = 0.0647 we obtain Camp2 = 0.849 bit. Therefore, for N0 = 10![[thin space (1/6-em)]](https://www.rsc.org/images/entities/char_2009.gif) 000 the presence of internal fluctuations does not significantly change the functionality of a discriminator based on an enzymatic reaction. For the considered reaction parameters it can operate as a reliable discriminator of amplitudes that differ by 0.0004 unit or frequencies that differ by 0.0001 unit.
000 the presence of internal fluctuations does not significantly change the functionality of a discriminator based on an enzymatic reaction. For the considered reaction parameters it can operate as a reliable discriminator of amplitudes that differ by 0.0004 unit or frequencies that differ by 0.0001 unit.
For N0 = 1000 (Fig. 6) the region of type-L oscillations is even more shifted towards smaller values of A if compared to predictions of phenomenological kinetic equations. Qualitatively a similar trend was observed for a thermochemical discriminator of temperature described in ref. 24. Now the line separating regions corresponding to different types of oscillations are located in the region, where the stochastic model predicts a high probability of type-U oscillations. Therefore, if N0 = 1000 the analysis presented in Section 2 fails to describe correctly the discriminating potential of the considered reaction. The capacity of channels representing amplitude and frequency discriminators considered above is Camp = 0.038 bit and Cfreq = 0.094 bit. For N0 = 1000 the transition between type-L and type-U oscillations is still well pronounced but it is shifted towards low amplitudes by 0.001 unit if compared with phenomenological kinetic equations. In order to find the optimum conditions for a discriminator of amplitudes that differ by 0.0004 unit let us consider: ν01 = ν02 = 0.0037, A01 = 0.0645 and A02 = 0.0641 The capacity of the corresponding information channel is Camp3 = 0.157 bit, and thus it is over 4 times larger than Camp. In order to discriminate frequency one can use A01 = A02 = 0.0645, ν01 = 0.0037 and ν02 = 0.0038 and Cfreq2 = 0.238 bit. For such inputs the discriminator needs at least 1/Cfreq2 ∼ 1/Camp3 ∼ 5 observations for a correct estimation. In conclusion, the system with N0 = 1000 can operate as a discriminator, but the phenomenological approach is useless for estimation of the range of frequencies or amplitudes where it can operate. The accurate analysis should take internal fluctuations into account.
For N0 = 100 (cf.Fig. 7) the region where a gradient of pU(ν, A) is observed is shifted towards a smaller amplitude by ∼0.004 unit with respect to kinetic equations. The parameters of input signals considered for N0 = 10![[thin space (1/6-em)]](https://www.rsc.org/images/entities/char_2009.gif) 000 or N0 = 1000 are located in the region where for N0 = 100 pU(ν, A) is almost constant and close to 1. The capacity of corresponding communication channels is close to zero. If N0 = 100 then the reaction can be still useful as an amplitude discriminator if the amplitudes of input signals are significantly reduced and the resolution of the discriminator is much smaller. For example if ν01 = ν02 = 0.0037, A01 = 0.064 and A02 = 0.060 then the corresponding channel capacity is Camp4 = 0.433 bit. The function pU(ν, A) does not depend on the frequency in the considered range of (ν, A), so for N0 = 100 the reaction does not work as a frequency discriminator.
000 or N0 = 1000 are located in the region where for N0 = 100 pU(ν, A) is almost constant and close to 1. The capacity of corresponding communication channels is close to zero. If N0 = 100 then the reaction can be still useful as an amplitude discriminator if the amplitudes of input signals are significantly reduced and the resolution of the discriminator is much smaller. For example if ν01 = ν02 = 0.0037, A01 = 0.064 and A02 = 0.060 then the corresponding channel capacity is Camp4 = 0.433 bit. The function pU(ν, A) does not depend on the frequency in the considered range of (ν, A), so for N0 = 100 the reaction does not work as a frequency discriminator.
5 Conclusions
In this paper we presented arguments that an enzymatic reaction can function as a medium for analyzing information coded in the frequency and amplitude of the reagent inflow. There are many parameters (rate constants and concentrations of reagents in excess) in the considered reaction model. Therefore, there is a broad range of parameter values, at which the reaction can be used as a discriminator. We restricted our attention to the cases in which reactions involving the enzyme and its complexes can be regarded as faster than the other processes. We reduced the full reaction model to two kinetic equations and selected parameter values such that in the reduced model one of its nullclines has a sigmoidal form. Using arguments given in ref. 23 we estimated the range of input frequencies or amplitudes in which a sharp transition between different forms of oscillations in product concentration, necessary for discrimination, is observed. The precise calculations of discriminator characteristics were based on the complete reaction model, which provides a more realistic description of the dynamic response than the reduced model. On the basis of phenomenological kinetic equations we have shown that the considered reaction separates the space of input states into two output classes. The output classes can be easily distinguished, because the corresponding concentrations of reaction products are significantly different. The considered enzymatic reaction significantly enhances differences between inputs, especially for the input states located close to the line separating different answers of the system. According to the kinetic equations the reaction can transform small relative differences in the input amplitude of the order of 10−3 into relative differences in output concentrations of the order of 1.Having in mind that information processing in simple living organisms is incorporated into their metabolic cycle we analyzed the case where the number of enzyme molecules is small and the internal fluctuations related to reactions involving enzyme molecules and its complexes should be taken into account. Such analysis was performed using a master equation that describes the probability of finding a specific state of a system as a function of time. We considered a narrow range of frequencies and amplitudes and studied discriminators operating with N0 = 10![[thin space (1/6-em)]](https://www.rsc.org/images/entities/char_2009.gif) 000, 1000 and 100 enzyme molecules. The conclusions coming from phenomenological kinetic equations were qualitatively confirmed by the stochastic analysis based on kinetic Monte-Carlo simulations. For N0 = 10
000, 1000 and 100 enzyme molecules. The conclusions coming from phenomenological kinetic equations were qualitatively confirmed by the stochastic analysis based on kinetic Monte-Carlo simulations. For N0 = 10![[thin space (1/6-em)]](https://www.rsc.org/images/entities/char_2009.gif) 000 the results of stochastic simulations match quite well the phenomenology. The discrepancy between kinetic equations and stochastic simulations becomes important when N0 gets smaller. For N0 = 1000 the reaction still operates as a discriminator, but the range of frequencies and amplitudes for which it is useful is different than predicted by the phenomenology. For yet smaller N0 (=100) the considered range of frequencies was too small and the medium was not able to discriminate between inputs corresponding to different frequencies. The reaction with N0 = 100 can still function as the amplitude discriminator, but its resolution is an order of magnitude smaller than that for N0 = 1000.
000 the results of stochastic simulations match quite well the phenomenology. The discrepancy between kinetic equations and stochastic simulations becomes important when N0 gets smaller. For N0 = 1000 the reaction still operates as a discriminator, but the range of frequencies and amplitudes for which it is useful is different than predicted by the phenomenology. For yet smaller N0 (=100) the considered range of frequencies was too small and the medium was not able to discriminate between inputs corresponding to different frequencies. The reaction with N0 = 100 can still function as the amplitude discriminator, but its resolution is an order of magnitude smaller than that for N0 = 1000.
It is interesting to notice that the estimation of the number of particles needed for information processing with an enzymatic reaction gives similar results as for the recently analyzed thermochemical discriminator.24 It was found that such a discriminator of the ambient temperature needs more than 105 molecules for a reliable operation. Here the number is around 1000 molecules of the enzyme only. Including the other reagents the total number of active particles involved in information processing is of the order of millions, which fairly agree with the previous estimation.
Acknowledgements
This work was supported by Bilateral Joint Research Program between Japanese Society for Promotion of Science and the Polish Academy of Sciences within a joint research project: Spontaneous creation of chemical computing structures based on interfacial interactions. It was also partly supported by JSPS KAKENHI Grant Number 15H02121 and 25103012.References
- H. Haken, Brain Dynamics: An Introduction to Models and Simulations, Springer Series in Synergetics, Springer, 2008 Search PubMed.
- Biomolecular Information Processing. From Logic Systems to Smart Sensors and Actuators, ed. E. Katz, Wiley-VCH Verlag, 2012 Search PubMed.
- Molecular and Supramolecular. From Molecular Switches to Logic Systems Information Processing, ed. E. Katz, Wiley-VCH Verlag, 2012 Search PubMed.
- F. Muzika and I. Schreiber, J. Chem. Phys., 2013, 139, 164108 CrossRef PubMed.
- V. Privman, O. Zavalov, L. Halamkova, F. Moseley, J. Halamek and E. Katz, J. Phys. Chem. B, 2013, 117, 14928–14939 CrossRef CAS PubMed.
- E. Katz and V. Privman, Chem. Soc. Rev., 2010, 39, 1835–1857 RSC.
- L. Michaelis and M. L. Menten, Die Kinetik der Invertinwirkung, Biochem. Z., 1913, 49, 333–369 Search PubMed , the recent English translation: K. A. Johnson and R. S. Goody, Biochemistry, 2011, 50, 8264–8269 CrossRef CAS PubMed.
- V. Privman, J. Halamek, M. A. Arugula, D. Melnikov, V. Bocharova and E. Katz, J. Phys. Chem. B, 2010, 114, 14103–14109 CrossRef CAS PubMed.
- M. Pita, V. Privman, M. A. Arugula, D. Melnikov, V. Bocharova and E. Katz, Phys. Chem. Chem. Phys., 2011, 13, 4507–4513 RSC.
- S. Domansky and V. Privman, J. Phys. Chem. B, 2012, 116, 13690–13695 CrossRef PubMed.
- V. Privman, B. E. Fratto, O. Zavalov, J. Halamek and E. Katz, J. Phys. Chem. B, 2013, 117, 7559–7568 CrossRef CAS PubMed.
- R. A. Laskowski, F. Gerick and J. M. Thornton, FEBS Lett., 2009, 583, 1692–1698 CrossRef CAS PubMed.
- T. Tsuruyama, T. Nakamura, G. Jin, M. Ozeki, Y. Yamada and H. Hiai, Proc. Natl. Acad. Sci. U. S. A., 2002, 99, 8253–8258 CrossRef CAS PubMed.
- T. Tsuruyama, PLoS One, 2014, 9, e102911 Search PubMed.
- K.-P. Zauner and M. Conrad, Biotechnol. Prog., 2001, 17, 553–559 CrossRef CAS PubMed.
- J. D. Rabinowitz, J. J. Hsiao, K. R. Gryncel, E. R. Kantrowitz, X.-J. Feng, G. Li and H. Rabitz, Biochemistry, 2008, 47, 5881–5888 CrossRef CAS PubMed.
- S. Bakshi, O. Zavalov, J. Halamek, V. Privman and E. Katz, J. Phys. Chem. B, 2013, 117, 9857–9865 CrossRef CAS PubMed.
- H. C. Barrett, Mind and Language, 2005, 20, 259–287 CrossRef.
- J. Halamek, O. Zavalov, L. Halamkova, S. Korkmaz, V. Privman and E. Katz, J. Phys. Chem. B, 2012, 116, 4457–4464 CrossRef CAS PubMed.
- O. Zavalov, V. Bocharova, V. Privman and E. Katz, J. Phys. Chem. B, 2012, 116, 9683–9689 CrossRef CAS PubMed.
- H. Lederman, J. Macdonald, D. Stefanovic and M. N. Stojanovic, Biochemistry, 2006, 45, 1194–1199 CrossRef CAS PubMed.
- R. Baron, O. Lioubashevski, E. Katz, T. Niazov and I. Willner, Angew. Chem., Int. Ed., 2006, 45, 1572–1576 CrossRef CAS PubMed.
- H. Ueno, T. Tsuruyama, B. Nowakowski, J. Gorecki and K. Yoshikawa, Chaos, 2015, 25, 103115 CrossRef PubMed.
- J. Gorecki, B. Nowakowski, J. N. Gorecka and A. Lemarchand, Phys. Chem. Chem. Phys., 2016, 18, 4952–4960 RSC.
- A. V. Hill, J. Physiol., 1910, 40, 389–403 CrossRef CAS.
- S. Goutelle, M. Maurin, F. Rougier, X. Barbaut, L. Bourguignon, M. Ducher and P. Maire, Fundam. Clin. Pharmacol., 2008, 22, 633–648 CrossRef CAS PubMed.
- D. T. Gillespie, Annu. Rev. Phys. Chem., 2007, 58, 35 CrossRef CAS PubMed.
- T. M. Cover and J. A. Thomas, Elements of Information Theory, Wiley and Sons, Hoboken, NJ, 2nd edn, 2006 Search PubMed.
- K. Maurin, Analysis, part II, Springer, Netherlands, 1980 Search PubMed.
| This journal is © the Owner Societies 2016 |

