 Open Access Article
Creative Commons Attribution 3.0 Unported Licence
A neutron scattering and modelling study of aqueous solutions of tetramethylammonium and tetrapropylammonium bromide†
Emelie J.
Nilsson
a,
Viveka
Alfredsson
a,
Daniel T.
Bowron
b and
Karen J.
Edler
*ac
aPhysical Chemistry, KILU, Lund University, P.O. Box 124, SE-22100 Lund, Sweden
bISIS, Science and Technology Facilities Council Rutherford Appleton Laboratory, Harwell Oxford, Didcot OX11 0QX, UK
cDepartment of Chemistry, University of Bath, Claverton Down, Bath, BA2 7AY, UK. E-mail: k.edler@bath.ac.uk
First published on 31st March 2016
Abstract
We have investigated the properties in water of two tetraalkylammonium bromides (tetramethylammonium, TMA+, and tetrapropylammonium, TPA+), at 0.4 M, using neutron scattering coupled with empirical potential structure refinement to arrive at an atomistic description. Having both a polar and an apolar moiety, it is of interest to determine the strength of each moiety as a function of the alkyl chain length. TMA+ and TPA+, having different impact as structure directors in zeolite synthesis, were chosen for this study. Water arranges tetrahedrally around TMA+ and in an almost featureless manner around TPA+. TMA+ and TPA+ show an apolar hydration with TPA+ being slightly more apolar. TPA+ has a tendency to form small clusters of 2–4 molecules and to fold into a compact configuration. Both molecules correlate similarly with the bromide ion but do not dissociate completely at this concentration.
Introduction
The nature of tetraalkylammonium ions (TAA+) in aqueous solutions has for many years been the subject of investigations, including measurements of the change in apparent molal volumes,1,2 NMR measurements,3,4 neutron scattering experiments with various counterions5–9 as well as computer simulations, including both molecular dynamics (MD) and Monte Carlo (MC) methods.10–14 These ions are of interest as they contain both a charged moiety, and a hydrophobic moiety and, in addition, have a symmetrical geometry. This makes them ideal model molecules for probing the strength and importance of interactions present in aqueous solutions; the hydrophobic strength can easily be varied as a function of the carbon chain length.The introduction of a TAA+ as structure directing agents in 1978 by Flanigen et al. made it possible to synthesise high silica zeolites.15 Understanding the mechanistic role of the template is one of the central problems for comprehending zeolite synthesis and thus an important step towards rational zeolite design. The ions are suggested to act as structure directing agents, templating the channels within the zeolite. The beneficial interaction between TPA+ and inorganic species is a consequence of the minimisation of the hydration shells. The complexes thus formed then aggregate, nucleate and finally crystallise into zeolites, with TPA+ arranged within the channel network.16 However, it has also been proposed that the TAA+ ions provide stability by attaching to the surface of the initial silica cluster.17
Pham et al.18 investigated zeolite (silicalite-1) films grown in the presence of a silica gel on a substrate with oriented seed crystals. Differently sized TAA+ ions were observed to have different functions. With small TAA+ ions (TEA+ but also TMA+) present in the gel, a uniform film grew with the same orientation as the seed crystals. On the other hand, the orientation was lost if TPA+ ions were present. Not only the growth behaviour was dissimilar but also the nucleation; the seed crystals could only be grown in the presence of the TPA+ ions. Hence, the larger TAA+ ions initiate nucleation whereas the smaller ions (TEA+ and TMA+) only propagate growth.
The size of the TAA+ ion has also been shown to affect speciation in silicate solutions.19 Kinrade et al.20,21 showed that TMA+ ions favour formation of cubic octamers (i.e. a double four ring occurring as a smaller building unit in many zeolites) in aqueous solutions at certain silica concentrations. They found that the larger the TAA+ ion, the more difficult it became to control the formation of the cubic octamer. Smaller TAA+ hence provide more efficient stability, which was explained to originate from the larger charge-to-radius ratio, allowing the smaller ions to better screen the charges of the silicate species, which protect them from hydrolysis. The larger ions have a smaller charge-to-radius ratio and do not associate as strongly to the silicate species, unless organic co-solvents are added to the solution. They are therefore not efficient in protecting the octamer against hydrolysis. Caratzoulas et al.22 have performed molecular dynamics (MD) simulations of TMA+ ions and silica octamers in aqueous solutions, and found a concentration dependence of the TMA+. At lower concentration the TMA+ did not associate to the cubic octamers although it did for higher concentrations where one TMA+ was associated, in a highly dynamic system, with each side of the cube, expelling the water on the sides away from the siloxane oxygen.
This change in behaviour with size of the TAA+ focuses the discussion towards two of the tetraalkylammonium ion's most distinct properties. Do they act as hydrophobic or cationic species, or as both? Or, is the behaviour only a matter of size?
One way to characterise these properties is to investigate the water distribution around the ions. Water turns its oxygen towards a positively charged moiety whereas for an apolar species water has no preferred orientation. This has been studied for aqueous TMACl (concentrations ranging from 1TMA![[thin space (1/6-em)]](https://www.rsc.org/images/entities/char_2009.gif) :
:![[thin space (1/6-em)]](https://www.rsc.org/images/entities/char_2009.gif) 6.25H2O to 1TMA
6.25H2O to 1TMA![[thin space (1/6-em)]](https://www.rsc.org/images/entities/char_2009.gif) :
:![[thin space (1/6-em)]](https://www.rsc.org/images/entities/char_2009.gif) 100H2O) solutions by Turner et al.7,8 using neutron scattering. They found evidence of hydration of the TMA+ that is not characteristic of a cation but rather of an apolar species.8,9 Evidence was found that at high concentrations, 4.0 molal TMACl, the TMA+ ions were in close contact5 but no evidence of actual ion-pairing was presented. The bromide salts of the larger TAA+ ions, tetrapropylammonium (TPA+) and tetrabutylammoinum (TBA+),6 have been suggested to have a more ordered water arrangement compared to the TMA+ system or that of pure water. However, Polydorou et al.10 used reverse Monte Carlo simulations of a TPA+ solution, using neutron diffraction data, and demonstrated that water was less organised around the larger TPA+ ion than in bulk water. Despite the different conclusions concerning the water arrangement these studies consider the TAA+ ions to act as apolar species.
100H2O) solutions by Turner et al.7,8 using neutron scattering. They found evidence of hydration of the TMA+ that is not characteristic of a cation but rather of an apolar species.8,9 Evidence was found that at high concentrations, 4.0 molal TMACl, the TMA+ ions were in close contact5 but no evidence of actual ion-pairing was presented. The bromide salts of the larger TAA+ ions, tetrapropylammonium (TPA+) and tetrabutylammoinum (TBA+),6 have been suggested to have a more ordered water arrangement compared to the TMA+ system or that of pure water. However, Polydorou et al.10 used reverse Monte Carlo simulations of a TPA+ solution, using neutron diffraction data, and demonstrated that water was less organised around the larger TPA+ ion than in bulk water. Despite the different conclusions concerning the water arrangement these studies consider the TAA+ ions to act as apolar species.
Here we set out to explore the properties of two TAA+ systems, TMA+ and TPA+ in water, with the aim to investigate if the TAA+ ions should be considered as cations or as apolar species. Is this property shifted as a consequence of the chain length and can this be related to the observed difference in structure directing properties in silicalite-1 synthesis? We have used the respective bromide salts, and can thus also investigate the effect of the TMA-counterion (Br and Cl) by comparing with previous studies.7 We have used a combination of near and intermediate angle neutron scattering (NS) and EPSR modelling (Empirical Potential Structure Refinement)23 to arrive at an atomistic description of the systems. This combination generates a three-dimensional model, fitted to the neutron diffraction pattern, which provides a more detailed description of the system. This specific combination has previously and successfully provided atomistic information for an aqueous micellar solution of decyltrimethylammonium bromide,24 C10TAB, which is related to our TAA+ species (one small alkyl group exchanged with a decyl group). This method of investigation is a powerful tool to arrive at an understanding of the molecular interactions on an atomistic level.
Experimental details
Isotope substitution25 is a powerful aspect of neutron diffraction since it provides a way to probe pair correlations for different atomic species in a material, by making use of the fact that isotopes frequently have different scattering lengths (available in ref. 26). The method itself makes a tacit assumption that isotopic differences between the constituent elements of a system do not affect its underlying structure. This is largely true, provided the system is not too close to a phase boundary whose existence is mass sensitive. If possible, systematic substitution of all atomic species in a system can facilitate the extraction of all atom-pair correlations that characterise its structure. Unfortunately this complete characterisation is rarely achievable since systems are often too complex and practically for reasons of both isotope availability and cost, only a few substitutions are available. However, one powerful and readily available isotope substitution is the one of hydrogen with deuterium. These isotopes have very different scattering lengths and in many cases of interest are known not to introduce any significant alterations to the structure of the system. In molecular mixtures neutron scattering with H/D substitution can often provide the critical insight into the important inter-molecular correlations27 that underpin a system's physical and chemical properties.In practice in a neutron scattering experiment the differential scanning cross-section is measured and then by appropriate calibration and correction for background, multiple scattering and inelastic self-scattering, the total scattering factor, F(Q), can be retrieved. The magnitude of the momentum transfer, Q, is defined as Q = (4π/λ)sin![[thin space (1/6-em)]](https://www.rsc.org/images/entities/char_2009.gif) θ, where λ is the wavelength of the incoming beam and θ is half of the scattering angle. Using this the total scattering factor, F(Q), can be written using the concentrations of the atomic species, cα, and their scattering lengths, bα, as:
θ, where λ is the wavelength of the incoming beam and θ is half of the scattering angle. Using this the total scattering factor, F(Q), can be written using the concentrations of the atomic species, cα, and their scattering lengths, bα, as:
where ρ0 is the atomic number density of the sample.
Using only one isotope substitution, as in the case with hydrogen and deuterium, will lead to a system that is underdetermined. However, a solution to this problem is to analyse the data by structural modelling refined against the experimental data. This approach makes use of known physical and chemical parameters to constrain the model and re-create structural and atomistic information about the system.23 Each extra data set of isotope-substituted samples will consequently provide additional information to the refinement of the model and increase the reliability of the model.
Neutron diffraction experiments
0.4 M solutions of TMABr and TPABr, respectively, were prepared by dissolving the salt in millipore water (H2O), in D2O from Sigma-Aldrich (99.9 atom% D) or in a 1![[thin space (1/6-em)]](https://www.rsc.org/images/entities/char_2009.gif) :
:![[thin space (1/6-em)]](https://www.rsc.org/images/entities/char_2009.gif) 1 molar ratio of H2O/D2O. Fully hydrogenated C4H12N(Br) (h12-TMABr) and C12H28N(Br) (h28-TPABr), were purchased from Acros Organics and the fully deuterated versions C4D12N(Br) (d12-TMABr) and C12D28N(Br) (d28-TMABr) were purchased from CDN-isotopes (99 atom% D and 98 atom%, respectively). The chemicals were used without further purification.
1 molar ratio of H2O/D2O. Fully hydrogenated C4H12N(Br) (h12-TMABr) and C12H28N(Br) (h28-TPABr), were purchased from Acros Organics and the fully deuterated versions C4D12N(Br) (d12-TMABr) and C12D28N(Br) (d28-TMABr) were purchased from CDN-isotopes (99 atom% D and 98 atom%, respectively). The chemicals were used without further purification.
Data was collected using NIMROD, the near and intermediate range order diffractometer at STFC's ISIS Neutron Scattering Facility, UK.28 NIMROD has the capacity of measuring features within a range of 1 Å to 300 Å, and is well suited for measuring liquids. NIMROD is also suitable for measuring samples with hydrogen isotope substitution. Five isotope contrasts for the TMABr and TPABr, see Table 1, were measured at 25 °C.
| Sample | TMABr/TPABr | Solvent |
|---|---|---|
| (i) | C4H12N(Br)/C12H28N(Br) | D2O |
| (ii) | C4D12N(Br)/C12D28N(Br) | D2O |
| (iii) | 1![[thin space (1/6-em)]](https://www.rsc.org/images/entities/char_2009.gif) : :![[thin space (1/6-em)]](https://www.rsc.org/images/entities/char_2009.gif) 1 mol ratio C4H12N(Br) 1 mol ratio C4H12N(Br)![[thin space (1/6-em)]](https://www.rsc.org/images/entities/char_2009.gif) : :![[thin space (1/6-em)]](https://www.rsc.org/images/entities/char_2009.gif) C4D12N(Br)/1 C4D12N(Br)/1![[thin space (1/6-em)]](https://www.rsc.org/images/entities/char_2009.gif) : :![[thin space (1/6-em)]](https://www.rsc.org/images/entities/char_2009.gif) 1 mol ratio C12H28N(Br) 1 mol ratio C12H28N(Br)![[thin space (1/6-em)]](https://www.rsc.org/images/entities/char_2009.gif) : :![[thin space (1/6-em)]](https://www.rsc.org/images/entities/char_2009.gif) C12D28N(Br) C12D28N(Br) |
D2O |
| (iv) | C4D12N(Br)/C12D28N(Br) | 1![[thin space (1/6-em)]](https://www.rsc.org/images/entities/char_2009.gif) : :![[thin space (1/6-em)]](https://www.rsc.org/images/entities/char_2009.gif) 1 mol ratio H2O/D2O 1 mol ratio H2O/D2O |
| (v) | C4D12N(Br)/C12D28N(Br) | H2O |
1.4 ml of sample was measured in flat plate cells made of a null scattering TiZr alloy, with a wall thickness of 1 mm and a sample thickness of 1 mm, exposed to a square beam profile (30 mm × 30 mm). The cells were loaded into the automatic sample changer, which held a temperature of 25 °C during the measurements. The counting time was set to 2 hours. Empty cells and a vanadium plate, used as a standard, were measured for the same duration of time. Data was corrected using the Gudrun program.29
Modelling of the system
Three-dimensional atomistic structures of the systems were constructed using Empirical Potential Structure Refinement (EPSR),23,30,31 which is a variant of reverse Monte Carlo (RMC). EPSR refines the system by adding an empirical potential to the classical pair interaction potential, which functions as a reference potential. The reference potential, used to equilibrate the starting system, is based on Lennard-Jones parameters and Coulomb interactions. The empirical potential (EP) originates from the difference between the simulated and experimental total scattering factors, and is altered in an iterative process to drive the configurations in the system towards an agreement with the experimental data. This will provide a description of our system, which is constrained by a set of physical parameters, e.g. solution density, known chemistry of molecules and geometry. EPSR allows the molecules to have an intramolecular disorder and each individual molecule will have a unique geometry. However, all molecules are held rigid in the MC movement.This yields a three-dimensional reconstruction of the system permitting us to retrieve all site–site radial distribution functions that together form the observed total distribution function. Due to the fact that some of the distributions have a weakly weighted contribution this technique will provide a more reliable description if the weak sites are connected to a group that scatters more strongly. For a more in depth description of EPSR see ref. 23, 30 and 31.
The simulations used 50 TMABr or TPABr molecules and 6250 water molecules in a cubic box with the dimensions of 58.1 Å and 59.3 Å respectively, corresponding to an experimental density of 0.1 atom per Å3. This corresponds to 0.4 M solutions of TMABr or TPABr in water. To facilitate the interpretation of the simulation results, the different atoms have been assigned a label. The labels used are as follows: N for the central nitrogen atom, C1, C2 and C3 are the carbon sites in the TAA+ counting from the innermost carbon (hence TMA+ only has the C1 carbon), M is the hydrogen, Br is the bromide ion and OW and HW are the oxygen and hydrogen of water (see Fig. 1). The Lennard-Jones parameters and charges used for the reference potential can be seen in Table 2. The averaged intramolecular bond distances are listed in Table 3. All atoms were allowed to rotate freely about their bonds, except for the innermost carbon (C1) on the TPA+ to avoid unphysical overlaps within the molecule.
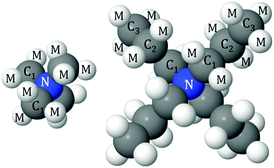 | ||
| Fig. 1 Schematic illustration and the labels of the different atoms in TMA+ (left) and TPA+ (right). | ||
| Atom type | ε [kJ mol−1] | σ [Å] | Mass [amu] | q [e] |
|---|---|---|---|---|
| a Based on values from ref. 24. b From ref. 32. c From the SPC/E potential.33 | ||||
| N – nitrogena | 0.2000 | 3.200 | 14 | +1.0000 |
| C1 – carbona | 0.2000 | 3.700 | 12 | 0.0000 |
| C2, C3 – carbona | 0.2000 | 3.960 | 12 | 0.0000 |
| M – hydrogena | 0.2000 | 2.579 | 2.0 | 0.0000 |
| Br – bromineb | 0.5659 | 4.465 | 80 | −1.0000 |
| Ow – oxygenc | 0.6500 | 3.165 | 16 | −0.8476 |
| Hw – hydrogenc | 0.0000 | 0.000 | 2.0 | +0.4238 |
| Species | Bond | d αβ [Å] |
|---|---|---|
| TMA+/TPA+ | N–C | 1.34 |
| C–C | 1.53 | |
| C–M | 1.10 | |
| Water | Ow–Hw | 0.976 |
All simulations were run at least twice, starting with different initial configurations. In addition to the box containing 50 TMABr/TPABr molecules, a larger simulation, consisting of 100 TMABr/TPABr molecules and 12![[thin space (1/6-em)]](https://www.rsc.org/images/entities/char_2009.gif) 500 water molecules, with box sizes 73.2 Å and 74.7 Å respectively, were used to exclude possible size effects. All simulations were run at 25 °C to correspond to the experimental condition. The simulations started from a randomly generated configuration and in a 10 times larger box that was gradually reduced in size to obtain the desired density and minimize possible molecular overlap. When the desired density was reached the system was allowed to attain an equilibrated energy level. Afterwards the empirical refinement was switched on, and once more the system was allowed to equilibrate into configurations that agree with the constraints imposed by the experimental scattering data. Once equilibrium was reached the accumulation of structural information started.
500 water molecules, with box sizes 73.2 Å and 74.7 Å respectively, were used to exclude possible size effects. All simulations were run at 25 °C to correspond to the experimental condition. The simulations started from a randomly generated configuration and in a 10 times larger box that was gradually reduced in size to obtain the desired density and minimize possible molecular overlap. When the desired density was reached the system was allowed to attain an equilibrated energy level. Afterwards the empirical refinement was switched on, and once more the system was allowed to equilibrate into configurations that agree with the constraints imposed by the experimental scattering data. Once equilibrium was reached the accumulation of structural information started.
Results and discussion
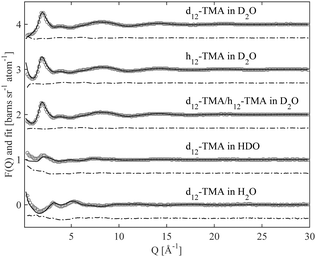
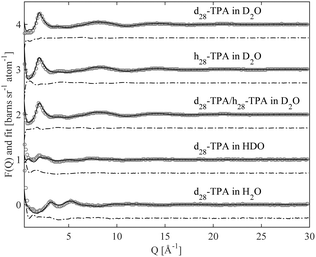
Fig. 2 and 3 show the experimentally measured F(Q) data sets, for the five different isotopic samples, of TMABr and TPABr respectively. Displayed in the same figures are the modelled F(Q) functions for the different isotopic compositions, along with the difference between the measured data and the model.The overall qualities of the fits are very good. The difference between the fit and the data is small for all isotopic contrasts in both systems, providing confidence in the accuracy of the model and the assumption of equivalence between the various isotopologues that have been measured. The system consists mainly of water and is therefore likely to behave as such. Partial radial distribution functions (RDFs or g(r)), obtained from the EPSR program, for water; Ow–Ow, Ow–Hw and Hw–Hw (Fig. S1a–c in ESI†) reveal a strong resemblance to that of pure water,24 and to previous EPSR studies of 0.4 M C10TABr surfactant solution in water.24
TAA+–water interactions
The peaks for water, gN–Ow(r) and gN–Hw(r), Fig. 4e and f, are more pronounced for the TMA+ ion than for the TPA+ ion. The first N–Ow peak, maximum at 4.6 Å (Fig. 4e), for the TMA+ leads to a coordination number of 22; see Table 4 for cut-off distances. This reveals a hydration shell of approximately 25 water molecules, all in accordance with previous work from NMR-measurements,4 MD simulations13 and neutron scattering experiments.7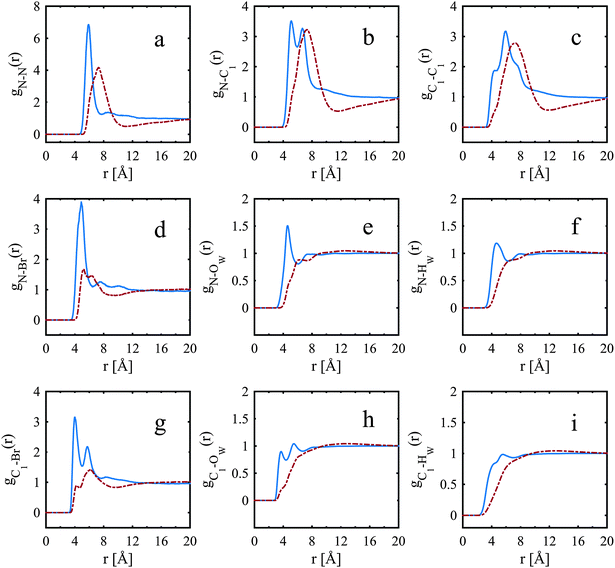 | ||
| Fig. 4 Site–site radial distribution functions comparing the nitrogen to the innermost carbon, bromide and water of TPA+ (dot-dashed red line) and TMA+ (solid blue line). | ||
| Pair-correlation | R min | R max | Number of atoms | Their standard deviation |
|---|---|---|---|---|
| N–N | 4.5 | 7.5 | 0.93 | ±1.2 |
| 4.5 | 10.5 | 1.9 | ±1.8 | |
| N–C1 | 3.6 | 6.0 | 1.4 | ±2.0 |
| 3.6 | 8.5 | 4.8 | ±5.3 | |
| N–Br | 3.4 | 6.5 | 0.48 | ±0.65 |
| N–OW | 3.0 | 6.0 | 22 | ±3.8 |
| N–HW | 3.0 | 6.4 | 7.3 | ±16 |
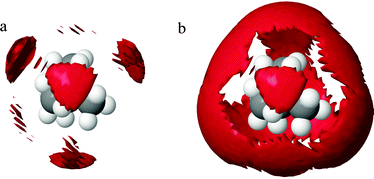
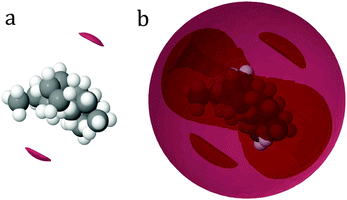
The corresponding N–Ow peak for the TPA+ ion is much less defined and is at a distance further from the central nitrogen (maximum at 4.8 Å for the first small shoulder and 6.2 Å for the second shoulder). The corresponding coordination number for the TPA+ ion is 31 (Table 5). This indicates an incomplete hydration shell for the TPA+ ion; a complete shell would have approximately 45 water molecules.4 Neutron diffraction and reverse Monte Carlo simulations in a system at a higher TPA+ concentration, by Polydorou et al.,10 showed fewer water molecules in the hydration shell than the expected 45 water molecules. Bhownik et al.13 have also acquired similar results for the TBA+, and state that this is due to shared hydration shells between the larger and more hydrophobic TAA+ ions. It is also noted that the N–OW peak is at shorter distances for the TMA+ ion than for the TPA+ ion, see Fig. 4e, indicating that the alkyl chains are to some extent blocking the access of water to the nitrogen of the TPA+. The spatial density functions for the top 15% probability of the oxygen of water around the nitrogen in TMA+ and TPA+, are shown in Fig. 5 and 6 respectively. Fig. 5a and 6a show the innermost distribution from 3.0–4.6 Å or 3.5–5.25 Å for TMA+ and TPA+ respectively, corresponding to the distances from the onset of the gN—OW(r), Fig. 4e, to its maximum for the TMA+ and the endpoint of the small shoulder for the TPA+. Fig. 5b and 6b show the corresponding distribution between the distances of 3.0–6.0 Å or 3.5–7.4 Å, where the end point is defined by the first local minimum of the said g(r) and represents the first hydration shell. The limit chosen for the spatial density functions for TPA+ is 7.4 Å due to the appearance of the water distribution (see below). Considering the innermost part, Fig. 5a and 6a, it is clear that the water distribution around the TMA+ is different compared to that of the TPA+. Noting that the TAA+ hydration shell forms over a range of distances, we can split the first hydration shell into nearest neighbour and more distant regions. The preferred locations of the nearest-neighbour water distribution around the TMA+ is close to tetrahedral, whereas around the TPA+ the nearest neighbour water is mainly located on two sides of the molecule. In the full shell around TMA+, Fig. 5b, the oxygens maintain preferred sites, complementary to the inner tetrahedral distribution, whereas for the TPA+ this strong spatial distribution templating is to some extent lost, Fig. 6b. The distribution around TPA+ appears as a skew disc of preferred locations for nearest-neighbour water molecules, inside a spatially unstructured sphere for the more distant waters in the primary hydration shell. From Fig. 4e and f it is clear that OW and HW are located equidistant to N. Turner et al.5,7–9 observed similar results for the TMA+ ion, indicating a dominating apolar hydration. In our case both ions display apolar behaviour. The peak heights in Fig. 4e and f also decrease with increasing length of the alkyl chain in accordance with previous work.11–13 In agreement with previous studies we observe the characteristic distance of 3.8 Å between the methyl-carbon and OW (see Fig. 4h and Fig. S3c, ESI†), indicative of an apolar group. The apolar behaviour of the alkyl chain is likely to be one of the reasons behind the incomplete hydration shell of the TPA+ ion. In order for the hydrophobic alkyl chains to be exposed to as few water molecules as possible the TPA+ ions share hydration shells. If the alkyl chains were to interact with each other the consequence would be an incomplete hydration shell. So, are the TPA+ ions in contact with each other?
| Pair-correlation | R min | R max | Number of atoms | Their standard deviation |
|---|---|---|---|---|
| N–N | 5.0 | 10.6 | 2.0 | ±1.3 |
| N–C3 | 3.9 | 8.3 | 4.1 | ±2.8 |
| 3.9 | 12.6 | 9.6 | ±5.7 | |
| N–C1 | 3.9 | 11.3 | 8.3 | ±5.4 |
| N–C2 | 3.9 | 12.0 | 8.9 | ±5.5 |
| N–Br | 3.9 | 5.8 | 0.15 | ±0.38 |
| 3.9 | 8.6 | 0.66 | ±0.76 | |
| N–OW | 3.5 | 7.4 | 31 | ±6.0 |
| 3.5 | 10.4 | 0.0 | ±0.0 | |
| N–HW | 3.2 | 7.9 | 0.52 | ±4.8 |
| 3.2 | 9.5 | 0.0 | ±0.0 |
TAA+–TAA+ interactions
Snapshots of the simulation boxes of the TMA+ and TPA+ systems are shown in Fig. 7 and 8, respectively. It appears that TPA+ ions associate, whilst the TMA+ ions stay more evenly distributed.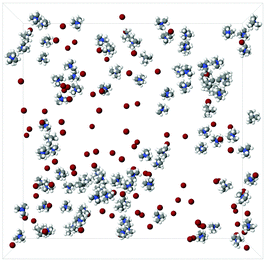 | ||
Fig. 7 A snapshot of a 100![[thin space (1/6-em)]](https://www.rsc.org/images/entities/char_2009.gif) : :![[thin space (1/6-em)]](https://www.rsc.org/images/entities/char_2009.gif) 100 100![[thin space (1/6-em)]](https://www.rsc.org/images/entities/char_2009.gif) : :![[thin space (1/6-em)]](https://www.rsc.org/images/entities/char_2009.gif) 12 12![[thin space (1/6-em)]](https://www.rsc.org/images/entities/char_2009.gif) 500 TMA 500 TMA![[thin space (1/6-em)]](https://www.rsc.org/images/entities/char_2009.gif) : :![[thin space (1/6-em)]](https://www.rsc.org/images/entities/char_2009.gif) Br Br![[thin space (1/6-em)]](https://www.rsc.org/images/entities/char_2009.gif) : :![[thin space (1/6-em)]](https://www.rsc.org/images/entities/char_2009.gif) H2O simulation box. The water molecules have been excluded for clarity. H2O simulation box. The water molecules have been excluded for clarity. | ||
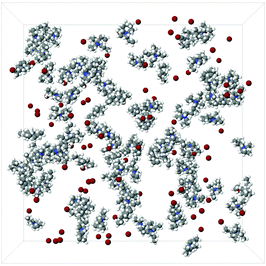 | ||
Fig. 8 A snapshot of a 100![[thin space (1/6-em)]](https://www.rsc.org/images/entities/char_2009.gif) : :![[thin space (1/6-em)]](https://www.rsc.org/images/entities/char_2009.gif) 100 100![[thin space (1/6-em)]](https://www.rsc.org/images/entities/char_2009.gif) : :![[thin space (1/6-em)]](https://www.rsc.org/images/entities/char_2009.gif) 12 12![[thin space (1/6-em)]](https://www.rsc.org/images/entities/char_2009.gif) 500 TPA 500 TPA![[thin space (1/6-em)]](https://www.rsc.org/images/entities/char_2009.gif) : :![[thin space (1/6-em)]](https://www.rsc.org/images/entities/char_2009.gif) Br Br![[thin space (1/6-em)]](https://www.rsc.org/images/entities/char_2009.gif) : :![[thin space (1/6-em)]](https://www.rsc.org/images/entities/char_2009.gif) H2O simulation box. The water molecules have been excluded for clarity. H2O simulation box. The water molecules have been excluded for clarity. | ||
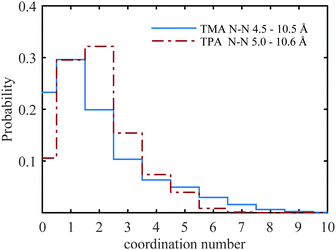
A selection of the partial radial distribution functions from the TMABr and TPABr systems can be seen in Fig. 4 (additional g(r) are found in the ESI†). The gN–N(r), in Fig. 4a, displays distinct peaks at a distance of 5.8 Å (TMA+) and 7.3 Å (TPA+). If the ions were distributed on a regular lattice the largest centre-to-centre distance of TMA+ would be 15.8 Å, and the value for TPA+ 16.1 Å. It is observed that the peaks in the gN–N(r)s, Fig. 4a, are at smaller values. A previously published model has shown that the ions stay dispersed in solution but start sharing hydration shells above a certain concentration when the alkyl chain is longer than two carbons.13 Some investigations show that TAA+s are in contact in larger clusters depending on the length of the alkyl chain and the concentrations.14,34 The peaks in the gN–N(r) (Fig. 4a) indicate that the molecules are close enough to be in contact. The values of the closest neighbouring TAA+ correspond well to the estimated radius of the TMA+ (3 Å) and TPA+ (4.5 Å) from previous studies,5,10 indicating that there are ions in close contact in both systems. The coordination number (Tables 4, 5 and Tables S1, S2, ESI†) estimated from the gN–N(r) uses a cut-off distance at 10.5 Å for the TMA+ and 10.6 Å for the TPA+. This corresponds to the first and second peak in the TMA+ system and the first peak in the TPA+ system. The coordination number distributions for these distances are shown in Fig. 9.
The TMA+ molecules form smaller, or no, aggregates, whilst the TPA+ molecules form slightly larger assemblies. The TMA+ most likely only has one neighbour, i.e. forming pairs rather than aggregates. For the TPA+ molecules the situation is different. There is a higher probability of finding clusters of 2–4 molecules. However, single molecules exist in both systems. The gN–C1(r) (Fig. 4b) should then give rise to a coordination number of about 4 for the TMA+ and 4–12 for the TPA+ ion. However, the coordination number for the first peak in the TMA+ system is only 1.4 (see Table 4) and increases to 4.8 for the second peak. This supports the view that only a small fraction of the TMA+ ions are in close contact, in pairs or occasionally larger assemblies. When the molecules are in contact they preferentially turn their carbons towards each other. For the TPA+ system the first N–C1 peak gives a coordination number of 8.3 (Table 5), which corresponds to the nitrogen being close to roughly 2–3 of the innermost carbons from each neighbouring TPA+ molecule. The coordination number for gN–C3(r) (Table 5) are slightly higher, 9.6, supporting the idea that the TPA+ ions are positioning their alkyl chains in the vicinity of another alkyl chain, in line with what was observed for the TMA+. The clusters are most likely highly dynamical, based on the range of different configurations and coordination numbers. The C–C radial distribution functions (Fig. 4c and Fig. S3, ESI†) also support the idea that there is a preference for the carbons in different molecules to associate. This is more pronounced in the TPA+ system than in the TMA+, likely a consequence of the longer alkyl chains and increase in hydrophobicity. This is supported by both a higher degree of association of the TPA+ ions and the preferential location of the alkyl chains. That TAA+ ions are in close contact has previously been observed, mostly at higher concentrations or with longer alkyl chains.10,14 A weak attraction was found for the smaller TMA+ ions when the molecules are around 8 Å apart.11 The average distance between the TPA+ molecules also depends on their respective configuration, i.e. their actual radius. EPSR allows for intramolecular disorder and the molecule can take any configuration, from fully stretched to a curled up spherical object. An arbitrary TPA+ molecule from the simulations can be seen in Fig. 10, which shows a configuration that is not fully stretched but rather slightly compressed into a spheroid, or oblate, still allowing it to intertwine one, or more of, the alkyl chains with other TPA+ ions.
 | ||
| Fig. 10 Snapshot of one randomly chosen TPA+ molecule, seen from front (middle) and rotated to the right and left, revealing the oblate nature. | ||
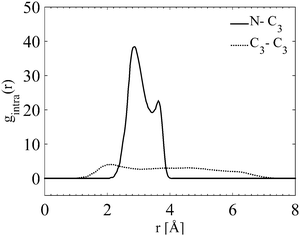
Fig. 11 shows, from the internal gN–C3(r) and gC3–C3(r), that the outermost carbon, C3, occupies a wide range of different positions. The smallest distance is as close to the nitrogen as the innermost carbon, C1, (Fig. S4 in ESI†), and the largest equivalent to a fully stretched configuration. The largest distance between the C3 is just above 7 Å. This is in good agreement with previous findings where its fully extended configuration is above 9 Å in diameter.10 This indicates that the outermost carbons, C3, are moving around freely. In addition the internal partial g(r)s (all of the N–C, C–C internal partial radial distributions for the TPA molecule are shown in Fig. S4 in the ESI†) show a preference towards a certain degree of folding.
Bromide–water interactions
The Br–OW, Br–Hw partial RDFs (Fig. S2 in ESI†) are similar to results from a previous EPSR study of bromide ions.32 The first Br–Ow peak is at the same position, however, it is slightly wider. The hydration number is based on integrations of the g(r) (Fig. S2 in ESI†). Distances for the Br–HW up to 3.2 Å and for Br–OW up to 3.8 Å corresponds to the first hydration layer. The hydration number has been reported to be 6–7 water molecules for fully dissociated simple alkali salts.32,35 In our study the corresponding value is just above 5.5 water molecules, indicating that the bromide ion is not fully hydrated, likely a consequence of incomplete dissociation from the TAA+ ions. The number of water molecules around the bromide ion quickly increases with distance and, in the middle of the first broad local minima of the gBr–Ow(r), at 4.6 Å, the coordination number is already 11. The high number indicates that the second layer around the ions is already partly present at this distance. This result is in contrast to the TMACl system, at 1![[thin space (1/6-em)]](https://www.rsc.org/images/entities/char_2009.gif) :
:![[thin space (1/6-em)]](https://www.rsc.org/images/entities/char_2009.gif) 50 and 1
50 and 1![[thin space (1/6-em)]](https://www.rsc.org/images/entities/char_2009.gif) :
:![[thin space (1/6-em)]](https://www.rsc.org/images/entities/char_2009.gif) 25 TMA
25 TMA![[thin space (1/6-em)]](https://www.rsc.org/images/entities/char_2009.gif) :
:![[thin space (1/6-em)]](https://www.rsc.org/images/entities/char_2009.gif) H2O, where the smaller chloride ion was found to be almost fully hydrated with approximately 5 water molecules.
H2O, where the smaller chloride ion was found to be almost fully hydrated with approximately 5 water molecules.
Bromide–Bromide and Bromide–TAA+ interactions
The gBr–Br(r) (Fig. S1d, ESI†) suggests that there is a slightly stronger correlation for the bromides in the TMA+ system compared to the TPA+ system, although, in general, the correlation is weak. The coordination numbers, from the gN–Br(r) for the TMA+ and TPA+ system, are around 0.5 for both systems (Tables 4 and 5). Hence, there is a similar dissociation of the counterion in both systems. This low degree of association has previously been observed for larger TAA+ ions but not for the smaller one, TMA+, which has been found to be more associated at higher concentrations.12 The low hydration number of the bromide ion is consistent with a partly associated system. It is clear that bromide binds more strongly than chloride to TMA+. Turner et al.7 found, at higher concentration, a larger hydration number for the anion in TMACl than we found for TMABr. This is in line with the specific ion effects of the Hofmeister series.In the TMA+ system the peak in the gN–Br(r) is better defined compared to the TPA+ system, but they are almost at the same position (Fig. 4d). The range of possible configurations of the TPA+ ion, and its associative behaviour, could explain why the bromide has less distinct sites for the TPA+, Fig. 4d and g. The oblate nature of the TPA+ molecule allows the bromide to come unexpectedly close to the nitrogen.
As previously mentioned the TAA+s have different functions in the formation of silicalite-1 depending on the length of the alkyl chain.18 Larger TAA+s are required to initiate nucleation, whilst growth is mediated by both small and large ions. Our results demonstrate that the water distribution around TMA+ and TPA+ differs significantly (see Fig. 5 and 6). Considering the innermost part of the hydration shell, TPA+ has less preferred sites whereas waters around TMA+ organise tetrahedrally. Further, TPA+ ions have a tendency to associate in small groups in order for the alkyl chains to decrease water interaction (see Fig. 9). Hence TPA+ reveals a more hydrophobic behaviour than TMA+. This behaviour results in TPA+ having a folded configuration in order to decrease contact with water. To summarise, the TPA+ is a larger species, it shows a more hydrophobic behaviour, with clustering as a consequence, and the water distribution differs from that of TMA+. This behaviour, collective or otherwise, can be an explanation to the mechanistic differences seen in silicalite-1 syntheses. The hydrophobic behaviour of the TAA+, more pronounced for the TPA+, leads to a driving force to associate with molecules less polar than water, such as silica oligomers. Considering this, TPA+ would have a stronger tendency to nucleate a silicalite-1 synthesis. In addition the clustering behaviour of TPA+ may facilitate this aggregation.
Conclusions
We have investigated the solution behaviour of 0.4 M TMABr and TPABr salts in water. Water has a more defined and different distribution around TMA+ than TPA+. Water arranges tetrahedrally around TMA+ and in an almost featureless manner around TPA+. Water does not reveal any strong preference for positioning either oxygen or hydrogen towards the TAA+. Hence, TMA+ and TPA+, in spite of being ions, have an apolar hydration. TPA+ is slightly more apolar than TMA+, manifested in the associative behaviour; it is often found in smaller clusters of 2–4 molecules. TMA+, on the other hand, rarely forms anything larger than a pair. Further, this apolar character of TPA+ drives the molecule to fold into a more compact configuration. However, both species are ions; correlating similarly with the bromide ion.Our study provides an explanation to why TPA+ is a more efficient nucleating agent in the synthesis of silicalite-1. We would expect larger TAA+ ions, like TBA+, to have an even more pronounced behaviour than TPA+, whereas TEA+ is expected to have an intermediate character. However, previous work by Pham et al. shows that the TEA+ acts more like the TMA+ than TPA+.18
In addition this methodology to investigate aqueous solutions provides valuable information on a molecular level that can lead to a better understanding of complex systems.
Acknowledgements
EJN and VA acknowledge financial support from the Swedish Research Council via project grants 621-2011-4336 and 2015-05042, and the Linneaus grant Organising Molecular Matter 239-2009-6794. KJE acknowledges funding from Lund University and the OMM grant for her position. We thank the ISIS Pulsed Neutron and Muon Source for allocation of experimental beamtime on NIMROD experiment number RB1010063.References
- H. E. Wirth, J. Phys. Chem., 1967, 71, 2922–2929 CrossRef CAS.
- N. Moreno, A. Malagon, R. Buchner and E. F. Vargas, J. Chem. Thermodyn., 2014, 68, 117–121 CrossRef CAS.
- E. W. Lang, S. Bradl, W. Fink, H. Radkowitsch and D. Girlich, J. Phys.: Condens. Matter, 1990, 2, SA195 CrossRef CAS.
- P.-O. Eriksson, G. Lindblom, E. E. Burnell and G. J. T. Tiddy, J. Chem. Soc., Faraday Trans. 1, 1988, 84, 3129–3139 RSC.
- A. K. Soper, J. Turner and J. L. Finney, Mol. Phys., 1992, 77, 431–437 CrossRef CAS.
- J. Turner and A. K. Soper, J. Chem. Phys., 1994, 101, 6116–6125 CrossRef CAS.
- J. Turner, A. K. Soper and J. L. Finney, Mol. Phys., 1990, 70, 679–700 CrossRef CAS.
- J. Turner, A. K. Soper and J. L. Finney, Mol. Phys., 1992, 77, 411–429 CrossRef CAS.
- J. Z. Turner, A. K. Soper and J. L. Finney, J. Chem. Phys., 1995, 102, 5438–5443 CrossRef CAS.
- N. G. Polydorou, J. D. Wicks and J. Z. Turner, J. Chem. Phys., 1997, 107, 197–204 CrossRef CAS.
- H. Krienke, V. Vlachy, G. Ahn-Ercan and I. Bako, J. Phys. Chem. B, 2009, 113, 4360–4371 CrossRef CAS PubMed.
- J. T. Slusher and P. T. Cummings, J. Phys. Chem. B, 1997, 101, 3818–3826 CrossRef CAS.
- D. Bhowmik, N. Malikova, G. Meriguet, O. Bernard, J. Teixeira and P. Turq, Phys. Chem. Chem. Phys., 2014, 16, 13447–13457 RSC.
- N. Huang, D. Schlesinger, D. Nordlund, C. Huang, T. Tyliszczak, T. M. Weiss, Y. Acremann, L. G. M. Pettersson and A. Nilsson, J. Chem. Phys., 2012, 136, 074507 CrossRef PubMed.
- E. M. Flanigen, J. M. Bennett, R. W. Grose, J. P. Cohen, R. L. Patton, R. M. Kirchner and J. V. Smith, Nature, 1978, 271, 512–516 CrossRef CAS.
- P.-P. E. A. de Moor, T. P. M. Beelen, B. U. Komanschek, L. W. Beck, P. Wagner, M. E. Davis and R. A. van Santen, Chem. – Eur. J., 1999, 5, 2083–2088 CrossRef CAS.
- A. Aerts, C. E. A. Kirschhock and J. A. Martens, Chem. Soc. Rev., 2010, 39, 4626–4642 RSC.
- T. C. T. Pham, H. S. Kim and K. B. Yoon, Science, 2011, 334, 1533–1538 CrossRef CAS PubMed.
- R. K. Harris and C. T. G. Knight, J. Mol. Struct., 1982, 78, 273–278 CrossRef CAS.
- S. D. Kinrade, C. T. G. Knight, D. L. Pole and R. T. Syvitski, Inorg. Chem., 1998, 37, 4272–4277 CrossRef CAS PubMed.
- S. D. Kinrade, C. T. G. Knight, D. L. Pole and R. T. Syvitski, Inorg. Chem., 1998, 37, 4278–4283 CrossRef CAS PubMed.
- S. Caratzoulas, D. G. Vlachos and M. Tsapatsis, J. Phys. Chem. B, 2005, 109, 10429–10434 CrossRef CAS PubMed.
- A. K. Soper, Phys. Rev. B: Condens. Matter Mater. Phys., 2005, 72, 12 CrossRef.
- R. Hargreaves, D. T. Bowron and K. Edler, J. Am. Chem. Soc., 2011, 133, 16524–16536 CrossRef CAS PubMed.
- J. E. Enderby, Chem. Soc. Rev., 1995, 24, 159–168 RSC.
- V. F. Sears, Neutron News, 1992, 3, 26–37 CrossRef.
- J. L. Finney and A. K. Soper, Chem. Soc. Rev., 1994, 23, 1–10 RSC.
- D. T. Bowron, A. K. Soper, K. Jones, S. Ansell, S. Birch, J. Norris, L. Perrott, D. Riedel, N. J. Rhodes, S. R. Wakefield, A. Botti, M.-A. Ricci, F. Grazzi and M. Zoppi, Rev. Sci. Instrum., 2010, 81, 033905 CrossRef CAS PubMed.
- A. K. Soper, GudrunN and GudrunX: programs for correcting raw neutron and X-ray diffraction data to differential scattering cross section, Oxfordshire, UK, 2011 Search PubMed.
- A. K. Soper, Chem. Phys., 1996, 202, 295–306 CrossRef CAS.
- A. K. Soper, Mol. Phys., 2001, 99, 1503–1516 CrossRef CAS.
- D. T. Bowron, 14th International Conference on X-Ray Absorption Fine Structure (Xafs14), Proceedings, 2009, 190, 10.
- H. J. C. Berendsen, J. R. Grigera and T. P. Straatsma, J. Phys. Chem., 1987, 91, 6269–6271 CrossRef CAS.
- S. T. van der Post, S. Scheidelaar and H. J. Bakker, J. Phys. Chem. B, 2013, 117, 15101–15110 CAS.
- P. D'Angelo, V. Migliorati and L. Guidoni, Inorg. Chem., 2010, 49, 4224–4231 CrossRef PubMed.
Footnote |
| † Electronic supplementary information (ESI) available. See DOI: 10.1039/c6cp01389a |
| This journal is © the Owner Societies 2016 |


