 Open Access Article
Creative Commons Attribution 3.0 Unported Licence
The salts of chloronium ions R–Cl+–R (R = CH3 or CH2Cl): formation, thermal stability, and interaction with chloromethanes†
Evgenii S.
Stoyanov
ab
aVorozhtsov Institute of Organic Chemistry, Siberian Branch of Russian Academy of Sciences (SB RAS), Novosibirsk 630090, Russia. E-mail: evgenii@nioch.nsc.ru
bDepartment of Natural Science, National Research University – Novosibirsk State University, Novosibirsk 630090, Russia
First published on 7th April 2016
Abstract
The interaction of CH3Cl/CD3Cl or CH2Cl2/CD2Cl2 with the carborane acid H(CHB11Cl11) (abbreviated as H{Cl11}) generates the salts of CH3–{Cl11} and CH2Cl–{Cl11} and their deuterio analogs, respectively, which are analogs of the salts of asymmetric chloronium cations. Next, salts of chloronium cations CH3–Cl+–CH3, ClCH2–Cl+–CH2Cl, and ClCH2–Cl+–CH3 and their deuterio analogs were obtained from the above compounds. The asymmetric ClCH2–Cl+–CH3 cation was found to be unstable, and at ambient temperature, slowly disproportionated into symmetric cations (CH3)2Cl+ and (CH2Cl)2Cl+. At a high temperature (150 °C), disproportionation was completed within 5 minutes, and the resulting cations further decomposed into CH3–{Cl11} and CH2Cl–{Cl11}. The molecular fragment ClCH2–(X) of the compounds (X = {Cl11}, –Cl+–CH2Cl, or –Cl+–CH3) is involved in exchange reactions with CH2Cl2 and CHCl3, converting into CH3–(X) with the formation of chloroform and CCl4, respectively.
Halonium ions (R2Hal+) are well-recognized reactive intermediates in electrophilic chemistry.1,2 Their stability increases in the order Hal = F, Cl, Br, I. Recently, the evidence of the formation of the symmetrical fluoronium ions in solutions was obtained,3,4 and the nature of carbon–halogen bonds in the halonium ions was studied.5 Mostly stable dimethylbromonium and -iodonium salts are presently commercialized and widely used in chemical ionization mass spectroscopy (gas phase chemistry) as effective methylating6–12 and protonating agents13,14 for a variety of compounds. Nevertheless, the chemistry of dialkylhalonium ions in condensed phases is virtually unknown. Recently, the salts of (CH3)2Cl+ and (C2H5)2Cl+ with the exceptionally stable and inert toward reactive cations undecachlorocarborane ions, CHB11Cl11−, were obtained and studied using X-ray and infrared (IR) spectroscopy.15 The solid salt (CH3)2Cl+(CHB11Cl11−) is stable even at elevated temperatures and decomposes at 140 °C releasing CH3(CHB11Cl11) and CH3Cl. This is an important method for the isolation of pure CH3(CHB11Cl11), which can be viewed as a neutral analogue of an asymmetric chloronium ion related to the dimethylchloronium ylide, CH3ClCH2.16,17
In the present work we obtained the salts of symmetric and asymmetric chloronium cations, CH3–Cl+–CH2Cl and CH2Cl–Cl+–CH2Cl, both protio and deuterio analogs, with the CHB11Cl11− counterion (hereafter abbreviated as {Cl11−}, Fig. S1, ESI†). We also explored their thermal stability and interaction with some simple chloromethanes. The carborane ion {Cl11−} was chosen as a counterion for chloronium salts because of its exceptionally low basicity and high thermal stability, which ensure the stability of chloronium salts at room temperature and above.15
Experimental
Carborane acid H{Cl11} was prepared as previously described.18 The acid was sublimed at 150–160 °C under a pressure of 10−5 Torr on cold Si windows of a specially designed IR cell-reactor as a very thin translucent layer.19 The spectrum of the sublimed acid showed no traces of the H3O+ cation.20 Dry gaseous chloromethanes (CH3Cl, CH2Cl2, and CHCl3) were injected anaerobically into the IR cell. The values of their partial pressure were calculated as the ratio of absorption intensity to that of the standard spectrum recorded in the same cell filled with vapors at atmospheric pressure.All procedures were performed in a Vacuum Atmospheres Corp. glovebox in the atmosphere of N2 (O2 and H2O < 0.5 ppm). The IR spectra were recorded on a PerkinElmer Spectrum-100 spectrometer inside a dry box in the transmission mode (400–4000 cm−1). The IR data were processed in the GRAMMS/A1 (7.00) software program from Thermo Fisher Scientific.
Results and discussion
To explore the chemical processes involving chloronium ions by means of IR spectroscopy, their detailed IR spectra must be obtained and interpreted.Chloronium salts and IR spectra
The CH3–Cl+–CH2Cl cation was obtained by introducing the CH2Cl2 vapors at a partial pressure (PCH2Cl2) of 0.4 atm into an evacuated IR cell containing a film of CH3–{Cl11} sublimed on their Si-windows. Reaction (1) of CH3–Cl+–CH2Cl formation proceeds very slowly, without a release of HCl.| CH3{Cl11} + CH2Cl2 → (CH3–Cl+–CH2Cl){Cl11−} | (1) |
If the partial pressure of the injected CH2Cl2 vapors was twofold higher (1 atm), then the reaction was accelerated significantly and completed within 6 minutes. The spectrum of the resultant CH3–Cl+–CH2Cl cation slightly differs from that of the previous sample (Fig. 1), indicating that the cation is sensitive to changes in the environment.
The CH3–Cl+–CD2Cl cation is formed when the vapors of CD2Cl2 are introduced into the IR cell with sublimed CH3–{Cl11}. The IR spectrum of the salt of this cation is shown in Fig. 2 (red; the gas phase was evacuated).
 | ||
| Fig. 2 IR spectra of the initial CH3–{Cl11} salt (blue) and the salt of the CH3–Cl+–CD2Cl cation (red). | ||
The CD3–Cl+–CH2Cl and CD3–Cl+–CD2Cl cations were formed when vapors of CH2Cl2 or CD2Cl2 respectively, were injected into the IR cell with a film of sublimed CD3–{Cl11} salt on the Si windows. Their IR spectra are presented in Fig. S2 and S3 (ESI†) and in Table 1.
Interpretation of the IR spectra
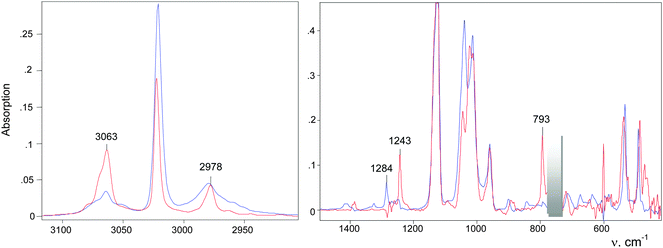
IR spectra of the salts of the cations CH3–Cl+–CH2Cl (red), CD3–Cl+–CH2Cl (blue), and CH3–Cl+–CD2Cl (green) that are normalized to the intensity of the anion are shown in Fig. 3. The figure shows that in the frequency range of CH stretch vibrations, the sum of the spectra of the fragments ClH2C–(Cl+–) (blue) and CH3–(Cl+–) (green) matches the spectrum of the CH3–Cl+–CH2Cl cation. The same result was observed in the frequency range of the CH bend vibrations (Fig. 3, right). Interpretations of the IR spectra for all cations follow from the above data (Tables 1 and 2), taking into account that spectra of CH3{Cl11} and (CH3–Cl+–CH3){Cl11−} were interpreted earlier.15 It was important to determine the existence of specific absorption bands for each compound under study; we will use these bands (shown in Tables 1 and 2) as markers for the identification of these compounds in the mixtures. Intensity of the marked bands allowed us to estimate relative amounts of the compounds.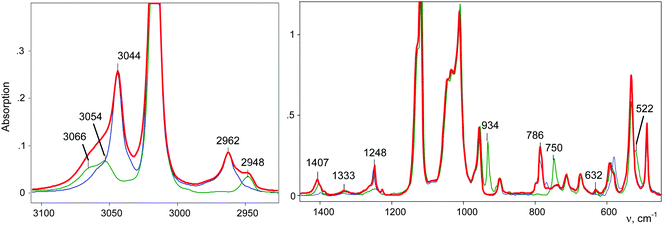 | ||
| Fig. 3 IR spectra of salts of cations: CH3–Cl+–CH2Cl (red), CD3–Cl+–CH2Cl (blue) and CH3–Cl+–CD2Cl (green). | ||
| Compound | ν asCH2 | ν sCH2 | δCH2 scissor | δCH2 waggle | ν asCCl2/νC–Cl | ν as(CClC) | |||||||
|---|---|---|---|---|---|---|---|---|---|---|---|---|---|
| a Not determined. | |||||||||||||
| CH2Cl2 (liquid)22 | 3045 | 2990 | 1424 | 1265vs | ![[7 with combining low line]](https://www.rsc.org/images/entities/char_0037_0332.gif) ![[3 with combining low line]](https://www.rsc.org/images/entities/char_0033_0332.gif) ![[9 with combining low line]](https://www.rsc.org/images/entities/char_0039_0332.gif) |
— | |||||||
| ClH2C–{Cl11} | 3079 | ![[3 with combining low line]](https://www.rsc.org/images/entities/char_0033_0332.gif) ![[0 with combining low line]](https://www.rsc.org/images/entities/char_0030_0332.gif) ![[6 with combining low line]](https://www.rsc.org/images/entities/char_0036_0332.gif) ![[3 with combining low line]](https://www.rsc.org/images/entities/char_0033_0332.gif) |
2978 | 1391 | ![[1 with combining low line]](https://www.rsc.org/images/entities/char_0031_0332.gif) ![[3 with combining low line]](https://www.rsc.org/images/entities/char_0033_0332.gif) ![[8 with combining low line]](https://www.rsc.org/images/entities/char_0038_0332.gif) ![[5 with combining low line]](https://www.rsc.org/images/entities/char_0035_0332.gif) |
![[1 with combining low line]](https://www.rsc.org/images/entities/char_0031_0332.gif) ![[2 with combining low line]](https://www.rsc.org/images/entities/char_0032_0332.gif) ![[4 with combining low line]](https://www.rsc.org/images/entities/char_0034_0332.gif) ![[3 with combining low line]](https://www.rsc.org/images/entities/char_0033_0332.gif) vs vs |
![[7 with combining low line]](https://www.rsc.org/images/entities/char_0037_0332.gif) ![[9 with combining low line]](https://www.rsc.org/images/entities/char_0039_0332.gif) ![[3 with combining low line]](https://www.rsc.org/images/entities/char_0033_0332.gif) |
— | |||||
| ClH2C–Cl+–CH2Cl IIa | 3073 | ![[3 with combining low line]](https://www.rsc.org/images/entities/char_0033_0332.gif) ![[0 with combining low line]](https://www.rsc.org/images/entities/char_0030_0332.gif) ![[6 with combining low line]](https://www.rsc.org/images/entities/char_0036_0332.gif) ![[4 with combining low line]](https://www.rsc.org/images/entities/char_0034_0332.gif) |
3048 | 2980 | 1416 | 1324 | ![[1 with combining low line]](https://www.rsc.org/images/entities/char_0031_0332.gif) ![[2 with combining low line]](https://www.rsc.org/images/entities/char_0032_0332.gif) ![[8 with combining low line]](https://www.rsc.org/images/entities/char_0038_0332.gif) ![[4 with combining low line]](https://www.rsc.org/images/entities/char_0034_0332.gif) ![[v with combining low line]](https://www.rsc.org/images/entities/char_0076_0332.gif) ![[s with combining low line]](https://www.rsc.org/images/entities/char_0073_0332.gif) |
1248 | ![[7 with combining low line]](https://www.rsc.org/images/entities/char_0037_0332.gif) ![[7 with combining low line]](https://www.rsc.org/images/entities/char_0037_0332.gif) ![[0 with combining low line]](https://www.rsc.org/images/entities/char_0030_0332.gif) |
635 | |||
| 1409 | |||||||||||||
| ClH2C–Cl+–CH2Cl IIb | ![[3 with combining low line]](https://www.rsc.org/images/entities/char_0033_0332.gif) ![[0 with combining low line]](https://www.rsc.org/images/entities/char_0030_0332.gif) ![[4 with combining low line]](https://www.rsc.org/images/entities/char_0034_0332.gif) ![[4 with combining low line]](https://www.rsc.org/images/entities/char_0034_0332.gif) |
2964br | 1406 | 1338 | ![[1 with combining low line]](https://www.rsc.org/images/entities/char_0031_0332.gif) ![[2 with combining low line]](https://www.rsc.org/images/entities/char_0032_0332.gif) ![[8 with combining low line]](https://www.rsc.org/images/entities/char_0038_0332.gif) ![[3 with combining low line]](https://www.rsc.org/images/entities/char_0033_0332.gif) ![[v with combining low line]](https://www.rsc.org/images/entities/char_0076_0332.gif) ![[s with combining low line]](https://www.rsc.org/images/entities/char_0073_0332.gif) |
1248 | 798 | ![[7 with combining low line]](https://www.rsc.org/images/entities/char_0037_0332.gif) ![[8 with combining low line]](https://www.rsc.org/images/entities/char_0038_0332.gif) ![[3 with combining low line]](https://www.rsc.org/images/entities/char_0033_0332.gif) |
672 | 593 | |||
| 1226 | |||||||||||||
| ClH2C–Cl+–CH3 | 3044 | 2962 | ![[1 with combining low line]](https://www.rsc.org/images/entities/char_0031_0332.gif) ![[4 with combining low line]](https://www.rsc.org/images/entities/char_0034_0332.gif) ![[0 with combining low line]](https://www.rsc.org/images/entities/char_0030_0332.gif) ![[7 with combining low line]](https://www.rsc.org/images/entities/char_0037_0332.gif) |
1386 | 1261 | ![[1 with combining low line]](https://www.rsc.org/images/entities/char_0031_0332.gif) ![[2 with combining low line]](https://www.rsc.org/images/entities/char_0032_0332.gif) ![[4 with combining low line]](https://www.rsc.org/images/entities/char_0034_0332.gif) ![[8 with combining low line]](https://www.rsc.org/images/entities/char_0038_0332.gif) ![[s with combining low line]](https://www.rsc.org/images/entities/char_0073_0332.gif) |
1226 | ![[7 with combining low line]](https://www.rsc.org/images/entities/char_0037_0332.gif) ![[8 with combining low line]](https://www.rsc.org/images/entities/char_0038_0332.gif) ![[6 with combining low line]](https://www.rsc.org/images/entities/char_0036_0332.gif) |
|||||
| ClH2C–Cl+–CD3 | 3044 | 2962 | ![[1 with combining low line]](https://www.rsc.org/images/entities/char_0031_0332.gif) ![[3 with combining low line]](https://www.rsc.org/images/entities/char_0033_0332.gif) ![[9 with combining low line]](https://www.rsc.org/images/entities/char_0039_0332.gif) ![[8 with combining low line]](https://www.rsc.org/images/entities/char_0038_0332.gif) |
1387 | 1263 | ![[1 with combining low line]](https://www.rsc.org/images/entities/char_0031_0332.gif) ![[2 with combining low line]](https://www.rsc.org/images/entities/char_0032_0332.gif) ![[5 with combining low line]](https://www.rsc.org/images/entities/char_0035_0332.gif) ![[1 with combining low line]](https://www.rsc.org/images/entities/char_0031_0332.gif) ![[s with combining low line]](https://www.rsc.org/images/entities/char_0073_0332.gif) |
1226 | ![[7 with combining low line]](https://www.rsc.org/images/entities/char_0037_0332.gif) ![[8 with combining low line]](https://www.rsc.org/images/entities/char_0038_0332.gif) ![[7 with combining low line]](https://www.rsc.org/images/entities/char_0037_0332.gif) |
|||||
Interaction of mono- and dichloromethane with H{Cl11} and chloronium cations
CH3Cl interacts with the H{Cl11} acid in two stages. At first, it is protonated with the release of HCl and the formation of CH3{Cl11} (eqn (2)):| CH3Cl + H{Cl11} → [CH3Cl–H+{Cl11}] → CH3{Cl11} + HCl | (2) |
| CH3{Cl11} + CH3Cl → (CH3)2Cl+{Cl11−} | (3) |
Dichloromethane vapors (at a partial pressure of 0.65 atm) interacted with sublimed acid in the same way as chloromethane did. At the first stage, IR spectra registered the emergence of absorbance of the gaseous HCl and the surface CH2Cl–{Cl11} compound, which are formed in accordance with eqn (4):
| CH2Cl2 + H{Cl11} → CH2Cl–{Cl11} + HCl | (4) |
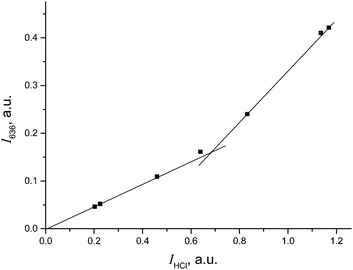
The IR spectrum of CH2Cl–{Cl11} showed the characteristic band of the C–Cl stretch at 793 cm−1, and the absence of the bands of C–Cl+–C group vibrations in the frequency range 650–500 cm−1 (Fig. 5 and Table 2). Intensity of HCl absorption (IHCl) was used to quantify the total amount of the formed CH2Cl–{Cl11}, whereas intensity of the band of the terminal C–Cl stretch (ICCl) reflects the current amount of this compound. Dependence of ICCl on IHCl was linear for the first 5 hours of the reaction (Fig. 6); this result means that only CH2Cl–{Cl11} was formed. Then, the dependence started to drop (point 22 in Fig. 6), indicating the second stage of the reaction: involvement of CH2Cl–{Cl11} in the formation of the ClH2C–Cl+–CH2Cl cation (eqn (5)).
| CH2Cl–{Cl11} + CH2Cl2 → ClH2C–Cl+–CH2Cl. | (5) |
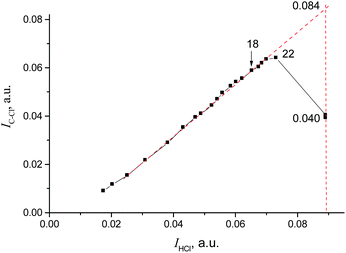 | ||
| Fig. 6 Dependence of ICCl on IHCl, pointing to ClH2C–{Cl11} formation and its further consumption on the formation of the ClH2C–Cl+–CH2Cl cation. | ||
Extrapolation of ICCl from IHCl to the moment of the reaction stoppage (at the 1380th minute, when CH2Cl2 was pumped out) yields ICCl = 0.084 (arbitrary units; Fig. 6). This value corresponds to the amount of CH2Cl–{Cl11} that was formed in accordance with the amount of HCl production (eqn (4)). Nevertheless, because CH2Cl–{Cl11} is further consumed (reaction (5)), ICCl decreases to 0.040 arbitrary units (Fig. 6), meaning that 48% (0.040/0.084) of this compound survived, and 52% was converted to the chloronium ion.
An IR spectrum of (CH2Cl)2Cl+ was obtained by subtracting the spectrum of CH2Cl–{Cl11} from the spectrum of the mixture of (CH2Cl)2Cl+ with the CH2Cl–{Cl11} up to complete compensation of the bands νCCl = 792 cm−1 and δCH2 = 1243 cm−1, which are specific to CH2Cl–{Cl11} (Fig. 5, blue; Table 2). The frequencies of the (CH2Cl)2Cl+ cation are very close to those of CH2Cl–{Cl11} except for one intense band at 1284 cm−1, which can be used as a marker of this cation (Table 2). Furthermore, we will denote CH2Cl–{Cl11} as compound I and the (CH2Cl)2Cl+ salt as compound II.
After stoppage of the reaction at minute 1380, an IR spectrum of the sample retained a strong absorption pattern of the unreacted acid, which constituted 70% of the original spectrum of the acid.
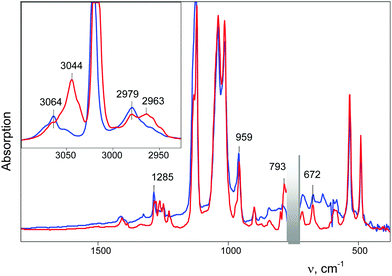
To continue reactions (4) and (5) at a higher speed, the CH2Cl2 vapors were reintroduced into our IR cell at higher partial pressure (1 atm). Under these conditions, the formation of compound I was completed after 8 minutes with full utilization of the acid and termination of the HCl release (point 30 in Fig. 7). An IR spectrum of this sample is shown in Fig. 8 (black).
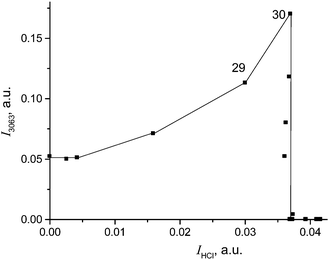 | ||
| Fig. 7 Dependence of CH2Cl–{Cl11} formation (determined by means of intensity of its band νasCH2 at 3063 cm−1) on the amount of released HCl (determined by means of intensity of the νHCl band). | ||
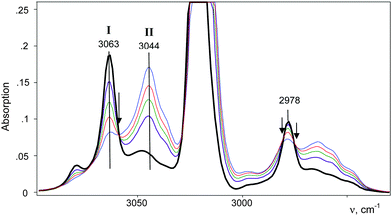 | ||
| Fig. 8 A change in intensity of the IR spectra of compounds CH2Cl–{Cl11} and (CH2Cl–Cl+–CH2Cl){Cl11−} as reaction (5) proceeds. The arrows indicate isosbestic points. The spectrum of gaseous CH2Cl2 was subtracted. | ||
Further interaction of compound I with CH2Cl2 and the formation of II is manifested in IR spectra as a decrease in the intensity of compound I and the upregulation of compound II with the appearance of isosbestic points (Fig. 8 and Fig. S5, ESI†). The spectrum of the resultant cation II differed from that of the same cation formed during a slow reaction of CH2Cl–{Cl11} with CH2Cl2 (Fig. 9 and Table 2). Thus, two isomers of CH2Cl–Cl+–CH2Cl are formed: compound IIa from the slowly proceeding reaction (5) and compound IIb from the rapid reaction (5). They differ in frequencies of stretches CH and CCl. Nonetheless, their bend CH vibrations are very similar and have one specific band δCH2 (1284 cm−1), which does not overlap with the bands of other types of cations. Therefore, the intensity of this band (I1284) can be used for the estimation of the amount of the IIa + IIb mixture.
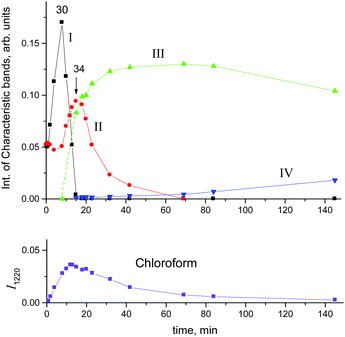
Fig. 10 shows the time dependence of the intensity of absorption bands of compounds I (I3063) and II (I1284) that reflects the formation of the corresponding cations. One can see that the formation of compound II passes through a maximum at point 34, when compound I disappears, and then decreases.
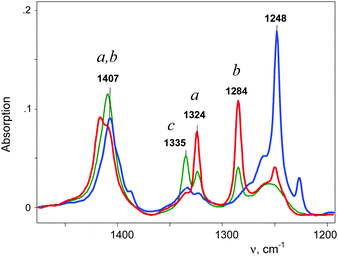
Simultaneously, the bands indicative of the cation CH3–Cl+–CH2Cl at 1261 and 1248 cm−1 made an appearance (Table 2) and increased in intensity. We will denote this cation as compound III. Its narrow band δCH2 = 1248 cm−1 (I1248) does not overlap with the bands of other cations and can be used for the assessment of the relative amount of compound III (Fig. 10, green). Along with the spectrum of compound III, the absorption bands of the cation (CH3)2Cl+ also develop (hereafter denoted as compound IV). Intensity of its single band at 1324 cm−1 (I1324) was used to assess the formation of compound IV. Fig. 10 summarizes the sequence of the formation of compounds I, II, III, and IV and the relative amounts of each compound, but does not describe the quantitative relations among them.
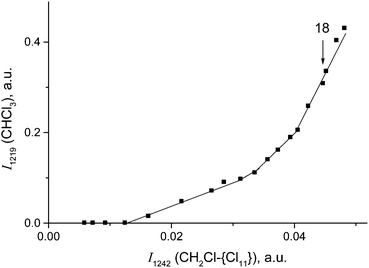
Cations III and IV can be formed only if the reaction of I or II with CH2Cl2 is accompanied by the formation of gaseous products. The spectra of the gas phase revealed the band of H–C–Cl bend vibration of chloroform at 1219 cm−1. The time dependence of its intensity shows that the formation of chloroform is associated with the formation of compounds I and II (Fig. 10). In the situation when only I is formed (PCH2Cl2 = 0.65 atm), the dependence of the chloroform formation (I1219) on the formation of I (I1242) increases both with an increase in the amount of compound I and with an increase in the contact time of I with dichloromethane (Fig. 11). Subtraction of the spectrum of compound I from the spectrum of the products (at point 18 in Fig. 11) leads to the manifestation of the spectrum of compound CH3{Cl11} (Fig. S6, ESI†). Hence, CH2Cl2 reacts with CH2Cl{Cl11} according to eqn (6):
 | (6) |
With the rapid formation of CH2Cl{Cl11} in reaction (4) at PCH2Cl2 = 1 atm, chloroform is formed symbatically (Fig. 12), confirming reaction (6). In contrast, starting from point 32, chloroform formation stopped, whereas from point 34, it begins to decrease, when the amount of II passes through a maximum, and compound I is exhausted (Fig. 10). The subsequent expenditure of chloroform occurs simultaneously with the consumption of compound II and the increasing amount of III. This finding points to reaction (7):
| CH2Cl–Cl+–CH2Cl + CHCl3 → CH2Cl–Cl+–CH3 + CCl4, | (7) |
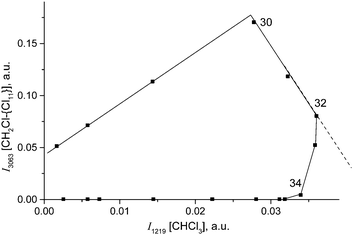 | ||
| Fig. 12 The link between formation of CH2Cl–{Cl11} (indicated by intensity of its band at 3063 cm−1) and CHCl3 (indicated by intensity of its band at 1219 cm−1). | ||
In the same way, compound IV can form:
| CH2Cl–Cl+–CH3 + CHCl3 → CH3–Cl+–CH3 + CCl4, | (8) |
The detection of CCl4 was carried out as follows. After the completion of the reaction, the gaseous phase and all surface-adsorbed molecules were removed by pumping. The difference in IR spectra before and after the evacuation represented the spectrum of removed molecules. It consists of a strong absorption pattern of the original dichloromethane, the characteristic band at 1219 cm−1 of chloroform, and a weak band at 790 cm−1, which may belong to the C–Cl stretch of CCl4. The latter frequency is lower than that of gaseous CCl4 (795 cm−1), but equals that of CCl4 solvated with dichloromethane in its solutions (789 cm−1). Therefore, the traces of the formed CCl4 are adsorbed by superficial chloronium salts.
To sum up, we can conclude that CH2Cl2 and CHCl3 interact with the molecular fragment CH2Cl–, whose reactivity is highest in CH2Cl{Cl11} and is consistently reduced in cations II and III. In general, these interactions can be expressed as:
Decreasing the reactivity of the molecular fragment CH2Cl– in compounds I, II, and III is correlated with its decreasing polarizability, which in turn is determined by the change in ionicity of the bonds in chloronium bridge C–Cl+–C.
Ionicity/covalency of the bonds in the C–Cl+–C bridge of chloronium ions
The stretch frequencies of the methyl group, especially νasCH3, are sensitive to CH3 polarization: the higher these frequencies, the stronger the CH3 group is polarized and the higher is ionicity of the CH3–Cl(X) bond. In compounds CH3–{Cl11} and CH3–Cl+–CH3, the CH stretches differ insignificantly (Table 1), pointing to almost the same ionicity of CH3+ bonding to {Cl−} and Cl–CH3, respectively. Nonetheless, one would expect weaker ionicity (stronger covalency) of the bonds in CH3–Cl+–CH3 than in CH3–{Cl11}. The crystal structure of the (CH3–Cl+–CH3){Cl11−} salt shows (Fig. S7 in ESI†) that the chloronium Cl-atom forms six ionic bonds with Cl-atoms of the four {Cl11−} anions of its environment. This situation favors an increase in the ionicity of C–Cl+–C bonds and contributes to the convergence of polarizability of CH3 groups in CH3–{Cl11} and (CH3–Cl+–CH3){Cl11−} salts. If we now examine the salt (CH3–Cl+–CD2Cl){Cl11−}, one can see that CH stretches significantly decrease (Table 1). It is evident that this salt is amorphous and has a disordered structure that may reduce the number of linkages between the chloronium Cl atom and neighboring {Cl11−} anions, thus increasing the covalency of the C–Cl+–C group. In any case, the ionicity of the CH3–Cl(–X) bond decreases in the following order:Just as the methyl group in salts CH3–{Cl11} and (CH3–Cl+–CH3){Cl11−}, the CH2Cl group in salts ClH2C–{Cl11} and IIa shows identical CH stretch frequencies (Table 2). Probably, in the case of the slow formation (hours) of the (ClH2C–Cl+–CH2Cl){Cl11−} salt (IIa), its structure is the densest, close to that of the single crystal with a maximal number of interactions between the chloronium Cl atom and atoms of the nearest {Cl11−} anions. In the case of quick formation (minutes), the (ClH2C–Cl+–CH2Cl){Cl11−} salt is amorphous with a loose structure and fewer contacts between the chloronium Cl atom and Cl atoms of the neighboring anions. This situation increases the covalency of the bonds in the C–Cl+–C bridge and decreases the polarizability of CH2Cl groups and their CH stretches. We named this salt “isomer IIb”. Polarizability and CH frequencies of the CH2Cl group of IIb coincide with those of the salt (ClH2C–Cl+–CH3){Cl11−}. Thus, ionicity of the ClH2C–Cl(–X) bond decreases in the following order:
The proposed model seems to be a reasonable explanation for the existence of IIa and IIb isomers when they are formed slowly (within hours) or quickly (in minutes), respectively.
Thermal stability of chloronium cations
 | ||
| Fig. 13 IR spectra of the freshly prepared salt (CD3–Cl+–CH2Cl){Cl11} (blue) and after one or three days of storage (red). The bands of the cations (CH2Cl)2Cl+, CD2Cl–Cl+–CD2Cl and (CH3)2Cl+ are marked respectively as (1), (2) and (3). | ||
In the range of CD stretch vibrations, the band νasCD3 = 2297 cm−1 of the cation CD3–Cl+–CH2Cl was replaced with the intense νasCD3 band at 2307 cm−1 of the cation CD3–Cl+–CD3. Thus, the CD3–Cl+–CH2Cl cation in the solid phase at ambient temperature is unstable, and during the day, disproportionates into symmetrical cations, predominantly according to eqn (9) and to a slight extent, according to eqn (10)
| 2CD3–Cl+–CH2Cl → CH2Cl–Cl+–CH2Cl + CD3–Cl+–CD3 | (9) |
| 2CD3–Cl+–CH2Cl → CD2Cl–Cl+–CD2Cl + CH3–Cl+–CH3 | (10) |
Therefore, at 100 °C, the asymmetric cation CH3–Cl+–CH2Cl quickly disproportionates into the more stable symmetric cations:
| 2CH3–Cl+–CH2Cl → ClH2C–Cl+–CH2Cl + CH3–Cl+–CH3 | (11) |
Further heating of the sample for 5 minutes at 150 °C led to an equal (threefold) reduction in intensity of the bands at 1324 and 1284 cm−1 of the cations (CH3)2Cl+ and (CH2Cl)2Cl+, respectively, and appearance and an increase in intensity of the bands of CH3–{Cl11} (1335 cm−1: Fig. 14, green) and ClH2C–{Cl11} (νCClterm = 793 cm−1). Additionally, bands with a rotational structure at 1270 and 761 cm−1 of gaseous CH2Cl2 were observed. Consequently, an increase in temperature facilitates the decomposition of chloronium ions according to eqn (12) and (13); this change should lead to increasing intensity of the IR spectrum of released dichloromethane.
| (CH3–Cl+–CH2Cl){Cl11−} → CH3–{Cl11} + CH2Cl2 | (12) |
| (ClH2C–Cl+–CH2Cl){Cl11−} → ClH2C–{Cl11} + CH2Cl2 | (13) |
| ClH2C–{Cl11} + CH2Cl2 → CH3–{Cl11} + CHCl3. |
To determine the reason for the formation of trace amounts of HCl, additional studies are needed.
Conclusions
The salts of symmetric methylchloronium cations, (CH3)2Cl+{Cl11−} and (CH2Cl)2Cl+{Cl11−}, and their neutral analogs CH3–{Cl11} and CH2Cl–{Cl11}, are stable at ambient and increased temperatures. Nevertheless, the asymmetric cation ClCH2–Cl+–CH3 even at ambient temperature disproportionates into symmetrical (CH3)2Cl+ and (CH2Cl)2Cl+. The molecular fragment CH2Cl– of the chloronium ions enters exchange reactions with CH2Cl2 and CHCl3 with increasing reactivity in the order ClCH2–Cl+–CH3, ClCH2–Cl+–CH2Cl, and CH2Cl–{Cl11}, yielding more stable and less reactive (CH3)2Cl+{Cl11−} and CH3{Cl11} compounds.If we take into account the reactivity of H{Cl11} acid or its chloronium salts with CH2Cl2, and the simultaneous disproportionation of the CH3–Cl+–CH2Cl cation (eqn (11); initiated by the elevated temperature), then the end products of interactions at ambient, or slightly evaluated temperature, are the chemically inert CH3–Cl+–CH3 and CCl4:
Acknowledgements
This work was supported by grant # 16-13-10151 from the Russian Science Foundation and by the Ministry of Education and Science of the Russian Federation within the Project of the joint Laboratories of the Siberian Branch of the Russian Academy of Sciences and National Research Universities. The author thanks Irina S. Stoyanova for providing the carborane acids and technical support.References
- G. A. Olah, Halonium Ions, Wiley, New York, 1975 Search PubMed.
- G. A. Olah, K. K. Laali, Q. Wang and G. K. S. Prakash, Onium Ions, Wiley, New York, 1998, ch. 6 Search PubMed.
- M. D. Struble, M. T. Scerba, M. A. Siegler and T. Lectka, Science, 2013, 340, 57 CrossRef CAS PubMed.
- M. D. Struble, M. G. Holl, M. T. Scerba, M. A. Siegler and T. Lectka, J. Am. Chem. Soc., 2015, 137, 11476 CrossRef CAS PubMed.
- R. Kalescky, W. Zou, E. Kraka and D. Cremer, J. Phys. Chem. A, 2014, 118, 1948 CrossRef CAS PubMed.
- G. A. Olah and J. R. DeMember, J. Am. Chem. Soc., 1970, 92, 718 CrossRef CAS.
- G. A. Olah and J. R. DeMember, J. Am. Chem. Soc., 1970, 92, 2562 CrossRef CAS.
- G. A. Olah and Y. K. Mo, J. Am. Chem. Soc., 1974, 96, 3560 CrossRef CAS.
- H. W. Zappey, T. Drewello, S. Ingemann and N. M. M. Nibbering, Int. J. Mass Spectrom. Ion Processes, 1992, 115, 193 CrossRef CAS.
- T. Partanen and P. Vainiotalo, Rapid Commun. Mass Spectrom., 1997, 11, 881 CrossRef CAS.
- M. A. Freitas, R. A. J. O'Hair and T. D. Williams, J. Org. Chem., 1997, 62, 6112 CrossRef CAS.
- D. K. Sen Sharma and P. Kebarle, J. Am. Chem. Soc., 1982, 104, 19 CrossRef.
- J. L. Beachamp, D. Holtz, S. D. Woodgate and S. L. Patt, J. Am. Chem. Soc., 1972, 74, 2798 CrossRef.
- G. Bouchoux, F. Caunan, D. Leblanc, M. T. Nguyen and J. Y. Salpin, ChemPhysChem, 2001, 10, 604 CrossRef.
- E. S. Stoyanov, I. V. Stoyanova, F. S. Tham and C. A. Reed, J. Am. Chem. Soc., 2010, 132, 4062 CrossRef CAS PubMed.
- L. A. Noronha, T. J. L. Judson, J. F. Dias, L. S. Santos, M. N. Eberlin and C. J. A. Mota, J. Org. Chem., 2006, 71, 2625 CrossRef CAS PubMed.
- A. Jubert, N. Okulik, M. C. Michelini and C. J. A. Mota, J. Phys. Chem. A, 2008, 112, 11468 CrossRef CAS PubMed.
- M. Juhasz, S. Hoffmann, E. S. Stoyanov, K. Kim and C. A. Reed, Angew. Chem., Int. Ed., 2004, 43, 5352 CrossRef CAS PubMed.
- E. S. Stoyanov, I. V. Stoyanova and C. A. Reed, J. Am. Chem. Soc., 2011, 133, 8452 CrossRef CAS PubMed.
- E. S. Stoyanov, K.-C. Kim and C. A. Reed, J. Am. Chem. Soc., 2006, 128, 1948 CrossRef CAS PubMed.
- L. M. Sverdlov, M. A. Kovner and E. P. Krainov, Vibrational Spectra of Polyatomic Molecules, Nauka, Moscow, 1970, p. 340 Search PubMed.
- T. Shimanouchi and I. Suzuki, J. Mol. Spectrosc., 1962, 8, 222 CrossRef CAS.
Footnote |
| † Electronic supplementary information (ESI) available. See DOI: 10.1039/c6cp00946h |
| This journal is © the Owner Societies 2016 |


