 Open Access Article
Sequential separation of ultra-trace U, Th, Pb, and lanthanides using a simple automatic system
Yutaka
Miyamoto
*,
Kenichiro
Yasuda
and
Masaaki
Magara
Japan Atomic Energy Agency (JAEA), Tokai, Ibaraki 319-1195, Japan. E-mail: miyamoto.yutaka@jaea.go.jp; Fax: +81-29-284-3658; Tel: +81-29-282-5518
First published on 6th May 2015
Abstract
Uranium, thorium, lead, and the lanthanides were automatically and sequentially separated with a single anion-exchange column. This separation was achieved using eluents consisting of a simple and highly pure acid mixture of HCl, HNO3, acetic acid, and HF. The elements of interest were separated from the major constituents, which included alkaline metal elements, alkaline earth metal elements, and iron. This simple and automatic system is driven with pressurized nitrogen gas and controlled using a computer program. An optimized separation was accomplished under the following conditions: a 50 mm long and 2 mm diameter column, 11 μm diameter anion-exchange resin, and a 35 μL min−1 flow rate. Using this system, 50 ng of varied elements in a 100 μL feed solution were perfectly separated within 5 h with >400 decontamination factors and >95% yield. In order to evaluate the performance of this system, a reference powdered rock sample was separated using this system. Abundances of objective elements, including 0.23 ng of lutetium, were accurately determined without corrections of chemical recovery yield or subtraction of the process blank. This separation technique saves time and effort for chemical processing, and is useful for ultra-trace quantitative and isotopic analyses of elements in small environmental samples.
1. Introduction
Uranium, thorium, lead, and the lanthanides are key elements in geochemistry and cosmochemistry. Their abundance and isotope ratios in rocks, meteorites, and airborne dust are used to estimate their origin,1 dating of mineral formation,2 mineralization history,3 and age determination of nuclear materials.4,5 Their separation is required for a precise analysis, but their chemical separation is time consuming. Uranium, Th, Pb and lanthanides can be separated using ion-exchange columns as well as through solvent extraction.6,7 Virtually all these techniques require several complicated steps and various types of reagents. To effectively avoid contamination from a foreign environment, this separation procedure must be simplified. Several excellent ligands and extractants have been developed for chemical separation,8–11 but some of these are frequently difficult to purify; moreover, they can also decompose. Extremely pure HCl and HNO3 are commercially available, and these are conventionally used as the eluents in ion-exchange separation systems. We successfully developed sequential separation techniques for U, Th, Pb, and lanthanides using a single anion-exchange column and mixed media consisting of HCl, HNO3, acetic acid, and HF.12,13 This technique was applied to determine the elemental abundance in a reference rock sample, and abundances in ≥500 μg of sample were accurately determined.13The elements of interest were separated using a gravimetric flow in a conventional sized (1 mL) anion-exchange column. This conventional separation method can be applied to various samples, but it takes a considerable volume (10–30 mL) of eluents and time (2 d) to accomplish the separation. Usuda reported on the rapid separation of trans-plutonium elements with a pressurized gas and anion-exchange column.14 To overcome the shortcomings of our previous technique, an automatic sequential separation utilizing a small anion-exchange column and pressurized gas has been developed. In column chromatography, the representative and effective parameters for achieving the highest elution peak resolution in the shortest possible time are the column size, resin particle size, eluent flow rate, and column temperature. In this work, the separation was optimized for the resin particle size, column length, and eluent flow rate to completely separate each element of interest in a short time. Abundance of elements of interest in a reference rock sample was determined to evaluate the performance of this separation technique.
2. Experimental
2.1. Apparatus and reagents
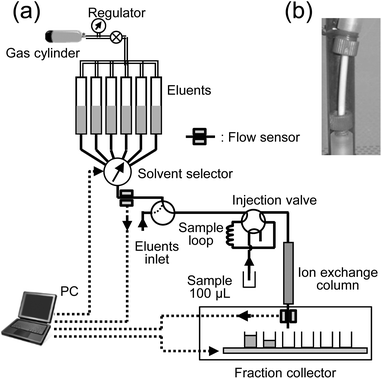
A simple system consisting of an ion exchange column, inert valves, and Teflon tubes was assembled to perform the sequential separation. Fig. 1 shows a diagram of this system, the Clean and Automatic Separation System for Ultra-trace Analysis (CASSUAL). The sample solution and eluents pass through the Teflon parts of the system, but they do not make contact with metals or movable parts, such as plungers in the high-performance liquid chromatography (HPLC), to reduce the process blank level. A 100 μL sample solution was loaded into a sample loop. The volumes of eluents required for each element separation were collected and stored in large Teflon (PFA) tubes (4 mm inner diameter (i.d.), 80 cm long). The chemical composition and volume of eluents are listed in Table 1. The stored solutions were extruded by pressurized nitrogen gas charged at 1 MPa in a small metal gas cylinder (capacity: 300 mL) attached to a regulator. The flow rate of the eluents was adjusted by varying the gas pressure with the regulator. The gas pressure was kept constant during a series of sequential separations, with the eluents automatically and sequentially switched by a solvent selector equipped with an inert valve (SV-5008AM, GL Sciences Inc., Japan). A flow sensor (FX-301F, Panasonic Corp., SUNX Ltd, Japan) attached to the outlet tube of the selector detects when the eluent source is empty and then the solvent valve is switched to the next position.| Fraction no. | Eluted element | Volume (mL) [CV]a | Composition of the eluent |
|---|---|---|---|
| a Column volume (CV) unit for 2 mm ϕ × 50 mm long column (0.158 mL). b Volume for feeding the sample solution. | |||
| 1 | Alkali metals, alkali earth metals (for elimination) | 0.10 [0.64]b | 16 M CH3COOH–0.2 M HNO3 |
| 3.14 [20] | |||
| 2 | Lanthanides | 3.93 [25] | 15 M CH3COOH–0.80 M HCl–0.9 M HNO3–0.03 M NH2OH·HCl |
| 3 | Th | 3.14 [20] | 12 M CH3COOH–1 M HCl–0.1 M HF |
| 4 | Pb | 2.36 [15] | 9 M HCl |
| 5 | Fe (for elimination) | 0.47 [3] | 8 M HNO3 |
| 6 | U | 1.88 [12] | 0.2 M HCl–1 M HF |
The eluent flow detection and valve switching were controlled by an analog-to-digital converter (ADC) interface (USB-6221, National Instruments Co., USA) and the LabVIEW program (National Instruments Co., USA). This entire system, including the software program working on the LabVIEW, was assembled by us. The effluents in each fraction were collected by hand in this experiment. A fraction collector (CHF122SC, ADVANTEC MFS, Inc., Japan) was also available for their automatic collection. A PFA tube (1 mm i.d., 2 mm outer diameter) was used as the column by cutting it to an appropriate length. Teflon wool was packed into the end of the tube, ensuring it was 22 mm long, and it was used to prevent leaking of the resin. An anion-exchange resin was packed into a column with a glass reservoir (15 mm i.d., 30 cm long). The resin suspended in deionized water was stored in the reservoir. An empty column was attached to one end of this reservoir with a PEEK fitting, and the other end of the reservoir was connected to the gas cylinder. The compressed nitrogen gas pressure was adjusted to 0.5 MPa with a regulator to pack the slurry into the column. The appearance of the column is shown in Fig. 1. Columns were prepared in lengths of 42, 50, 80, 100, and 120 mm. The column was connected to the separation system with the resin, and then rinsed with Milli-Q water and concentrated HCl. Finally, each column was conditioned with five times their column volume of an acetic acid and HNO3 mixture, which is an identical composition to the feeding solution (i.e., eluent no. 1 listed in Table 1). An anion-exchange resin with two different particle sizes, MCI-GEL (Mitsubishi Chemical Corp., Japan), CA08Y (23.5 ± 4 μm), CA08S (11.0 ± 2 μm), was used. These are strongly basic anion-exchange resins (8% cross linkage, Cl− form), and the base material consists of a styrene–divinyl benzene (DVB) copolymer. It has the same composition as Dowex 1 × 8 (The Dow Chemical Company, USA). The MCI-GEL packing materials are used for high performance liquid chromatography (HPLC). High resolution separations are obtained, because the beads are perfect spheres and their size distribution is tight. Three inductively coupled plasma mass spectrometry (ICP-MS) calibration solutions (XSTC-13, XSTC-1, and XSTC-7, SPEX CertiPrep, Inc., USA) were mixed, and a stock solution of 0.3 M HNO3 containing 103 ppb of U, Th, Pb, lanthanides, etc. (57 elements) was prepared. The detailed element quantities in the calibration solutions have been described in our previous work.12,13 Water was deionized and purified (resistivity: 18.2 MΩ cm) with a Milli-Q water system (Millipore Corp., USA). All labware, including the vials and stock bottles used in this work, was made of Teflon (PFA). Highly pure acids: HCl, HNO3, HF (TAMA-Pure grade, Tama Chemicals Co. Ltd, Japan), acetic acid (precision analysis (UGR) and Ultrapure grade; >99.0% purity, Kanto Chemical Co. Ltd, Japan) and NH2OH·HCl (guaranteed reagent (GR) grade; 99.0% purity, Merck Co., Germany) were used without further purification.
2.2. Ion exchange separation
Five hundred microliters of the stock solution containing 50 ng of each element were pipetted into a 10 mL vial and fully evaporated. The dried sample was dissolved in 100 μL of the acetic acid and HNO3 mixture, which is the same composition as eluent no. 1, and loaded onto the column via the sample loop shown in Fig. 1. Each 0.5 mL of the effluent was collected in a separate vial. The effluents were weighed and evaporated to dryness. The resulting residues were dissolved in 1 mL of concentrated HNO3, and the solutions were evaporated again. Finally, the residues were dissolved in 2 mL of a 0.3 M HNO3 solution to analyze the elemental concentration by ICP-MS (Agilent 7500a, Agilent Technologies Inc., USA). Reference curves (counts per second (cps) vs. ppb) were drawn using five reference solutions to determine the sample concentrations. The recovery yield of the elements was calculated from the measured elemental concentration in the fractions. All treatments were performed in clean rooms (ISO Class 5 and 6) of the clean laboratory for environmental analysis and research “CLEAR” at the Japan Atomic Energy Agency (JAEA).15 The average flow rate (μL min−1) in each fraction was calculated from the weight and density of the effluent and the elapsed time for the elution.2.3. Determination of a reference rock sample
Elemental abundances of a geochemical reference sample were determined to evaluate the performance of this separation technique. Two hundred milligrams of a powdered basalt sample, JB-1, which was prepared in Advanced Industrial Science and Technology (AIST),16 was digested with the mixture of HCl, HNO3, HF, and HClO4. Finally, the acid residue was dissolved in 100 mL of 2 M HNO3 solution. The concentration of JB-1 in the solution was 1.92 mg g−1, which was calculated from the weights of the sample and the solution. A portion (370 μL, equivalent to 749 μg of JB-1) of this sample solution was pipetted into a beaker, and 2.3 ng of 233U was spiked to the sample for the correction of recovery yield of U. This spiked solution was evaporated to dryness. Finally, the resulting residue was dissolved in 100 μL of eluent no. 1, and the feed solution was loaded on a column, and then the elements of interest were separated. The separation fractions were evaporated to dryness, and were dissolved in 2 mL of 0.3 M HNO3. The concentration of U, Th, Pb, and the lanthanides in the elution fractions were measured with ICP-MS. Two ICP-MS calibration solutions (XSTC-331 and XSTC-1, SPEX CertiPrep, Inc., USA) were used for the reference standards to determine the concentration of elements of interest. These solutions were mixed and diluted to five solutions of different concentrations to draw reference curves (cps vs. ppb).3. Results and discussion
3.1. Optimization of the resin particle size
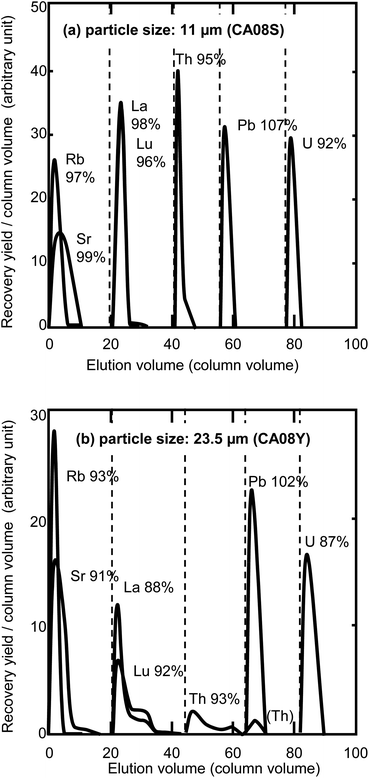
It is expected that smaller resins will improve the separation performance, since the smaller size increases the reactive surface area in a column. Fig. 2 shows the elution profiles of elements separated on columns packed with different sizes of anion-exchange resin (23.5 μm and 11 μm). The gas pressure was set at 0.4 MPa. The eluent flow rates for Th separation were 19 μL min−1 for the 11 μm resin column and 140 μL min−1 for the 23.5 μm resin column. The elements of interest were completely separated on the column packed with the 11 μm resin. In the case of the 23.5 μm resin column, the Th and lanthanide peak shapes were broadened, with the peak tails extending to the next fraction even when using a 120 mm long column. Separations using a column with the 23.5 μm resin at a lower pressure (i.e., a decreased flow rate) of 0.2 MPa (65 μL min−1 for the Th elution) and 0.3 MPa (84 μL min−1) were examined to obtain their retention time, but a complete separation was not accomplished under these conditions. A complete sequential separation was accomplished using the 11 μm resin column; however, this required a long time (19 h) for the 100 mm column. Objective elements were selectively separated by combination of anion exchange resin and acetic acid–mineral acid mixed media,17–25 but chemical forms of the elements and absorption mechanism are not precisely discussed. Guseva et al. suggested the possibility of formation of uranium hydroxoacetate complexes [UO2Ac2(OH)]− and [UO2Ac2(OH)2]2− (Ac = CH3COO−) for the anion exchange behaviour of actinides in acetic acid.18 In our work, the objective elements may form anionic species of nitrate, chloride, and/or acetate in the eluents. In addition to the formation of anionic species, partial replacement of aqueous solution with acetic acid enhances the absorption of many elements as reported in many studies.19–22 Kim and Born suggested that the hydration field around the interested ion becomes weakened in the presence of acetic acid, and the water dipoles in coordination may be replaced by acetate as well as chloride.17 The alkaline metals and alkaline earth metals in a sample were eliminated with eluent no. 1 listed in Table 1, because these elements do not form any anionic species. The lanthanides may be changed from anionic species to cationic ions by changing the composition of eluents from acetic acid–HNO3 to the acetic acid–HCl–HNO3 mixed media of eluent no. 2. The anionic Th nitrate complex in eluent no. 1 and 2 was changed to cationic Th ions (Th4+) by a lack of NO3− ions in the mixed media of eluent no. 3. Lead, Fe, and U were eluted with concentrated HCl, concentrated HNO3, and diluted HCl, respectively, in the same manner as conventional anion-exchange separation techniques. Investigations on the chemical form of absorbed elements in the mixture of concentrated acetic acid and inorganic acids may be helpful to construct sophisticated sequential separation techniques.3.2. Optimization of the column length and flow rate
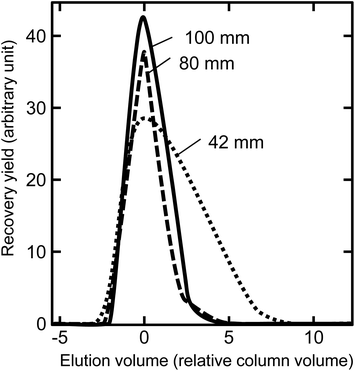
The flow rate increased proportionally on increasing gas pressure and decreased inversely on increasing column length in this sequential separation system. Therefore, these two parameters should be considered for flow rate optimization. The resolution of the elution peak improves on increasing column length, but it is costly in terms of increased analysis time. In order to examine the effect of column length, sequential separations were performed with three columns: 42 mm, 80 mm, and 100 mm long with 11 μm resin under 0.4 MPa gas pressure. As expected, the shorter column lengths resulted in shorter separation times: 3 h, 12.3 h, and 19 h for the 42 mm, 80 mm, and 100 mm long columns, respectively. Fig. 3 shows the Th peak profiles separated with the three different column lengths.In the case of the 42 mm column, a 46 μL min−1 flow rate was too fast to keep ion-exchange reaction of Th anion species between eluent and resin in equilibrium, and the peak profile was worse than for the longer columns. The 80 mm and 100 mm columns both produced a complete separation of the analytes. The column length and flow rate were optimized by the width of the Th peak. Van Deemter et al. have reported a mechanism of band broadening in non-ideal chromatography to explain the relationship between the flow rate and the band width.26 They suggested the following equation:
| H = A + B/v + Cv | (1) |
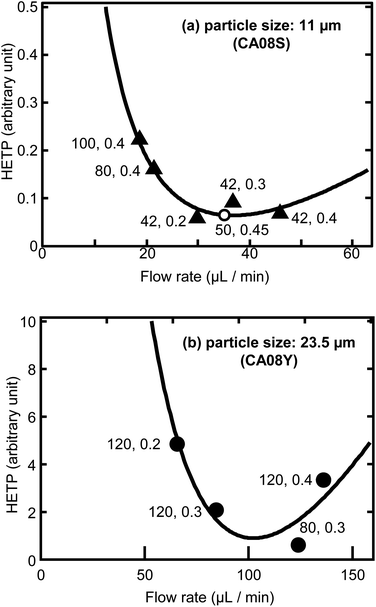 | ||
| Fig. 4 Optimization of the flow rate for Th separation. Separation with (a) particle size: 11 μm (CA08S), (b) 23.5 μm (CA08Y). The numbers indicate the column length (mm) and gas pressure (MPa) used in the sequential separation. The bold lines indicate the fitting results of the model equation.26 The open circle indicates the experimental result of the optimized conditions. | ||
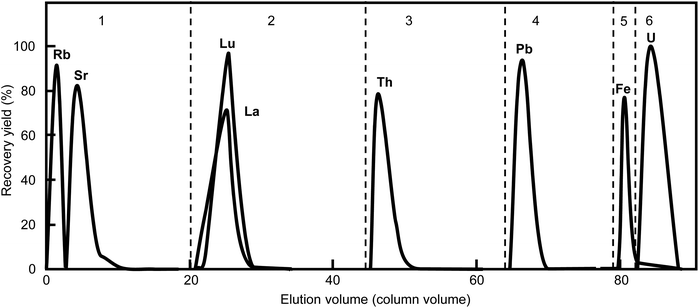 | ||
| Fig. 5 Elution profiles of representative elements separated under the optimized conditions. The numbers indicate the fraction no. listed in Table 1. The broken lines indicate the change in elution composition. This separation used a particle size of 11 μm (CA08S), column size of 0.2 mm i.d. × 50 mm long, (column volume: 157 μL), gas pressure of 0.45 MPa (35 μL min−1 flow rate for Th elution), and total process time of 5 h. | ||
| Fraction no. | Recovery yielda (%) | Eluted elementb | Decontamination factorc |
|---|---|---|---|
| a The average and standard deviation in 4 runs, and the Fe recovery was normalized relative to the complete recovery of all fractions. b The elements whose recovery was >50% of the fraction are listed. The elements expected to be eluted in the fraction are indicated in bold type. c The decontamination factors were calculated from the chemical recovery ratios. | |||
| 1 | 89 ± 11 (for Rb) 94 ± 4 (for Sr) | Mg, Rb, Sr, Cs, Ba, Be, Sc, Cr, Mn, Te | Rb/La 280 |
| 2 | 96 ± 4 (for lanthanides) | Lanthanides, Y, Co | La/Rb > 9 × 10³ |
| La/Th > 7 × 10⁴ | |||
| La/U > 2 × 10⁵ | |||
| 3 | 95 ± 10 (for Th) | Th | Th/La 420 |
| Th/U > 4 × 10⁵ | |||
| 4 | 109 ± 14 (for Pb) | Pb, Cu, In, Ag | Pb/Th 5 × 10³ |
| Pb/U 1 × 10⁴ | |||
| 5 | 84 ± 9 (for Fe) | Fe, Zn, Ga, Cd | |
| 6 | 103 ± 11 (for U) | U, Sn, Bi | U/Fe 40–170 |
Fig. 6 reveals that a chemical fractionation beyond the uncertainty was not found for each lanthanide member. This lanthanide fraction can be directly served as an analytical sample to determine the abundance of lanthanide elements without corrections of the recovery yield of each lanthanide member or interference from major constituents of environmental samples, including the alkaline metals, the alkaline earth metals, and Fe. Each lanthanide member can be obtained from this separation fraction by further separation using effective eluents such as 2-hydroxy-2-methylpropanoic acid (2-HIBA) solution on demand. Decontamination factors >400 were obtained for the elements of interest. The small contamination of Fe in the U fraction can be suppressed by modifying the eluent composition to effectively eliminate Fe. The procedure of this modification will be reported in a future paper.
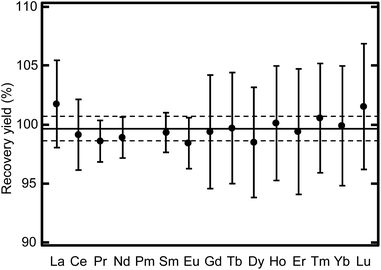 | ||
| Fig. 6 Chemical recovery yield variation for each lanthanide member. The solid and broken lines indicate the average and standard deviation of the yield for all lanthanide members, respectively. | ||
3.3. Application to analysis of elemental abundances in an environmental sample
The elements of interest in a sample solution of 370 μL, which was equivalent to 749 μg of the reference powdered basalt sample (JB-1),16 were successfully separated and fully recovered with CASSUAL under the optimized conditions: 0.45 MPa gas pressure (35 μL min−1 flow rate for Th separation), 11 μm diameter anion-exchange resin (CA08S), 2 mm diameter × 50 mm long column. Fig. 7 shows the analytical results of elemental abundance of the JB-1 sample solution. The reference values were obtained from the sample mass used in this analysis and the compiled concentrations.16 The recovery yield of U determined using the 233U spike was 101 ± 2 (%). The abundance of objective elements ranged from 0.23 ng of Lu to 51 ng of Ce. These ultra-trace elements were automatically and sequentially separated without contamination at the sub-ng level. The analytical results were in good agreement with the recommended values within the uncertainty. It is notable that the sequential separation of ultra-trace multiple elements without separation loss or contamination of the process blank was achieved with this technique. More accurate analyses can be expected by adding chemical yield tracers in sample digestion processes or by using the isotope dilution technique.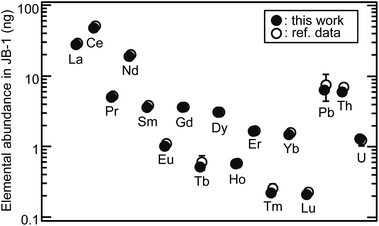 | ||
| Fig. 7 Application of CASSUAL to ultra-trace analysis of elemental abundance. The sample solution of the basalt reference sample (JB-1) of 749 μg was separated, and then the elements were determined by ICP-MS. The closed and open circles indicate the analytical results in this work and the recommended values (except for the reported value of Pb),16 respectively. | ||
The examination of this application indicates that the samples for ultra-trace analysis can be prepared without time-consuming or complicated chemical separation. This simple sequential separation technique has outstanding potential for analysing the elemental abundance and isotope ratios of ultra-trace elements at the sub-ng level in environmental samples. Additionally these features enabled us to perform a chemical separation of multiple elements at the ultra-trace level, regardless of operator skill, as compared with conventional techniques.
4. Conclusions
The separation performance herein reveals that this separation technique is useful for the ultra-trace analysis of small samples with elemental and isotopic composition. The sequential and automatic anion-exchange separation of 50 ng of U, Th, Pb, and lanthanides was accomplished with the highly pure acid mixture and a simple system driven by pressurized gas (CASSUAL) within 5 h. By optimization of separation conditions, particle size of anion-exchange resin, column length, and flow rate of eluents, the elements of interest were perfectly separated with recovery yields of >95% and decontamination factors of 100–5000. In this system, major constituents including alkaline metals, alkaline earth metals, and iron were eliminated from the elements of interest. High separation performance was proved by analysing the abundance of objective elements ranging from 0.23 ng of Lu to 51 ng of Ce in a reference rock sample. This advantage is considerably helpful in analysing accurate abundances and isotope ratios of elements at the sub-ng level in environmental samples without the interference of these major constituents or complicated separation recipes. Numerous samples could be processed in a short time without requiring special skills by modifying this system to separate samples in parallel.Acknowledgements
The authors are grateful to Shigekazu Usuda for his valuable idea on the pressurized separation system. This work was supported by financial aid from the Ministry of Education, Culture, Sports, Science and Technology (MEXT) of Japan (Scientific Research (C), grant no. 25340078).Notes and references
- A. Bollhöfer and K. J. R. Rosman, Geochim. Cosmochim. Acta, 2001, 65, 1727–1740 CrossRef.
- I. G. Alvarez, M. A. Kusiak and R. Kerrich, Chem. Geol., 2006, 230, 140–160 CrossRef PubMed.
- E. Pelt, F. Chabaux, C. Innocent, A. K. Navarre-Sitchler, P. B. Sak and S. L. Brantley, Earth Planet. Sci. Lett., 2008, 276, 98–105 CrossRef CAS PubMed.
- A. W. Knight, E. S. Eitrheim, A. W. Nelson, S. Nelson and M. K. Schultz, J. Environ. Radioact., 2014, 134, 66–74 CrossRef CAS PubMed.
- L. A. Mayers, S. E. Glover, S. P. LaMont, A. M. Stalcup and H. B. Spitz, J. Radioanal. Nucl. Chem., 2014, 299, 1833–1837 CrossRef.
- G. Shimoda, J. Mass Spectrom. Soc. Jpn., 2004, 52, 213–218 CrossRef CAS.
- M. Mola, A. Neito, A. Peñalver, F. Borrull and C. Aguilar, J. Environ. Radioact., 2014, 127, 82–87 CrossRef CAS PubMed.
- A. N. Turanov, V. K. Karandashev and V. E. Baulin, Solvent Extr. Ion Exch., 2012, 30, 244–261 CrossRef CAS PubMed.
- A. K. Dinkar, S. K. Singh, S. C. Tripathi, P. M. Gandhi, R. Verma and A. V. R. Reddy, J. Radioanal. Nucl. Chem., 2013, 298, 707–715 CrossRef CAS.
- E. P. Horwiz, M. L. Dietz, S. Rhoads, C. Felinto, N. H. Gale and J. Houghton, Anal. Chim. Acta, 1994, 292, 263–273 CrossRef.
- E. P. Horwiz, M. L. Dietz, R. Chiarizia and H. Diamond, Anal. Chim. Acta, 1992, 266, 25–37 CrossRef.
- Y. Miyamoto, K. Yasuda, M. Magara, T. Kimura and S. Usuda, J. Nucl. Radiochem. Sci., 2009, 10, 7–12 CAS.
- Y. Miyamoto, K. Yasuda, M. Magara, T. Kimura and S. Usuda, Proc. Radiochim. Acta, 2011, 1, 209–212 Search PubMed.
- S. Usuda, JAERI 1315, JAEA, 1989. http://www.jaea.go.jp/english/publication/index.html.
- S. Usuda, K. Yasuda, Y. S. Kokubu, F. Esaka, C.-G. Lee, M. Magara, S. Sakurai, K. Watanabe, F. Hirayama, H. Fukuyama, K. T. Esaka, K. Iguchi, Y. Miyamoto and J.-Y. Chai, Int. J. Environ. Anal. Chem., 2006, 86, 663–675 CrossRef CAS PubMed.
- N. Imai, S. Terashima, S. Ito and A. Ando, Geostand. Newslett., 1995, 19, 135–213 CrossRef CAS PubMed.
- J. I. Kim and H.-J. Born, Radiochim. Acta, 1970, 14, 35–39 CAS.
- L. I. Guseva, G. S. Tikhomirova and P. A. Korovaikov, Radiochemisty, 1999, 41, 229–232 Search PubMed.
- J. P. Faris and R. F. Buchanan, Anal. Chem., 1964, 36, 1157–1158 CrossRef CAS.
- P. Van Acker, Anal. Chim. Acta, 1980, 113, 149–158 CrossRef CAS.
- J. I. Kim and H.-J. Born, Radiochim. Acta, 1970, 14, 65–72 CAS.
- G. S. Tikhomirova, L. I. Guseva and P. A. Korovaikov, Radiochemisty, 1999, 41, 233–235 Search PubMed.
- P. Van den Winkel, F. De Corte and J. Hoste, J. Radioanal. Chem., 1972, 10, 139–143 CrossRef CAS.
- P. Van den Winkel, F. De Corte and J. Hoste, Anal. Chim. Acta, 1971, 56, 241–259 CrossRef CAS.
- P. Van den Winkel, F. De Corte, A. Speecke and J. Hoste, Anal. Chim. Acta, 1968, 42, 340 CrossRef CAS.
- J. J. Van Deemter, F. J. Zuiderweg and A. Klinkenberg, Chem. Eng. Sci., 1956, 5, 271–289 CrossRef CAS.
- E. Glückauf, Trans. Faraday Soc., 1953, 51, 34–44 RSC.
| This journal is © The Royal Society of Chemistry 2015 |

