Sustainable chromic acid oxidation: solar-driven recycling of hexavalent chromium ions for quinone production by WO3 nanosponge photoanodes†
Tomohiko
Nakajima
 *a,
Megumi
Kanaori
a,
Aya
Hagino
a,
Hiroyuki
Tateno
 b,
Tetsuo
Tsuchiya
a and
Kazuhiro
Sayama
b
aAdvanced Coating Technology Research Center, National Institute of Advanced Industrial Science and Technology, Tsukuba Central 5, 1-1-1 Higashi, Tsukuba, Ibaraki 305-8565, Japan. E-mail: t-nakajima@aist.go.jp; Tel: +81-29-861-6368
bResearch Center for Photovoltaics, National Institute of Advanced Industrial Science and Technology, Tsukuba Central 5, 1-1-1 Higashi, Tsukuba, Ibaraki 305-8565, Japan
First published on 7th December 2017
Abstract
Photoelectrochemical chromium ion oxidation from the trivalent to the hexavalent state has been demonstrated by using WO3 nanosponge photoanodes in sulfuric acid electrolytes under simulated sunlight. Faradaic efficiencies of almost 100% were achieved in electrolytes containing high Cr3+ (≥10 mM) and low SO42− (≤10 mM) concentrations at very low bias potential voltages below 1.1 VRHE. At the photoanode, the production of Cr6+ ions competed with the formation of S2O82− ions from HSO4−/SO42− ions. At the cathode, hydrogen evolution occurred with 100% faradaic efficiency. Additionally, Cr3+ recovery was also observed at the cathode upon switching the electrolytes of the anode and cathode cells after the Cr6+ production, demonstrating the complete cyclic photoelectrochemical reaction between Cr3+ and Cr6+ ions. Finally, we showed the applicability of chromic acid oxidation to quinone production by using the photoelectrochemically produced Cr6+ ions in the sulfuric acid solutions. p-Benzenediol was successfully converted into p-benzoquinone with high efficiency. Thus, we have demonstrated the production of high-value-added organic reagents via photoelectrochemically driven chromic acid oxidation with the recycling of Cr6+ from Cr3+ using solar energy.
Introduction
Hexavalent chromium ions are an important industrial reagent with a wide range of applications, such as oxidation to produce various organic materials and in Cr metal plating, dyes/pigments, and catalysis.1,2 However, the high toxicity of Cr6+ ions due to their strong oxidizing power represents a major limitation.2–5 In contrast, the Cr3+ ion is an essential nutrient for the human body.6 Although environmental exposure to Cr6+ ions through dyes and pigments has significantly diminished over the last few decades as a result of strict environmental laws and regulations,7 Cr6+ ions are still widely used around the world (Fig. S1†). Among the applications of Cr6+ ions, the production of high-value-added industrial reagents using chromic acid oxidation processes that rely on the strong oxidizing power of hexavalent chromium warrants attention.8–11Chromic acid oxidation has been applied in several derivative processes that use not only aqueous sulfuric acid solution but also organic solvents and complexes to form Cr6+ ions.9 These processes are typically used for the conversion of secondary alcohols into ketones and primary alcohols into carboxylic acids. In particular, quinones and their derivatives are valuable products that are essential for the manufacturing of various pharmacologically active reagents.12,13 Although chromic acid oxidation is an industrial process with unquestionable practical benefits, the fact remains that the safety issues absolutely necessitate the development of alternative ways to use Cr6+ ions. As Cr6+ compounds are scarcely found in nature due to their strong oxidizing power, they are generally manufactured industrially via a firing process involving chrome ore and soda ash at production facilities separate from the factories that use them. The main safety issue of Cr6+ is occupational exposure to the Cr6+ ions during each of the processes involved in production, transportation, handling, and disposal (ESI†).14
To allow the safe and efficient use of chromic acid oxidation involving Cr6+ ions in the production of various high-value-added reagents, we devised a system for the photoelectrochemical (PEC) recycling of Cr6+ ions using solar energy in a closed reaction vessel. If the trivalent chromium ions produced by the chromic acid oxidation process can be reoxidized to hexavalent chromium ions by sunlight using photoanodes, the toxic Cr6+ ions could be used as the mediator for subsequent reactions on site and on demand without producing hazardous chromium waste. This design permits the utilization of Cr6+ ions in production systems while increasing the occupational safety. The use of solar energy means that the final products of the chromic acid oxidation can be obtained with lower energy consumption and additionally allows solar hydrogen generation15–19 at the cathode when using aqueous electrolyte solutions. Thus, this reaction system has multiple advantages to think about building a sustainable society.
In this work, we used WO3 photoanodes for effective oxidation reactions under sunlight and firstly revealed that the Cr3+ ions were efficiently oxidized by the PEC reaction. We were able to achieve chromium ion oxidation from the trivalent to the hexavalent form on WO3 nanosponge photoanodes under simulated sunlight with a faradaic efficiency of almost 100% under the optimum conditions. We also demonstrated the applicability of the chromic acid oxidation process to quinone production. By using the photoelectrochemically produced Cr6+ ions, we confirmed that p-benzenediol was successfully converted into p-benzoquinone, which is used industrially as an oxidizing agent for various organic materials, as a polymerization inhibitor for raw polyester materials, and in dyes and photographic chemicals.20,21
Experimental procedures
The WO3 nanosponge photoanodes with high PEC performance were prepared by a nanoparticle/solution hybrid dispersion–deposition process (Fig. S2†).22,23 A WO3 nanoparticle/solution hybrid dispersion was prepared by wet ball milling of WO3 nanocrystal powder (EM Japan) in isopropanol with a tilted rotation planetary ball mill (Planet M, Nagao System) using zirconia balls at 650 rpm with a toluene solution of tungsten phenoxide (Gelest). Polyethylene glycol (PEG; molecular weight, 300; Wako Pure Chemical Industries) was added to the WO3 dispersion in a 1![[thin space (1/6-em)]](https://www.rsc.org/images/entities/char_2009.gif) :
:![[thin space (1/6-em)]](https://www.rsc.org/images/entities/char_2009.gif) 1 volume ratio. The WO3 dispersion ink containing PEG was spin coated at 2000 rpm for 10 s onto F-doped SnO2 (FTO) glass substrates. The films were preheated at 500 °C for 5 min. The coating and preheating processes were repeated several times to increase the film thickness, and the preheated films were then fired at 550 °C for 30 min in air. The phase purity and crystallinity of the WO3 thin films on the FTO substrates were determined by X-ray diffraction (SmartLab, Rigaku; Fig. S2†). The surface morphology and cross-sectional structure were determined by field emission scanning electron microscopy (FESEM; SU9000, Hitachi).
1 volume ratio. The WO3 dispersion ink containing PEG was spin coated at 2000 rpm for 10 s onto F-doped SnO2 (FTO) glass substrates. The films were preheated at 500 °C for 5 min. The coating and preheating processes were repeated several times to increase the film thickness, and the preheated films were then fired at 550 °C for 30 min in air. The phase purity and crystallinity of the WO3 thin films on the FTO substrates were determined by X-ray diffraction (SmartLab, Rigaku; Fig. S2†). The surface morphology and cross-sectional structure were determined by field emission scanning electron microscopy (FESEM; SU9000, Hitachi).
Linear sweep voltammetry (LSV) for photocurrent measurements and the production tests for Cr6+ and H2 were performed under 100 mW cm−2 AM1.5G simulated sunlight (1 sun) from a 150 W Xe lamp (XES-40S2-CE, San-Ei Electric) with Ar gas bubbling in aqueous Cr2(SO4)3 and H2SO4 solutions at 0.4–2.0 V versus the reversible hydrogen electrode (VRHE) in three-electrode one- or two-compartment cells equipped with a quartz glass window (30 mL of solution was used in each cell compartment). Illumination was carried out from the rear side of the photoanode (Fig. S3†). The 1 sun simulated sunlight was calibrated using a spectroradiometer (Fig. S4;† Soma Optics). A Ag/AgCl reference electrode in saturated KCl solution, a Pt-wire counter electrode, and a Nafion ion-exchange membrane were used, and the scan rate was 5 mV s−1. The measured potential versus Ag/AgCl (VAg/AgCl) in the three-electrode system was converted into VRHE according to the equation VRHE = VAg/AgCl + 0.059 × pH + V0Ag/AgCl, where V0Ag/AgCl = 0.1976 at 25 °C. The applied bias photon-to-current efficiency (ABPECr6+) values of the WO3 photoanodes were measured using a two-electrode configuration cell with a Pt-wire counter electrode, according to the equation ABPECr6+ = J(1.36 − ECE)η(Cr6+)/IAM1.5, where J is the photocurrent density (mA cm−2), ECE is the applied bias voltage versus the counter electrode, η(Cr6+) is the faradaic efficiency of Cr6+ production, and IAM1.5 is the irradiance of AM1.5G simulated sunlight at 100 mW cm−2. The production of Cr6+ and S2O82− was evaluated colorimetrically by using UV-vis spectroscopy (UV-3150, Shimadzu; Fig. S5†). The evolved H2 gas was detected using a gas chromatograph with a thermal conductivity detector (GC-8AIT, Shimadzu).
The reactions using photoelectrochemically evolved Cr6+ for p-benzoquinone production were carried out by the addition of p-benzenediol to the obtained Cr6+ test solutions. The production of p-benzoquinone was evaluated both colorimetrically using UV-vis spectroscopy and by gas chromatography-mass spectrometry (GC/MS; 7890B, Agilent and JMS-Q1500GC, JEOL).
Results and discussion
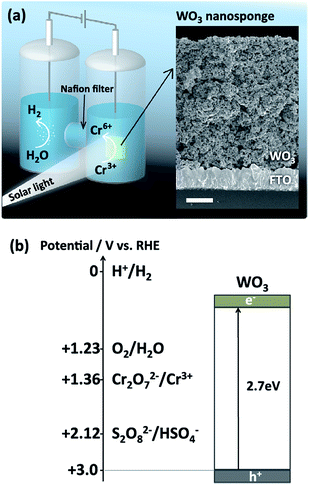
Fig. 1a shows the two-compartment PEC cell setup for the production of Cr6+ and H2 using a WO3 photoanode under simulated sunlight. We used FESEM to confirm that the prepared WO3 photoanodes possessed a nanosponge morphology23 with 5–100 nm nanopores and 5 μm thickness (Fig. S6†). To directly use the produced Cr6+ ions as chromic acid oxidation reagents, we mainly studied the PEC reaction of Cr3+ ions in aqueous sulfuric acid solution. Therefore, there are three candidates for oxidation in the anode cell: Cr3+ ions, HSO4− (SO42−)19,20 ions, and H2O. The oxidation potentials for the three reactants are shown in Fig. 1b, and the reactions and electrochemical potentials can be described as follows:| 2Cr3+ + 7H2O → Cr2O2−7 + 14H+ + 6e−, Cr2O2−7/Cr3+ = +1.36 V vs. RHE | (1) |
| 2HSO−4 → S2O2−8 + 2H+ + 2e−, S2O2−8/HSO−4 = +2.12 V vs. RHE | (2) |
| 2H2O → O2 + 4H+ + 4e−, O2/H2O = +1.23 V vs. RHE | (3) |
The PEC reaction depicted in eqn (2) has been previously reported for WO3 photoanodes in aqueous H2SO4 electrolytes under simulated sunlight.23–26 It is therefore necessary to consider this possible side reaction when studying the intended oxidation reaction shown in eqn (1).
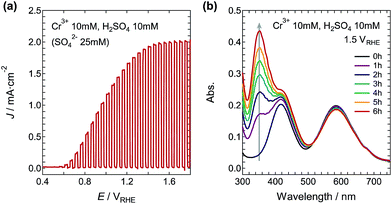
The LSV curve for the electrolyte containing 10 mM Cr3+ and 10 mM H2SO4 (pH = 1.38 and 25 mM SO42−) is shown in Fig. 2a. The onset potential of the photocurrent was about 0.55 VRHE, and the J increased up to 2.0 mA cm−2 at 1.45 VRHE. Using this solution, the WO3 photoanode was subjected to continuous illumination with the simulated sunlight at 1.50 VRHE. Color variation of the solution from bluish-green to greenish-yellow was observed during the illumination. The illumination-time dependence of the absorption spectra is shown in Fig. 2b. With increasing illumination time, the two maxima at 417 nm and 586 nm corresponding to the Cr3+ ions decreased and an additional two peaks appeared at 350 nm and 446 nm, which can be assigned to the Cr6+ ions (Fig. S5†). The applied electric charge at 6 h was 2.79 C, and the η(Cr6+) was determined to be 83.4%.
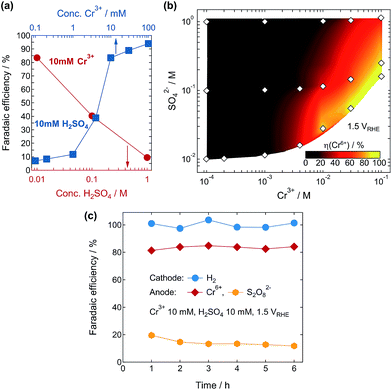
We have carefully studied the effects of the Cr3+ and SO42− concentrations in the solutions on the η(Cr6+). The value of η(Cr6+) varied almost inversely with the logarithm of the H2SO4 concentration and exhibited a sudden increase beyond a Cr3+ concentration of 1 mM (Fig. 3a). Fig. 3b shows a map of η(Cr6+) as functions of the Cr3+ and SO42− concentrations for the PEC reactions at 1.50 VRHE. The η(Cr6+) was found to be strongly enhanced at higher and lower concentrations of Cr3+ and SO42− ions, respectively. The η(Cr6+) exceeded 80% at a bias voltage of 1.50 VRHE above 10 mM Cr3+ and below 200 mM SO42−. Sulfate ions are known to be oxidized to S2O82− during PEC reactions at WO3 photoanodes;23–26 therefore, the η(Cr6+) would be heavily competing with the reaction of SO42− ions at the photoanode. We also analyzed the products formed at both electrodes during the PEC reaction in the electrolyte containing 10 mM Cr3+ and 10 mM H2SO4 at 1.50 VRHE. Hydrogen gas evolution with almost 100% faradaic efficiency was observed at the cathode, while Cr6+ and S2O82− ions were formed at the photoanode with efficiencies of 81–84% and 12–20%, respectively (Fig. 3c). We confirmed that other potential products such as oxygen were not observed at the anode cell, and the formation of Cr6+ ions was not due to oxidation by the simultaneously generated S2O82− ions (Fig. S7†). These results strongly indicate that the photocurrent was consumed for the production of Cr6+ and S2O82− ions at the photoanode in this system. The selectivity of products would be dependent on the adsorptivity of each chemical species on the WO3 photoanode surface. The Cr3+ ([Cr(H2O)6]3+) and HSO4− (SO42−) ions are expected to be preferentially adsorbed at the WO3 surface around this concentration range, compared to the water molecules.
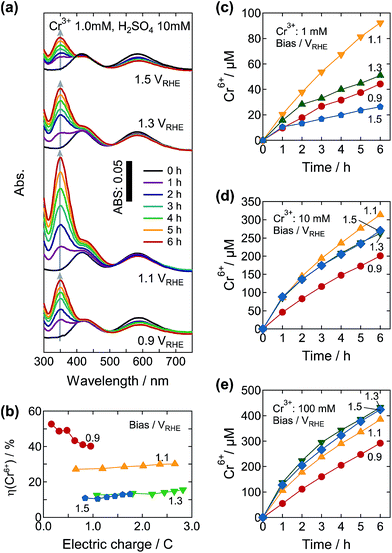
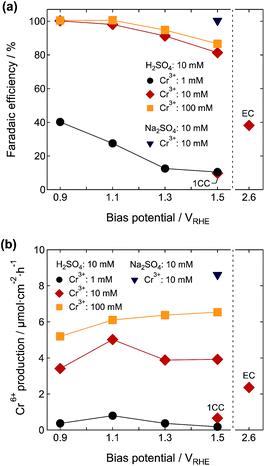
Fig. 4a shows the absorption spectra of electrolyte solutions (original concentrations were 1.0 mM Cr3+ and 10 mM H2SO4) during the PEC reactions under different external biases of 0.9, 1.1, 1.3, and 1.5 VRHE. Whereas the absorption peaks associated with the Cr6+ ions were observed with increasing illumination time at all of the bias voltages tested, the resulting peak intensity was strongly dependent on the bias voltage. The peak intensity at 350 nm reached a maximum at 1.1 VRHE. The J–V curve in this electrolyte was similar to those in 10 mM Cr3+ and 10 mM H2SO4, although it exhibited a somewhat more gradual increase that could be due to the insufficient supply of Cr3+ to the photoanode surface (Fig. S8†). Although the value of J increased from 0.55 VRHE and saturated at around 1.6 VRHE, the η(Cr6+) increased with the decreasing bias voltage. At about 1.0 C, the value of η(Cr6+) was 10.4% and 12.6% at 1.5 and 1.3 VRHE, respectively. A significantly higher η(Cr6+) of 27.5% was observed at 1.1 VRHE, and the value reached 40.2% at 0.9 VRHE. This η(Cr6+) variation was ascribed to the difference in theoretical redox potentials for the evolution of Cr6+ and S2O82− ions as detailed in Fig. 1b and eqn (1) and (2), indicating that the oxidation of Cr3+ is dominant at lower applied bias voltages. The competition between the Cr6+ and S2O82− ions was weakened by the increase of the initial amount of Cr3+ relative to SO42−. At 10 and 100 mM Cr3+, the value of η(Cr6+) reached almost 100% at 1.1 VRHE or below (Table 1). The concentrations of Cr6+ ions evolved in the electrolytes containing 10 and 100 mM Cr3+ were 313 μM at 1.1 VRHE and 432 μM at 1.3 VRHE, respectively (Fig. 4d and e).
| Bias/VRHE | η(Cr6+)/% for 1.0 mM Cr3+ | η(Cr6+)/% for 10 mM Cr3+ | η(Cr6+)/% for 100 mM Cr3+ |
|---|---|---|---|
| 0.9 | 40.2 | 100.2 | 101.8 |
| 1.1 | 27.5 | 98.1 | 99.0 |
| 1.3 | 12.6 | 91.2 | 97.0 |
| 1.5 | 10.4 | 81.3 | 94.0 |
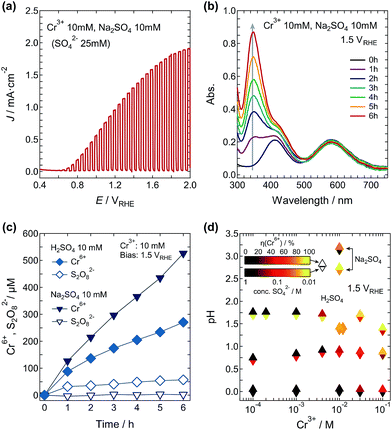
To evaluate the effect of acidity on the η(Cr6+), we also studied the PEC reaction in Na2SO4 electrolyte. The pH of a solution of 10 mM Cr3+ and 10 mM Na2SO4 was 2.70, while both the 10 mM Cr3+/10 mM Na2SO4 and 10 mM Cr3+/10 mM H2SO4 solutions contained the same concentration of SO42− ions (25 mM). The LSV curve using the Na2SO4 electrolyte increased gradually compared with that using the sulfuric acid electrolyte, and the photocurrent had not reached saturation even at 2.0 VRHE (Fig. 5a). A similar onset potential of around 0.55 VRHE for the two solutions indicates that the pH difference only affected the theoretical flat band potential shift and had almost no effect on the band structure and transport properties of WO3 itself. The inhibition of Cr3+ ([Cr(H2O)6]3+) supply (adsorption) to the photoanode surface due to the excess Na+ ions may be one possible explanation. In contrast, the peak intensities for the Cr6+ ions in the absorption spectra were clearly stronger than those in the sulfuric acid solution (Fig. 5b) and the η(Cr6+) at 1.5 VRHE was significantly higher at almost 100%. In accordance with this η(Cr6+) of almost 100%, the formation of S2O82− was not detected, and the concentration of Cr6+ ions generated after 6 h was 94% higher than that generated in the sulfuric acid solution (Fig. 5c).
Fig. 5d shows the η(Cr6+) and SO42− concentration as functions of the pH and Cr3+ concentration. The η(Cr6+) was actually enhanced by the low acidity of the Cr3+/Na2SO4 electrolyte, but it was not simply correlated with the pH value. The very high η(Cr6+) of 100% in 10 mM Cr3+ and 10 mM Na2SO4 (pH = 2.70 and 25 mM SO42−) was clearly lowered to 76.5% in 10 mM Cr3+ and 1.0 M Na2SO4 (pH = 3.15 and 1.015 M SO42−). As such, the SO42− concentration in this PEC reaction system cannot be ignored. The results of the PEC reaction in the Cr3+/Na2SO4 electrolyte also support the aforementioned key factor for the formation of Cr6+ ions: the η(Cr6+) faced strong competition with the production of S2O82− from the sulfate ions. The faradaic efficiency is strongly correlated with both the ratio of concentrations and the differences from each theoretical oxidation potential. The electrolyte effect of H2SO4/Na2SO4 on the shape of the J–V curves was not large.27 Therefore, it is necessary to discuss the correlation between H+/Na+ and Cr3+ and the surface properties of the WO3 photoanodes in this PEC reaction, because it could be affected by the cationic (Cr3+ ([Cr(H2O)6]3+)) and anionic (SO42−/HSO4−) adsorption dependences.
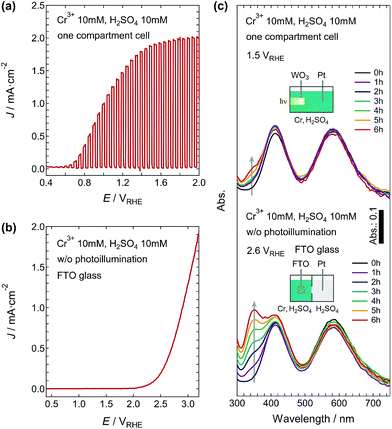
Fig. 6a shows the J–V curve for the electrolyte containing 10 mM Cr3+ and 10 mM H2SO4 using a one-compartment cell. The J–V curve was very similar to that obtained using the two-compartment cell; however, the Cr6+ generation at 1.5 VRHE was quite low compared with the latter case (Fig. 2). The absorption peak increased slightly even at 6 h (Fig. 6c), and the η(Cr6+) was determined to be 9.2%. This low η(Cr6+) would be better treated as an apparent value of the efficiency. Cr6+ ions are known to be reduced at the cathode;28–32 therefore, both oxidation and reduction reactions of chromium ions can occur at the photoanode and cathode, resulting in the apparent low η(Cr6+). Combinations of TiO2-based photoanodes and noble metal cathodes have generally shown that the Cr6+ reduction is dominant in PEC reaction systems using a one-compartment cell.28 Therefore, the use of WO3 photoanodes with strong oxidizability (valence band potential deeper than that of the TiO2)33–35 would provide an important advantage for obtaining Cr6+ ions by the PEC reaction. Nevertheless, it is necessary to employ the two-compartment cell setup for extracting Cr6+ ions efficiently.
We also carried out an electrochemical reaction for Cr6+ generation. Fig. 6b shows the J–V curve in the electrolyte containing 10 mM Cr3+ and 10 mM H2SO4 using the two-compartment cell and FTO anode without photo-illumination during the measurement. The onset potential for the current was about 2.05 VRHE and the current grew linearly above 2.5 VRHE. The amount of Cr6+ ions generated in the electrochemical reaction depended on the applied bias. At 2.6 VRHE, which is a much higher bias potential than that applied in the PEC reactions, the amount of Cr6+ ions generated was only 50–60% of that in the PEC reaction, and the η(Cr6+) remained at 40%. It has also been reported that the η(Cr6+) remained at 80% even at the much higher bias potential of 3.5 V.2 These results indicate that the PEC reaction using the WO3 photoanode can produce Cr6+ ions very efficiently compared with the electrochemical process.
The dependences of η(Cr6+) on the bias potential and electrolyte composition in the PEC reaction are summarized in Fig. 7a. The η(Cr6+) showed very high values at high Cr3+ concentrations above 10 mM and reached almost 100% below 1.1 VRHE. The amounts of Cr6+ produced at 1.5 VRHE were 3.9 and 6.5 μmol cm−2 h−1 at 10 and 100 mM Cr3+, respectively (Fig. 7b). For the electrolyte containing 10 mM Cr3+ and 10 mM H2SO4, the ABPECr6+ exhibited a maximum of 0.62% at 0.7 V versus the counter electrode in the two-electrode cell (Fig. S9†). The suppression of S2O82− production by the use of Na2SO4 electrolyte instead of sulfuric acid was very effective in enhancing the η(Cr6+). The Cr6+ production was 8.6 μmol cm−2 h−1 at 1.5 VRHE and 10 mM Cr3+. This value was 3.6 times higher than the electrochemical production at the same Cr3+ concentration and a much higher bias potential (2.6 VRHE).
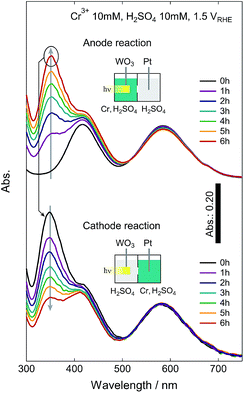
We also examined the backward reaction from the produced Cr6+ to Cr3+ (Fig. 8). The Cr6+-containing solution from the anode cell of the PEC reaction after 6 h (the original solution was 10 mM Cr3+ and 10 mM H2SO4) was switched with the sulfuric acid from the cathode cell (10 mM H2SO4). The absorption peak corresponding to the Cr6+ ions decreased with increasing time, and the calculated faradaic efficiency for conversion from the hexavalent to the trivalent form was very high (85%) and comparable with the forward PEC reaction to obtain the Cr6+. This result demonstrates that on-demand Cr6+ ion production is feasible and that Cr ions can be safely stored as the Cr3+ form in the reaction vessel (Fig. S10†).
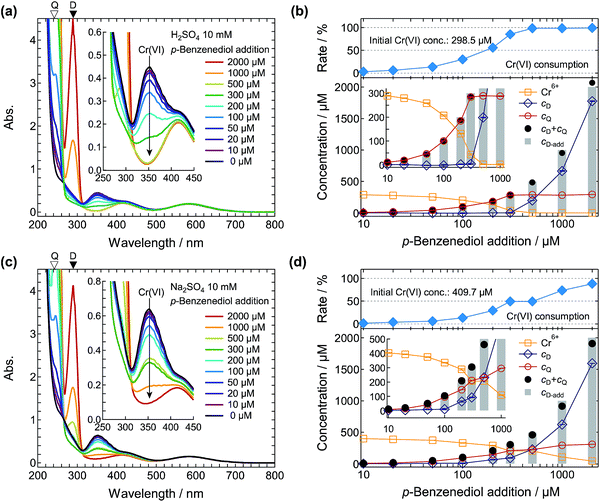
Finally, we carried out synthetic experiments for p-benzoquinone production using the Cr6+ ions obtained from the PEC reaction. As such, 10–2000 μM of p-benzenediol was added to the photoelectrochemically produced 298.5 μM Cr6+ in 10 mM H2SO4 solution. Fig. 9a shows the p-benzenediol input dependence of the absorption spectra. With increasing p-benzenediol addition, the absorption peak corresponding to the Cr6+ ions at 350 nm decreased and the absorption peak corresponding to the p-benzoquinone at 245 nm increased. The production of p-benzoquinone was also qualitatively confirmed by GC/MS analysis. In the reaction solution, we did not detect by-products. The absorption peak of Cr6+ at 350 nm disappeared when p-benzenediol concentrations of 500 μM or above were added, and the absorption peak corresponding to excess p-benzenediol started to appear at 290 nm. From the absorption spectra, the concentrations of Cr6+, p-benzenediol, and p-benzoquinone were determined, as shown in Fig. 9b and S11.† The Cr6+ ions were almost stoichiometrically consumed by the p-benzenediol addition. This indicates that the two hydroxyl groups of the p-benzenediol were successively oxidized by the Cr6+ ions in 10 mM H2SO4 and the produced intermediate Cr4+ ions (ESI†). From the initial concentration of Cr6+ used (298.5 μM), 85.7% and 98.9% of the Cr6+ ions were converted into Cr3+ with the addition of 300 or 500 μM of p-benzenediol, respectively. The amount of p-benzoquinone produced corresponded to the amount of Cr6+ consumed, indicating that the chromic acid oxidation process proceeded very effectively in this reaction system. The obtained p-benzoquinone was easily extracted by a conventional two-phase sampling method using appropriate solvents such as diethyl ether.
Fig. 9c shows the p-benzenediol input dependence of the absorption spectra for p-benzoquinone production using the Cr6+ ions obtained from the PEC reaction in the 10 mM Na2SO4 electrolyte. The initial concentration of Cr6+ was 409.7 μM. Although we confirmed that the p-benzenediol was converted into p-benzoquinone by the Cr6+ ions as well as in the case of the H2SO4 solution discussed above, Cr6+ ions remained even with the addition of 2000 μM of p-benzenediol. The conversion rate of Cr6+ with the addition of 1000 μM of p-benzenediol (2.4 times higher concentration than the initial concentration of Cr6+ ions) was still only 73.7%. These results suggest that the chromic acid oxidation in the Na2SO4 solution was less efficient than that in the H2SO4 solution. With the same input of p-benzenediol (300 μM), 34% more p-benzoquinone was obtained in the H2SO4 solution than in the Na2SO4 solution, despite the lower initial concentration of Cr6+ ions. This means that the H2SO4 electrolyte is also effective for producing quinones in the chromic acid oxidation process using the photoelectrochemically produced Cr6+ ions, although the η(Cr6+) is slightly lower compared with that observed using the Na2SO4 electrolyte.
Thus, we have demonstrated the efficient PEC oxidation of Cr3+ to Cr6+, the chromic acid oxidation for obtaining quinones, and the PEC reduction of Cr6+ to Cr3+ ions. The Cr ion redox mediator can be used for oxidation processes of a wide variety of organics by the PEC reaction due to its high oxidizability, compared to the other PEC redox systems, e.g., Ni2+/Ni3+ mediator.36 When the external bias voltage is supplied by a solar cell, high-value-added organic reagents can be produced on site and on demand via the chromic acid oxidation by the solar-energy-driven continuous PEC recycling of Cr3+ to Cr6+. This PEC reaction system with Cr ions would also be effective for green energy production, in terms of not only the hydrogen gas evolved from the counter electrode but also the possibility of a new redox flow cell with high energy density using the multi-electron redox reaction of Cr3+/Cr6+ ions. In addition, maintaining a safe stock of Cr ions will be possible by the PEC reduction of Cr6+. All of these reactions can feasibly be performed in a single closed reaction vessel, permitting the safe use of Cr6+ ions. Therefore, this system enables the chromic acid oxidation process to be employed for the production of high-value-added reagents without the generation of hazardous chromium waste (Fig. 10), allowing the great industrial value of chromium ions to be exploited once again.
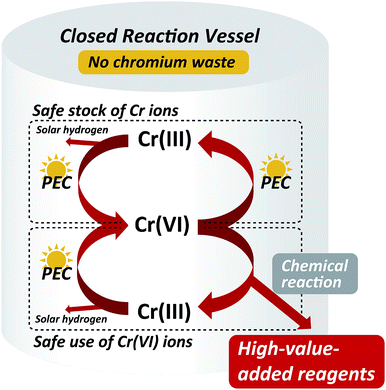 | ||
| Fig. 10 Schematic conceptual diagram for the cyclic solar-energy-driven use of Cr ions between Cr3+/Cr6+ and the production of high-value-added organic reagents using the chromic acid oxidation. | ||
Conclusions
The PEC oxidation of chromium ions from the trivalent to the hexavalent form has been demonstrated for the first time by using WO3 nanosponge photoanodes in sulfuric acid electrolyte under simulated sunlight. Faradaic efficiencies of almost 100% were achieved using electrolytes containing high Cr3+ (≥10 mM) and low SO42− (≤10 mM) concentrations at very low bias potential voltages below 1.1 VRHE, as the production of Cr6+ ions was able to outcompete the production of S2O82− ions from HSO4−/SO42− ions at the photoanode. In the Na2SO4 electrolyte, the faradaic efficiency was 100% even at 1.5 VRHE. At the cathode, hydrogen evolution occurred with 100% faradaic efficiency. Moreover, the recovery of Cr3+ was also confirmed at the cathode by switching the electrolytes of the anode and cathode cells after the Cr6+ production, indicating that the complete cyclic PEC reaction between the Cr3+ and Cr6+ ions is possible. Finally, we have demonstrated the applicability of chromic acid oxidation to quinone production by using the photoelectrochemically produced Cr6+ ions in sulfuric acid solution. As such, p-benzenediol was successfully converted into p-benzoquinone with high efficiency. We have therefore shown that high-value-added reagents can be produced via photoelectrochemically driven chromic acid oxidation with the recycling of Cr6+ from Cr3+ using solar energy. All of these reactions can be performed in a single closed reaction vessel, permitting the very safe use of Cr6+ ions and suggesting a renewed role for chromium ions in future industrial applications.Conflicts of interest
There are no conflicts to declare.Acknowledgements
The authors thank Dr S. Iguchi and Dr Y. Miseki for valuable discussions. This research was partially supported by the International Joint Research Program for Innovative Energy Technology of the Ministry of Economy, Trade and Industry (METI).Notes and references
- A. Lennartson, Nat. Chem., 2014, 6, 942 CrossRef CAS PubMed.
- G. Anger, J. Halstenberg, K. Hochgeschwender, C. Scherhag, U. Korallus, H. Knopf, P. Schmidt and M. Ohlinger, Chromium Compounds, in Ullmann's Encyclopedia of Industrial Chemistry, J. Wiley & Sons, New York, 2000 Search PubMed.
- M. Owlad, M. K. Aroua, W. A. W. Daud and S. Baroutian, Water, Air, Soil Pollut., 2009, 200, 59 CrossRef CAS.
- S. Langard, Am. J. Ind. Med., 1990, 17, 189 CrossRef CAS PubMed.
- M. Cieślak-Golonka, Polyhedron, 1996, 15, 3667 CrossRef.
- W. Mertz, J. Nutr., 1993, 123, 1993 Search PubMed.
- S. Langard and T. Vigander, Br. J. Ind. Med., 1983, 40, 71 CAS.
- H. C. Brown and C. P. Garg, J. Am. Chem. Soc., 1961, 83, 2952 CrossRef CAS.
- F. H. Westheimer, Chem. Rev., 1949, 45, 419 CrossRef CAS.
- G. Cainelli, G. Cardillo, M. Orena and S. Sandri, J. Am. Chem. Soc., 1976, 98, 6737 CrossRef CAS.
- F. Holloway, M. Cohen and F. H. Westheimer, J. Am. Chem. Soc., 1951, 73, 65 CrossRef CAS.
- L. F. Fieser, J. Am. Chem. Soc., 1948, 70, 3165 CrossRef CAS PubMed.
- K. W. Wellington, RSC Adv., 2015, 5, 20309 RSC.
- D. G. Barceloux, J. Toxicol., Clin. Toxicol., 1999, 37, 173 CrossRef CAS PubMed.
- T. Takata, A. Tanaka, M. Hara, J. N. Kondo and K. Domen, Catal. Today, 1998, 44, 17 CrossRef CAS.
- A. Steinfeld, Sol. Energy, 2005, 78, 603 CrossRef CAS.
- D. Gust, T. A. Moore and A. L. Moore, Acc. Chem. Res., 2009, 42, 1890 CrossRef CAS PubMed.
- T. Nakajima, T. Nakamura, K. Shinoda and T. Tsuchiya, J. Mater. Chem. A, 2014, 2, 6762 CAS.
- R. Saito, Y. Miseki and K. Sayama, Chem. Commun., 2012, 48, 3833 RSC.
- U. Kammel and T. Schulzke, Chem. Ing. Tech., 1995, 67, 495 CrossRef CAS.
- T.-K. Yang and C.-Y. Shen, 1,4-Benzoquinone, in Encyclopedia of Reagents for Organic Synthesis, ed. L. Paquette, J. Wiley & Sons, New York, 2004 Search PubMed.
- T. Nakajima, T. Kitamura and T. Tsuchiya, Appl. Catal., B, 2011, 108–109, 47 CrossRef CAS.
- T. Nakajima, A. Hagino, T. Nakamura, T. Tsuchiya and K. Sayama, J. Mater. Chem. A, 2016, 4, 17809 CAS.
- Q. Mi, A. Zhanaidarova, B. S. Brunschwig, H. B. Gray and N. S. Lewis, Energy Environ. Sci., 2012, 5, 5694 CAS.
- K. Fuku, N. Wang, Y. Miseki, T. Funaki and K. Sayama, ChemSusChem, 2015, 8, 1593 CrossRef CAS PubMed.
- S. H. Ahn, J. Zhao, J. H. Kim and X. Zheng, Electrochim. Acta, 2017, 244, 184 CrossRef CAS.
- J. C. Hill and K.-S. Choi, J. Phys. Chem. C, 2012, 116, 7612 CAS.
- C. Liu, Y. Ding, W. Wu and Y. Teng, Chem. Eng. J., 2016, 306, 22 CrossRef CAS.
- Y. Zhang, Q. Wang, J. Lu, Q. Wang and Y. Cong, Chemosphere, 2016, 162, 55 CrossRef CAS PubMed.
- X. Feng, J. Shang and T. Zhu, Electrochim. Acta, 2016, 188, 752 CrossRef CAS.
- H.-T. Hsu, S.-S. Chen, Y.-F. Tang and H.-C. Hsi, J. Hazard. Mater., 2013, 248–249, 97 CrossRef CAS PubMed.
- H. Song, J. Shang, J. Ye and Q. Li, Thin Solid Films, 2014, 551, 158 CrossRef CAS.
- M. Miyauchi, A. Nakajima, T. Watanabe and K. Hashimoto, Chem. Mater., 2002, 14, 4714 CrossRef CAS.
- P. S. Kumar, J. Sundaramurthy, S. Sundarrajan, V. J. Babu, G. Singh, S. I. Allakhverdiev and S. Ramakrishna, Energy Environ. Sci., 2014, 7, 3192 CAS.
- B. D. Alexander, P. J. Kulesza, I. Rutkowska, R. Solarska and J. Augustynski, J. Mater. Chem., 2008, 18, 2298 RSC.
- G. Wang, Y. Ling, X. Lu, T. Zhai, F. Qian, Y. Tong and Y. Li, Nanoscale, 2013, 5, 4129 RSC.
Footnote |
| † Electronic supplementary information (ESI) available. See DOI: 10.1039/c7ta08001h |
| This journal is © The Royal Society of Chemistry 2018 |

