Stability enhancing ionic liquid hybrid electrolyte for NVP@C cathode based sodium batteries†
C. V.
Manohar
 abc,
Anish
Raj K
a,
Mega
Kar
c,
Maria
Forsyth
 d,
Douglas R.
MacFarlane
 *c and
Sagar
Mitra
 *a
*a
aElectrochemical Energy Storage Laboratory, Department of Energy Science and Engineering, IIT Powai, Mumbai-400076, India. E-mail: sagar.mitra@iitb.ac.in; Tel: +91 22 2576 7849
bIITB-Monash Research Academy, IIT Powai, Mumbai-400076, India
cSchool of Chemistry, Monash University, Victoria, Australia. E-mail: douglas.macfarlane@monash.edu; Tel: +61 3 9905 4540
dInstitute for Frontier Materials, Deakin University, Burwood, Victoria, Australia
First published on 10th January 2018
Abstract
Cost-efficient, high-voltage, stable sodium-based cathodes are needed to develop commercial-scale sodium batteries. In this work, a Na3V2(PO4)3/carbon (NVP@C) composite sodium cathode material is synthesized by a novel, facile, two-step, solid state method. This material delivered a discharge capacity of 115 mA h g−1 at 0.5C rate with a conventional organic electrolyte. Improvements in stable cycling were found when NVP@C was paired with a “hybrid” electrolyte comprising a [50![[thin space (1/6-em)]](https://www.rsc.org/images/entities/char_2009.gif) :
:![[thin space (1/6-em)]](https://www.rsc.org/images/entities/char_2009.gif) 50] v/v mixture of 1 M sodium bis(fluorosulfonyl)amide (NaFSI) in an organic electrolyte and an ionic liquid, N-methyl-N-propyl pyrrolidinium bis(trifluoromethanesulfonyl)amide (C3mpyrTFSI). Sodium batteries based on the NVP@C cathode retained 95% of their initial capacity after 100 cycles at 0.5C rate. We show that the hybrid electrolyte enhanced the electrochemical performance of the NVP@C cathode material by forming a stable SEI (solid-electrolyte interphase) layer on the surface. Electron microscopy and X-ray photoelectron spectroscopy were used to study the SEI layers on electrodes that had been subjected to 100 cycles with hybrid or conventional organic electrolytes. The hybrid electrolyte produced a less resistive, highly Na+ ion permeable SEI layer, explaining its superior sodium battery performance, compared to that found with the conventional organic electrolyte.
50] v/v mixture of 1 M sodium bis(fluorosulfonyl)amide (NaFSI) in an organic electrolyte and an ionic liquid, N-methyl-N-propyl pyrrolidinium bis(trifluoromethanesulfonyl)amide (C3mpyrTFSI). Sodium batteries based on the NVP@C cathode retained 95% of their initial capacity after 100 cycles at 0.5C rate. We show that the hybrid electrolyte enhanced the electrochemical performance of the NVP@C cathode material by forming a stable SEI (solid-electrolyte interphase) layer on the surface. Electron microscopy and X-ray photoelectron spectroscopy were used to study the SEI layers on electrodes that had been subjected to 100 cycles with hybrid or conventional organic electrolytes. The hybrid electrolyte produced a less resistive, highly Na+ ion permeable SEI layer, explaining its superior sodium battery performance, compared to that found with the conventional organic electrolyte.
1. Introduction
Lithium ion batteries are undoubtedly the most successful energy storage devices to date, and are used for portable electronics, electric vehicle propulsion and stationary storage. However, lithium reserves are considered to be limited, or in politically unstable environs,1 meaning that extensive use of lithium-ion batteries in stationary applications could exhaust lithium resources and thereby further increase the cost of lithium.1,2 New battery chemistries that are based on cheaper, more sustainable materials must therefore be developed as fossil fuels are phased out while renewable forms of energy generation require stable and inexpensive energy storage to overcome their variability of supply. An obvious alternative to lithium is sodium, which, like lithium, shows intercalation chemistry suitable for use in energy-storage devices.3 Sodium is also abundant, cheap, and relatively easy to recycle.1 In the sodium ion battery, the negative current collector can consist of inexpensive, lighter and more abundant Al instead of Cu. Together, this makes sodium ion batteries a potential technology to compete with lithium-ion batteries.4Commercialized sodium technologies include high temperature Na/S cells for MW energy storage and Na–NiCl2 ZEBRA-type cells for electric vehicles.2 Both cells employ a highly conducting beta-alumina ceramic electrolyte, and operate above 300 °C.2 Room-temperature sodium-ion batteries are sought-after because they are expected to be more efficient, safer and more reliable than high-temperature batteries.3,5,6
Sodium ions are larger, and diffuse more slowly, than lithium ions.7 This presents a tremendous challenge for the development of reversible intercalation electrodes that can deliver charge quickly. A variety of host materials, including transition-metal oxides, phosphates, and ferrocyanides, have been explored as potential cathodes for sodium-ion batteries.7–17 Although these materials have relatively high operating potential windows, they display multi-step charge–discharge processes which may lead to poor cycling stability in battery applications.18
In contrast, materials based on NASICON-type sodium vanadium phosphate (Na3V2(PO4)3) combined with carbon are promising cathodes for sodium-ion batteries, displaying high operating potential (3.4 V), high rate capability, and excellent cycling stability.19–23 In 2010, the first report of a Na3V2(PO4)3 material by Yamaki et al. displayed poor cycling stability, which was associated with the low electronic conductivity of the phosphate framework.24 However, Jian et al. made in situ carbon coated Na3V2(PO4)3 composite cathodes, which showed vastly improved cycling performance in a sodium-ion battery.25 Work has continued on different synthesis methods for in situ carbon coating to provide a conductive matrix for the cathode and improve the insertion of Na+ ions into Na3V2(PO4)3.26–29 The target of the present studies is a simple synthesis of the cathode and increased electronic conductivity with excellent stability.
In batteries, electrolyte selection is also critical—electrolytes must have high ionic conductivity, a wide electrochemical stability and high thermal stability. Commercial lithium-ion battery electrolytes comprise a lithium salt dissolved in organic solvents. These display excellent ionic conductivity, but are volatile, toxic and flammable.30–33 Ionic liquid (IL) based electrolytes have been proposed to enhance battery safety, and have been extensively studied for lithium-ion batteries over the past few years.34–38 This work suggests that ILs may also be suitable electrolytes for sodium-ion batteries.39–44 In particular, pyrrolidinium-based ILs display a large electrochemical window and good cycling stability with sodium.40,41,43 For example, 1-methyl-1-propyl pyrrolidinium bis(fluorosulfonyl)imide (C3mpyrFSI) has been used as an electrolyte with hard carbon and NaCrO2 electrode systems, and was cycled more than 500 times in a sodium-ion battery.42 Imidazolium based ILs have also been used as electrolytes for different sodium-ion battery systems, but the acidic proton on the imidazolium ring causes decomposition of the electrolyte at relatively modest voltages.45–49
ILs generally display higher viscosity and lower ionic conductivity than conventional organic electrolytes at room temperature. Therefore in order to reduce their viscosity, “hybrid electrolytes”—mixtures of ILs and organic electrolytes—were developed, and provided improved electrochemical performance and safety in lithium-ion batteries.50–54 Palacín et al. reported hybrid electrolyte formulations and studied their physical properties, electrolyte thermal stability, solvation ability and electrochemical performance with hard carbon as a sodium-ion battery anode.55 However, the electrochemical stability of this hybrid electrolyte was found to be only 3 V versus sodium, which is too low for most sodium cathode materials.
Here we seek improved sodium batteries that can operate at room temperature. We have developed a simple synthesis of a composite cathode of carbon and Na3V2(PO4)3, NVP@C and characterized its performance in detail with hybrid electrolytes comprising 1 M NaFSI in a mixture of ethylene carbonate (EC)/propylene carbonate (PC) organic electrolyte and an ionic liquid, (C3mpyrTFSI). The surface layers formed on the cathode are examined by XPS, TEM and SEM.
2. Experimental section
2.1. Preparation of Na3V2(PO4)3/C
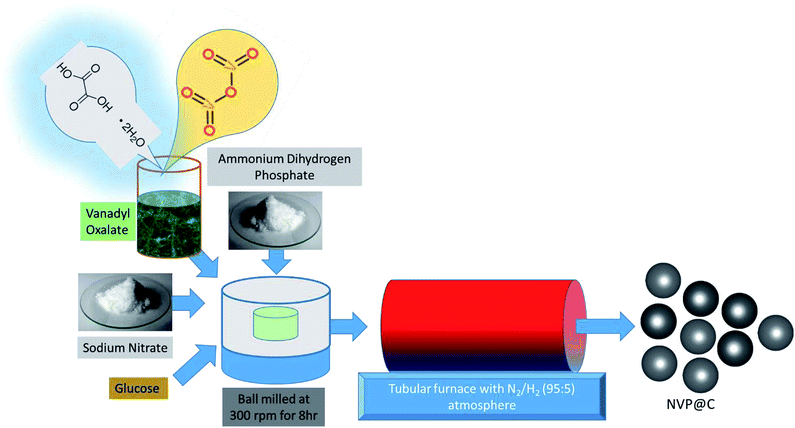
The NVP@C composite material was synthesized by a two-step, glucose-assisted solid-state reaction, as shown in Fig. 1. The key to this facile synthesis is the use of oxalic acid to form vanadium oxalate as a precursor. Firstly, 0.3 mol oxalic acid dihydrate was dissolved in 50 ml distilled water, and 0.1 mol vanadium oxide powder was added. The solution was stirred at 120 °C for 5 h to form a sticky blue gel, which was then dried overnight under vacuum at 80 °C. The obtained powder was ground and heated at 100 °C in air for 1 h to form vanadium oxalate. In the second step, sodium nitrate, as-prepared vanadium oxalate and diammonium hydrogen phosphate (to give a mole ratio of Na![[thin space (1/6-em)]](https://www.rsc.org/images/entities/char_2009.gif) :
:![[thin space (1/6-em)]](https://www.rsc.org/images/entities/char_2009.gif) V
V![[thin space (1/6-em)]](https://www.rsc.org/images/entities/char_2009.gif) :
:![[thin space (1/6-em)]](https://www.rsc.org/images/entities/char_2009.gif) P of 3
P of 3![[thin space (1/6-em)]](https://www.rsc.org/images/entities/char_2009.gif) :
:![[thin space (1/6-em)]](https://www.rsc.org/images/entities/char_2009.gif) 2
2![[thin space (1/6-em)]](https://www.rsc.org/images/entities/char_2009.gif) :
:![[thin space (1/6-em)]](https://www.rsc.org/images/entities/char_2009.gif) 3) and 17 wt% of glucose were dispersed in alcohol and ball milled at 300 rpm for 8 h. The obtained solution was dried overnight under vacuum at 80 °C. The obtained powder was ground for 1 h in a mortar and pestle, and subjected to a two-stage calcination, at 350 °C for 5 h and 850 °C for 8 h in a 5% H2–95% N2 atmosphere to obtain well-crystallized Na3V2(PO4)3/C.
3) and 17 wt% of glucose were dispersed in alcohol and ball milled at 300 rpm for 8 h. The obtained solution was dried overnight under vacuum at 80 °C. The obtained powder was ground for 1 h in a mortar and pestle, and subjected to a two-stage calcination, at 350 °C for 5 h and 850 °C for 8 h in a 5% H2–95% N2 atmosphere to obtain well-crystallized Na3V2(PO4)3/C.
2.2. Preparation of hybrid electrolytes based on C3mpyrTFSI
1.0 M NaFSI (99%, Solvionic, France) was dissolved in C3mpyrTFSI (99%, Solvionic, France) (α) and ethylene carbonate/propylene carbonate (EC/PC) (Sigma Aldrich, India) (1 − α), (where α = volume fraction C3mpyrTFSI = 0, 0.25, 0.5, 0.75, 1). The volume ratio of EC and PC was fixed at 1![[thin space (1/6-em)]](https://www.rsc.org/images/entities/char_2009.gif) :
:![[thin space (1/6-em)]](https://www.rsc.org/images/entities/char_2009.gif) 1. All electrolyte preparation was carried out inside an argon-filled glove box. All hybrid electrolyte formulations are listed in Table 1.
1. All electrolyte preparation was carried out inside an argon-filled glove box. All hybrid electrolyte formulations are listed in Table 1.
| Electrolyte name | Electrolyte compositions |
|---|---|
| Organic | 1 M NaFSI in EC![[thin space (1/6-em)]](https://www.rsc.org/images/entities/char_2009.gif) : :![[thin space (1/6-em)]](https://www.rsc.org/images/entities/char_2009.gif) PC (1 PC (1![[thin space (1/6-em)]](https://www.rsc.org/images/entities/char_2009.gif) : :![[thin space (1/6-em)]](https://www.rsc.org/images/entities/char_2009.gif) 1) v/v 1) v/v |
| Hybrid-1 | 1 M NaFSI in OG(EC![[thin space (1/6-em)]](https://www.rsc.org/images/entities/char_2009.gif) : :![[thin space (1/6-em)]](https://www.rsc.org/images/entities/char_2009.gif) PC) PC)![[thin space (1/6-em)]](https://www.rsc.org/images/entities/char_2009.gif) : :![[thin space (1/6-em)]](https://www.rsc.org/images/entities/char_2009.gif) IL (75 IL (75![[thin space (1/6-em)]](https://www.rsc.org/images/entities/char_2009.gif) : :![[thin space (1/6-em)]](https://www.rsc.org/images/entities/char_2009.gif) 25) v/v 25) v/v |
| Hybrid-2 | 1 M NaFSI in OG(EC![[thin space (1/6-em)]](https://www.rsc.org/images/entities/char_2009.gif) : :![[thin space (1/6-em)]](https://www.rsc.org/images/entities/char_2009.gif) PC) PC)![[thin space (1/6-em)]](https://www.rsc.org/images/entities/char_2009.gif) : :![[thin space (1/6-em)]](https://www.rsc.org/images/entities/char_2009.gif) IL (50 IL (50![[thin space (1/6-em)]](https://www.rsc.org/images/entities/char_2009.gif) : :![[thin space (1/6-em)]](https://www.rsc.org/images/entities/char_2009.gif) 50) v/v 50) v/v |
| Hybrid-3 | 1 M NaFSI in OG(EC![[thin space (1/6-em)]](https://www.rsc.org/images/entities/char_2009.gif) : :![[thin space (1/6-em)]](https://www.rsc.org/images/entities/char_2009.gif) PC) PC)![[thin space (1/6-em)]](https://www.rsc.org/images/entities/char_2009.gif) : :![[thin space (1/6-em)]](https://www.rsc.org/images/entities/char_2009.gif) IL (25 IL (25![[thin space (1/6-em)]](https://www.rsc.org/images/entities/char_2009.gif) : :![[thin space (1/6-em)]](https://www.rsc.org/images/entities/char_2009.gif) 75) v/v 75) v/v |
2.3. Material characterization
A powder X-ray diffractometer with Cu Kα radiation at 40 kV and 40 mA (Rigaku, Japan), measuring across a 2θ range of 5–60° at a scan rate of 0.5 °C min−1 was used to identify the crystalline phases within the NVP@C. The carbon content was determined from carbon hydrogen nitrogen analysis (CHN).For ex situ measurements, electrodes were removed from their cells in an argon-filled glovebox, washed with dimethyl carbonate (DMC) and thoroughly dried. X-ray photoelectron spectroscopy (XPS) data were collected with a Thermo Scientific MultiLab spectrometer using a concentric hemispherical analyzer and a micro focused, monochromatic Al Kα X-ray source. Field emission gun scanning electron microscopy (FEG-SEM, JSM-7600F, and Carl-Zeiss, Ultra-55) combined with energy dispersive X-ray spectroscopy (EDX) and high-resolution transmission electron microscopy (HR-TEM, Jeol-2100F) was employed to study the microstructure and passivation layers on the electrode surfaces.
2.4. Electrochemical performance
Electrochemical performance testing was carried out using a Swagelok-type half-cell configuration with NVP@C as the working electrode and one piece of sodium foil as the counter/reference electrode separated by a borosilicate glass fiber separator (GF/D, Whatman), soaked in electrolyte. To prepare the working electrode, 80% active material, 10% carbon (carbon black, C-65, Timcal), and 10% PVDF (Sigma-Aldrich) binder were blended with N-methyl-2-pyrrolidone solvent and cast onto aluminum foil. The solvent was removed under vacuum in an oven at 120 °C overnight, and the electrode was cut into circular discs (10 mm or 12 mm diameter, loading mass ∼ 1.12 mg) for further use. Charge–discharge tests, electrochemical impedance spectroscopy (EIS) and cyclic voltammetry (CV) tests on NVP@C were performed using a Biologic VMP-3 battery testing unit at 20 ± 2 °C. The scan rate for CV was 0.05 mV s−1. Electrochemical stability window tests were performed in a three-electrode Swagelok cell using Na as the counter and reference electrodes and aluminium foil as the working electrodes.Ionic conductivity was measured with AC impedance spectroscopy, as discussed in references cited herein.56,57 Viscosities were measured using a rolling ball viscometer (Anton paar Lovis 2000ME) from 20 °C to 90 °C using 10 °C interval steps, a 10 mm long capillary with a diameter of 2.5 mm and a tilting angle of 60°.
3. Results and discussion
3.1. Synthesis and characterization of NVP@C electrodes
Our novel approach to the synthesis of NVP–carbon composites is described in detail in the Experimental section and summarised in Fig. 1. This process is facile and could be readily scaled up. The XRD pattern of as-prepared NVP@C is displayed in Fig. 2a. The NVP@C diffraction patterns match with ICSDS data (card no-248410) and show the formation of a crystalline NASICON-type framework with an R![[3 with combining macron]](https://www.rsc.org/images/entities/char_0033_0304.gif) C space group.19 NASICON-type Na3V2(PO4)3 has a 3-dimensional framework of VO6 octahedra sharing all corners with PO4; two different sodium-ion sites occur: M1 sites, where Na1 ions are 6-fold coordinated, and M2 sites, where Na2 ions are 8-fold coordinated. Because of strong binding of the Na+ ions at M1 sites by the surrounding oxygen atoms, Na+ ions are extracted from and inserted into M2 sites during charging and discharging, respectively. Thus, a theoretical capacity of 117 mA h g−1 is obtained for this structure based on the reversible insertion/extraction of the two Na+ ions at M2 sites.
C space group.19 NASICON-type Na3V2(PO4)3 has a 3-dimensional framework of VO6 octahedra sharing all corners with PO4; two different sodium-ion sites occur: M1 sites, where Na1 ions are 6-fold coordinated, and M2 sites, where Na2 ions are 8-fold coordinated. Because of strong binding of the Na+ ions at M1 sites by the surrounding oxygen atoms, Na+ ions are extracted from and inserted into M2 sites during charging and discharging, respectively. Thus, a theoretical capacity of 117 mA h g−1 is obtained for this structure based on the reversible insertion/extraction of the two Na+ ions at M2 sites.
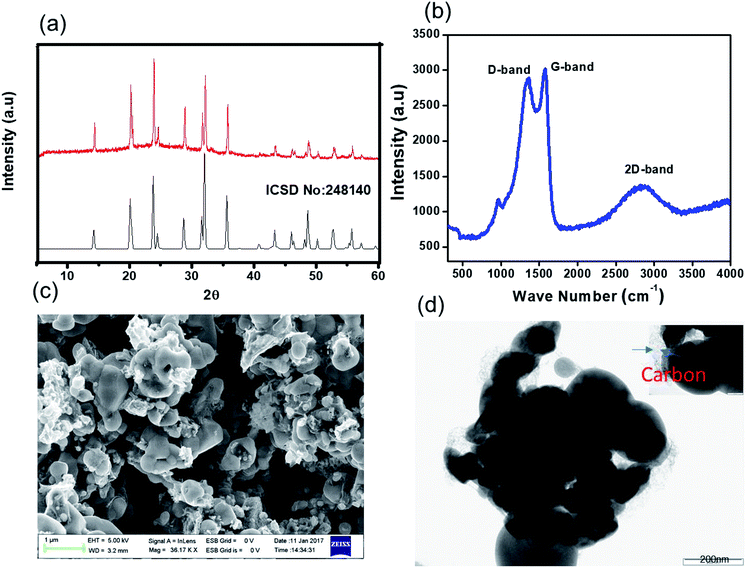 | ||
| Fig. 2 Characterization of NVP@C: (a) powder XRD pattern (the red spectrum is the experimental, and the black spectrum is the literature); (b) Raman spectrum; (c) FE-SEM image; and (d) HR-TEM images. | ||
The surface of NVP@C was investigated with Raman spectroscopy (Fig. 2b). NVP@C displayed a vibration band around 1000 cm−1, which corresponds to the weak stretching vibrations of PO43−. The stronger peaks at 1316 cm−1 and 1605 cm−1 are related to the D and G bands intrinsic to residual carbon, confirming the presence of amorphous carbon in NVP@C. This is consistent with the elemental analysis, which found that NVP@C contains 4.2 wt% carbon.
Fig. 2c is an SEM image of the as-prepared NVP@C powder, showing micron-sized particles. The TEM image in Fig. 2d shows agglomerates of NVP@C particles partly coated with amorphous carbon.
The CV for NVP@C, measured with a conventional electrolyte (1 M NaClO4 in EC![[thin space (1/6-em)]](https://www.rsc.org/images/entities/char_2009.gif) :
:![[thin space (1/6-em)]](https://www.rsc.org/images/entities/char_2009.gif) PC (1
PC (1![[thin space (1/6-em)]](https://www.rsc.org/images/entities/char_2009.gif) :
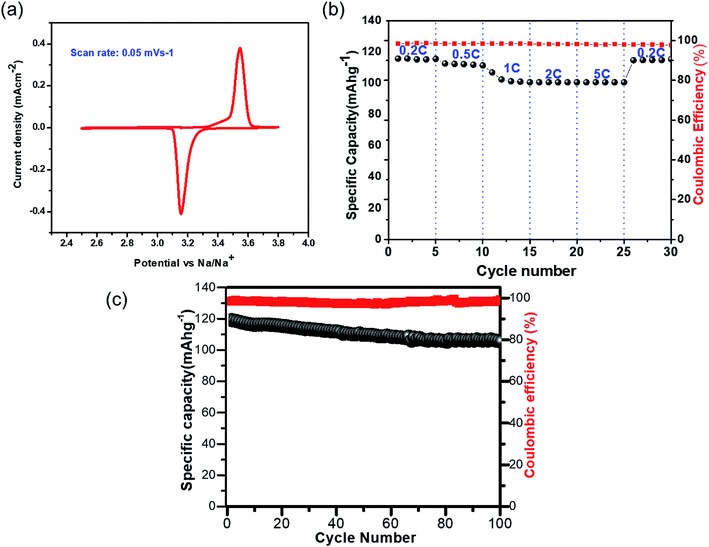
:![[thin space (1/6-em)]](https://www.rsc.org/images/entities/char_2009.gif) 1) v/v) at a scan rate of 0.05 mV s−1, showed two redox peaks at 3.54 and 3.15 V vs. Na+/Na, which correspond to the oxidation/reduction of V4+/V3+ (Fig. 3a). The charge–discharge cycling performance of NVP@C at different current densities is presented in Fig. 3b; NVP@C showed initial discharge capacity values of 114, 112, 104, 102 and 100 mA h g−1 at discharge rates of 0.2, 0.5, 1, 2 and 5C, respectively. This result indicates lower polarization loss and high reversible capacity of our NVP@C composite material as compared to previously reported versions of similar materials.19,20,25,28,29,58,59 As shown in Fig. 3c, NVP@C retains 89% of its capacity when charged and discharged at 0.5C for 100 cycles. This material was further investigated with the hybrid electrolytes as discussed below.
1) v/v) at a scan rate of 0.05 mV s−1, showed two redox peaks at 3.54 and 3.15 V vs. Na+/Na, which correspond to the oxidation/reduction of V4+/V3+ (Fig. 3a). The charge–discharge cycling performance of NVP@C at different current densities is presented in Fig. 3b; NVP@C showed initial discharge capacity values of 114, 112, 104, 102 and 100 mA h g−1 at discharge rates of 0.2, 0.5, 1, 2 and 5C, respectively. This result indicates lower polarization loss and high reversible capacity of our NVP@C composite material as compared to previously reported versions of similar materials.19,20,25,28,29,58,59 As shown in Fig. 3c, NVP@C retains 89% of its capacity when charged and discharged at 0.5C for 100 cycles. This material was further investigated with the hybrid electrolytes as discussed below.
3.2. Characterization of hybrid electrolytes
The ionic conductivity of the organic and hybrid electrolytes as a function of C3mpyrTFSI concentration at various temperatures is shown in Fig. 4a. At 25 °C, the conductivity value of the organic electrolyte was 5.5 mS cm−1, which is consistent with a previously reported value.60 The conductivities of the hybrid electrolytes decreased with increasing IL concentration (4.2, 3.2, and 2.9 mS cm−1 for hybrid-1, hybrid-2 and hybrid-3, respectively); this is expected because of the increased viscosity and enhanced ion–ion interactions at higher IL concentrations.61,62 The viscosities of organic and hybrid electrolytes are shown in Fig. 4b; the hybrid electrolyte viscosities increase at higher IL concentrations.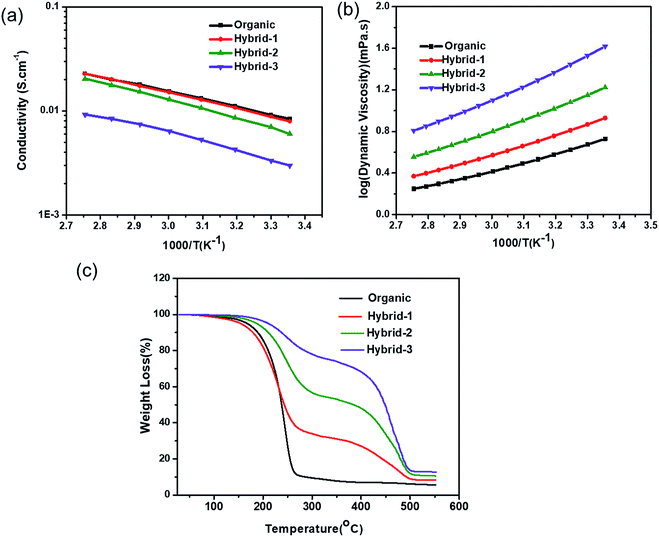 | ||
| Fig. 4 (a) Ionic conductivity (b) viscosity and (c) TGA measurements for organic and hybrid electrolytes. | ||
The thermogravimetric analysis (TGA) data for the organic and hybrid electrolytes are shown in Fig. 4c. The organic electrolyte showed a significant mass loss of >75% when the temperature reached 250 °C, corresponding to the evaporation of organic solvents (EC and PC). In contrast, the hybrid electrolytes showed lower mass losses: 55%, 27% and 12% for hybrid-1, hybrid-2 and hybrid-3, respectively at 250 °C, indicating their increased thermal stability. Furthermore, the addition of C3mpyrTFSI to the electrolytes shifted the EC/PC evaporation temperature to higher values.
CV was used to evaluate the electrochemical oxidative stability for the electrolytes in contact with sodium metal (Fig. 5). Hybrid electrolytes showed higher oxidative stability than the organic electrolyte; the oxidative stability trend followed the IL concentration with hybrid-3 (5.1 V vs. Na+/Na) > hybrid-2 (5 V vs. Na+/Na) > hybrid-1 (4.2 V vs. Na+/Na) > organic electrolyte (4 V vs. Na+/Na).
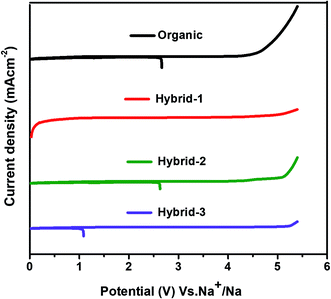 | ||
| Fig. 5 Electrochemical oxidative stability tests (by cyclic voltammetry) in three electrode Swagelok cells at 10 mV s−1 scan rate. | ||
3.3. NVP@C combined with hybrid electrolytes
The CVs of NVP@C with organic (1 M NaFSI in EC![[thin space (1/6-em)]](https://www.rsc.org/images/entities/char_2009.gif) :
:![[thin space (1/6-em)]](https://www.rsc.org/images/entities/char_2009.gif) PC(1
PC(1![[thin space (1/6-em)]](https://www.rsc.org/images/entities/char_2009.gif) :
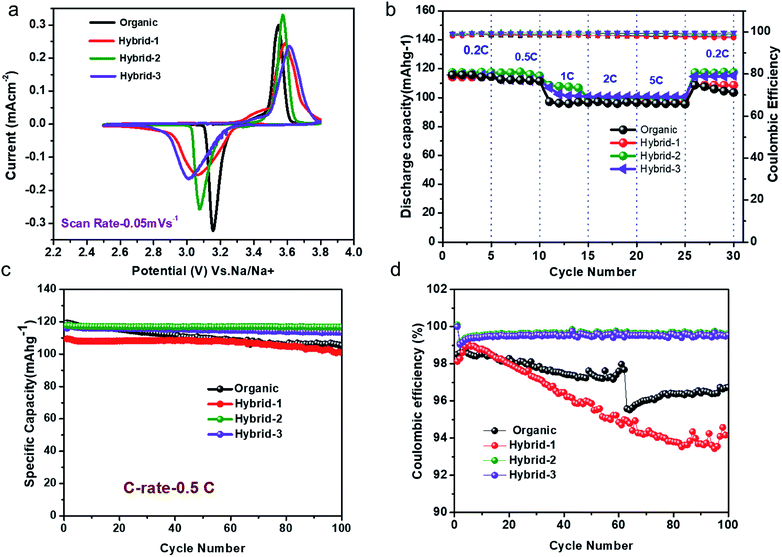
:![[thin space (1/6-em)]](https://www.rsc.org/images/entities/char_2009.gif) 1) (v/v)) and our new hybrid electrolytes are shown in Fig. 6a. NVP@C clearly shows the oxidation/reduction reaction, Na3V2(PO4)3 ↔ NaV2(PO4)3, in both organic (at 3.44 ± 0.02 V vs. Na/Na+) and hybrid (at 3.22 ± 0.02 V vs. Na/Na+) electrolytes. The hybrid-2 electrolyte shows a sharp peak with the NVP@C material compared to organic, hybrid-1 and hybrid-3 electrolytes (Fig. 6a). This may be attributed to the formation of a more stable passivation film on the cathode, as discussed further below under SEI characterization. Fig. 6b shows the charge–discharge cycling performance of NVP@C with organic, hybrid-1, hybrid-2 and hybrid-3 electrolytes at various current rates from 0.2 to 5C for 5 cycles. NVP@C with the hybrid-2 electrolyte delivered discharge capacities of 115, 112, 108, 104 and 100 mA h g−1 at 0.2, 0.5, 1, 2 and 5C, respectively. After this cycling, the discharge capacity of the same NVP@C material was measured again at 0.2C, and yielded the original value of 115 mA h g−1. This shows the stable cycling performance of this combination of the hybrid electrolyte and NVP@C. The behaviour of NVP@C with the organic electrolyte was similar to that with the hybrid electrolyte at lower discharge rates (115 and 112 mA h g−1 at 0.2 and 0.5C, respectively). However, at higher discharge rates (1, 2 and 5C) in the organic electrolyte, the capacity decreased to 95 mA h g−1. There is no capacity loss observed for hybrid electrolytes even at the 5C rate.
1) (v/v)) and our new hybrid electrolytes are shown in Fig. 6a. NVP@C clearly shows the oxidation/reduction reaction, Na3V2(PO4)3 ↔ NaV2(PO4)3, in both organic (at 3.44 ± 0.02 V vs. Na/Na+) and hybrid (at 3.22 ± 0.02 V vs. Na/Na+) electrolytes. The hybrid-2 electrolyte shows a sharp peak with the NVP@C material compared to organic, hybrid-1 and hybrid-3 electrolytes (Fig. 6a). This may be attributed to the formation of a more stable passivation film on the cathode, as discussed further below under SEI characterization. Fig. 6b shows the charge–discharge cycling performance of NVP@C with organic, hybrid-1, hybrid-2 and hybrid-3 electrolytes at various current rates from 0.2 to 5C for 5 cycles. NVP@C with the hybrid-2 electrolyte delivered discharge capacities of 115, 112, 108, 104 and 100 mA h g−1 at 0.2, 0.5, 1, 2 and 5C, respectively. After this cycling, the discharge capacity of the same NVP@C material was measured again at 0.2C, and yielded the original value of 115 mA h g−1. This shows the stable cycling performance of this combination of the hybrid electrolyte and NVP@C. The behaviour of NVP@C with the organic electrolyte was similar to that with the hybrid electrolyte at lower discharge rates (115 and 112 mA h g−1 at 0.2 and 0.5C, respectively). However, at higher discharge rates (1, 2 and 5C) in the organic electrolyte, the capacity decreased to 95 mA h g−1. There is no capacity loss observed for hybrid electrolytes even at the 5C rate.
The charge–discharge cycling performance of NVP@C was examined at 0.5C rate with both organic and hybrid electrolytes for 100 cycles (Fig. 6c). NVP@C retained its discharge capacity of 112 ± 3 mA h g−1 at 0.5C rate for 100 cycles with hybrid-2 and hybrid-3 electrolytes. NVP@C with the organic electrolyte gave the 1st and 100th discharge capacities of 112 ± 3 mA h g−1 and 105 ± 2 mA h g−1, respectively, at 0.5C rate – a capacity retention of 87% over 100 cycles. NVP@C in the hybrid electrolytes with higher concentrations of IL delivered both slightly higher discharge capacities and stable cycling performance compared to those obtained in the organic and hybrid-1 electrolytes.
The coulombic efficiency data for 100 cycles are shown in Fig. 6d. NVP@C in hybrid-2 and hybrid-3 electrolytes displayed coulombic efficiencies of approximately 99%, respectively, over 100 cycles while NVP@C with organic and hybrid-1 electrolytes gave coulombic efficiencies of 98% and 96%, respectively. In summary, the hybrid electrolytes offer more stable cycling than the organic electrolyte.
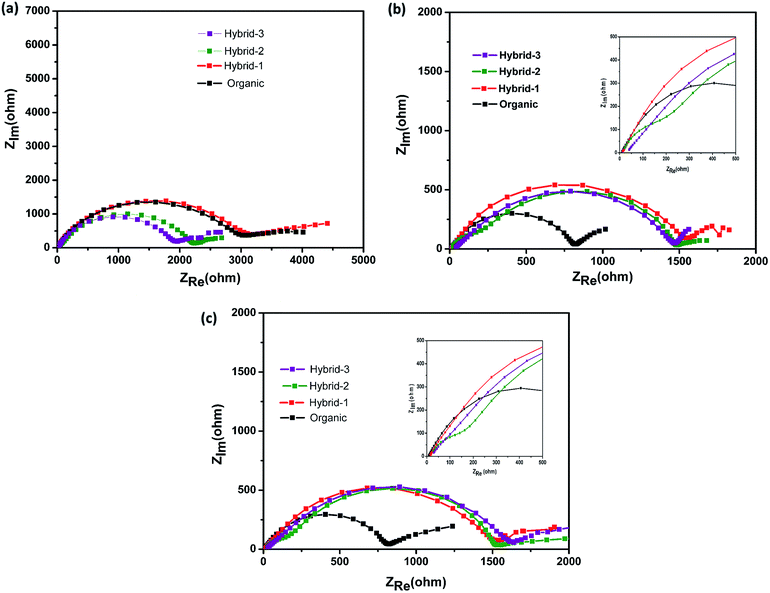 | ||
| Fig. 7 Electrochemical impedance measurements for Na//Na symmetrical cells at (a) OCV, (b) after 50 cycles, and (c) after 100 cycles with organic and hybrid electrolytes. | ||
Electrochemical impedance spectroscopy (EIS) studies were also performed for organic and hybrid electrolytes with sodium foil as the anode material and the NVP@C electrode as the cathode material in 2032 coin cells. The EIS spectra are shown in Fig. 8. These experiments were performed at the OCV, 1st cycle, 50th cycle and 100th cycle, while cycling at 0.5C rate. The differences observed here are more dramatic than those observed for the Na/Na symmetric cells and suggest that the different electrolytes have a much larger impact on the cathode performance. At the OCV and 1st cycle, hybrid electrolytes showed lower charge transfer resistances in the EIS, as compared to that obtained with the organic electrolyte (Fig. 8a and b). After the 50th cycle, we can see a depressed semicircle at high frequency. The magnitude of the depressed semicircle is too large to be related to the sodium anode SEI layer and therefore we hypothesise that this is related to the SEI layer resistance on the NVP@C electrode material (Table S1†). A second depressed semicircle occurs in the low frequency region, which is related to charge transfer resistance, for hybrid-2 and hybrid-3 electrolytes. The values of charge-transfer resistance and SEI layer resistance obtained with the hybrid electrolytes are lower than those obtained with the organic electrolyte. After the 100th cycle, the EIS spectra of the hybrid electrolytes still displayed lower SEI layer resistances at high frequency and smaller charge transference resistances (Fig. 8d) than the organic electrolyte.
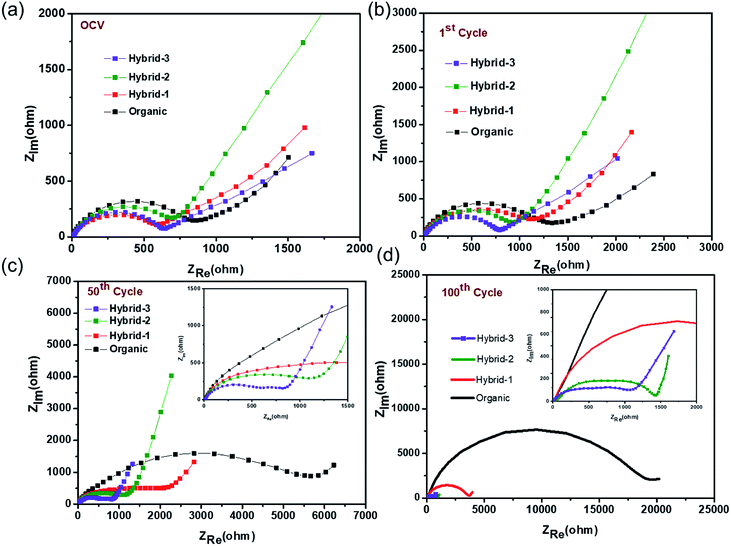 | ||
| Fig. 8 Electrochemical impedance measurements for NVP@C at (a) OCV, (b) after 1 cycle, (c) after 50 cycles, (d) after 100 cycles with organic and hybrid electrolytes. | ||
Thus, EIS data demonstrate that hybrid-2 and hybrid-3 electrolytes provide significantly more stable and low resistance SEI layers on the working surface of the NVP@C electrode material. This is consistent with the improved cell cycling behaviour demonstrated in Fig. 6. In the case of the organic electrolyte, a depressed semicircle in the high frequency region and Warburg diffusion impedance in the low frequency region were not observed. This EIS spectrum indicates that the organic electrolyte generates an unstable passivation layer and poor Na+ ion diffusion between the electrode and electrolyte interface while cycling with the NVP@C electrode. This unstable passivation layer formation has been observed in other studies on cycling with organic electrolytes in sodium ion batteries. The hybrid-1 electrolyte showed less SEI resistance and charge transfer resistance as compared to the organic electrolyte but still greater than hybrid 2 or 3.
The FEG-SEM images (Fig. S1†) of the NVP@C electrode before and after 100 cycles show that the pristine electrode has a rough surface with many pores; after 100 cycles, the electrode has become rather smooth, because of the formation of an SEI layer on the surface during cycling. In both cases, no structural damage is seen on the NVP@C electrode. The data suggest that increasing the IL concentration in the hybrid electrolytes prevents the decomposition of organic solvents (EC and PC) that has been observed in other systems.51,65,66
EDX analyses were used to identify elements on the NVP@C electrode after 100 cycles (Fig. S2†). Sulphur traces were present on the surface of the NVP@C electrode, probably from retained anions. HR-TEM images were obtained, as shown in Fig. 9 and S3,† and show clear differences between the passivation layer formation on the surface of the NVP@C electrode with organic and hybrid electrolytes. Fig. 9a shows that a uniform passivation layer has been formed on the surface of the NVP@C electrode in the organic electrolyte (∼3.9 ± 0.3 nm), as expected from the evidence of the impedance spectrum (Fig. 7 and 8). Fig. 9b shows a thinner SEI layer (∼2.5 ± 0.3 nm) on the cathode (as compared to that in Fig. 9a) formed in the hybrid-2 electrolyte, as also observed in the impedance spectra in Fig. 7 and 8. It is proposed that in hybrid electrolytes the presence of ionic liquid may suppress the NaFSI-induced reaction on the surface of the cathode material (Fig. S3†) and prevent the electrolyte decomposition on the cathode surface (Table S1†). In lithium and sodium-ion batteries, hybrid electrolytes have previously shown good cycling performance, and thermal stability (Table S2†). Furthermore a stable SEI layer on the surface of both the cathode and anode is shown in these systems.51,55,65,66 In our case the hybrid-2 and hybrid-3 electrolytes have shown a lower interfacial resistance, and a more stable SEI. In addition, a higher thermal and electrochemical stability is observed here in comparison to the literature.51,64–67
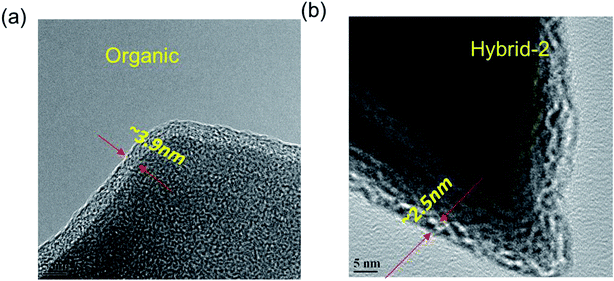 | ||
| Fig. 9 HR-TEM images of NVP@C electrodes after cycling with the (a) organic, and (b) hybrid-2 electrolyte. | ||
XPS studies were used to identify the surface traces on the surface of NVP@C electrodes after 100 cycles with organic and hybrid electrolytes (Fig. S4†). In the C1s spectrum, 284 eV, 286 eV and 290 eV peaks are assigned to carbonates, sodium carbonates and alkyl carbonate, which are known to be the major components of the passivation film on the surface of NVP@C.64,65 In the F1s spectrum, a peak at 687.4 eV is assigned to S–FSI−, NaxPOyFz, P–F and NaF components, which arise from the organic electrolyte decomposition.64 In the case of hybrid electrolytes, SO2F and NaxPOyTFSI peaks are assigned at the same peak position. These may come from the ionic liquid (C3mpyrTFSI) and the phosphate framework to form a passivation layer as observed in other systems.54,64,65 In the S2p spectrum, 169.4 eV and 168.5 eV peaks are assigned to Na–TFSI, Na–FSI and SO2F compositions as a passivation film on the surface of the electrode with hybrid electrolytes. In organic electrolytes, an Na–FSI peak is observed as a passivation film composition in other sodium electrolytes.64,65 In the hybrid electrolytes, separated Na–FSI and Na–TFSI peaks are not observed in the XPS spectrum. In the O1s spectrum, peak positions at 530.5 eV, 531.3 eV and 532.8 eV are assigned to Na2O, Na–O, sodium bicarbonates, CH3CH2OCO2Na3, and sodium carbonate, as observed in other sodium cathodes with organic electrolytes.64 But in the case of hybrid electrolytes, an additional Na–TFSI peak is observed on the surface of the cathode which most likely arises from the anion in the ionic liquid (C3mpyrTFSI) present in the hybrid electrolytes. This peak is overlapped with the Na–FSI peak position in the XPS spectrum. In the case of hybrid electrolytes, these peaks show a higher intensity than in the organic electrolyte.
4. Conclusions
In this work, we have successfully synthesised a cathode material, a NVP@C composite, for sodium-ion batteries, by an inexpensive synthesis route. This material displayed good cycling performance and high rate cycling stability with the conventional organic electrolyte. Further studies with hybrid electrolytes (mixtures of ionic liquid and organic–solvent-based electrolytes) showed good electrochemical performance with the NVP@C composite material, and suppressed electrolyte decomposition on the surfaces of both the cathode material and the sodium metal. The hybrid-2 and hybrid-3 electrolytes also showed greater thermal stability, wider oxidative stability, higher specific capacity and more stable passivation layers, compared to the organic electrolyte, making them excellent candidates as potential electrolytes for sodium-ion batteries.Conflicts of interest
There are no conflicts to declare.Acknowledgements
The authors are grateful to the SAIF, IIT Bombay for their assistance for HR-TEM, CHN and XPS analysis. SEM and XRD analysis assistance supported by NCPRE-IIT Bombay and DESE, IIT Bombay. This work is financially supported by the IITB-Monash Research Academy and NCPRE-IIT Bombay. DRM and MF are grateful to the Australian Research Council for their Australian Laureate Fellowships.References
- B. Dunn, H. Kamath and J.-M. Tarascon, Science, 2011, 334, 928–935 CrossRef CAS PubMed.
- M. R. Palacín, Chem. Soc. Rev., 2009, 38, 2565–2575 RSC.
- M. S. Whittingham, Prog. Solid State Chem., 1978, 12, 41–99 CrossRef CAS.
- L. Schafzahl, I. Hanzu, M. Wilkening and S. A. Freunberger, ChemSusChem, 2017, 10, 401–408 CrossRef CAS PubMed.
- K. Abraham, Solid State Ionics, 1982, 7, 199–212 CrossRef CAS.
- S. P. Ong, V. L. Chevrier, G. Hautier, A. Jain, C. Moore, S. Kim, X. Ma and G. Ceder, Energy Environ. Sci., 2011, 4, 3680–3688 CAS.
- D. Yuan, X. Liang, L. Wu, Y. Cao, X. Ai, J. Feng and H. Yang, Adv. Mater., 2014, 26, 6301–6306 CrossRef CAS PubMed.
- Y. Cao, L. Xiao, W. Wang, D. Choi, Z. Nie, J. Yu, L. V. Saraf, Z. Yang and J. Liu, Adv. Mater., 2011, 23, 3155–3160 CrossRef CAS PubMed.
- Y. Wang, X. Yu, S. Xu, J. Bai, R. Xiao, Y.-S. Hu, H. Li, X.-Q. Yang, L. Chen and X. Huang, Nat. Commun., 2013, 4, 2365 Search PubMed.
- N. Yabuuchi, M. Kajiyama, J. Iwatate, H. Nishikawa, S. Hitomi, R. Okuyama, R. Usui, Y. Yamada and S. Komaba, Nat. Mater., 2012, 11, 512–517 CrossRef CAS PubMed.
- D. Kim, S. H. Kang, M. Slater, S. Rood, J. T. Vaughey, N. Karan, M. Balasubramanian and C. S. Johnson, Adv. Energy Mater., 2011, 1, 333–336 CrossRef CAS.
- A. Bhide, J. Hofmann, A. K. Durr, J. Janek and P. Adelhelm, Phys. Chem. Chem. Phys., 2014, 16, 1987–1998 RSC.
- Z. Jian, C. Yuan, W. Han, X. Lu, L. Gu, X. Xi, Y. S. Hu, H. Li, W. Chen and D. Chen, Adv. Funct. Mater., 2014, 24, 4265–4272 CrossRef CAS.
- Y. Fang, L. Xiao, X. Ai, Y. Cao and H. Yang, Adv. Mater., 2015, 27, 5895–5900 CrossRef CAS PubMed.
- C. Zhu, K. Song, P. A. van Aken, J. Maier and Y. Yu, Nano Lett., 2014, 14, 2175–2180 CrossRef CAS PubMed.
- S.-M. Oh, S.-T. Myung, J. Hassoun, B. Scrosati and Y.-K. Sun, Electrochem. Commun., 2012, 22, 149–152 CrossRef CAS.
- Y. Fang, J. Zhang, L. Xiao, X. Ai, Y. Cao and H. Yang, Adv. Sci., 2017, 4, 1600392 CrossRef PubMed.
- Y.-J. Fang, Z.-X. Chen, X.-P. Al, H.-X. Yang and Y.-L. Cao, Acta Phys.-Chim. Sin., 2017, 33, 211–241 CAS.
- W. Duan, Z. Zhu, H. Li, Z. Hu, K. Zhang, F. Cheng and J. Chen, J. Mater. Chem. A, 2014, 2, 8668–8675 CAS.
- H. Li, Y. Bai, F. Wu, Y. Li and C. Wu, J. Power Sources, 2015, 273, 784–792 CrossRef CAS.
- Y. H. Jung, C. H. Lim and D. K. Kim, J. Mater. Chem. A, 2013, 1, 11350–11354 CAS.
- Y. Jiang, Z. Yang, W. Li, L. Zeng, F. Pan, M. Wang, X. Wei, G. Hu, L. Gu and Y. Yu, Adv. Energy Mater., 2015, 5, 1402104 CrossRef.
- W.-X. Song, H.-S. Hou and X.-B. Ji, Acta Phys.-Chim. Sin., 2017, 33, 103–129 CAS.
- L. S. Plashnitsa, E. Kobayashi, Y. Noguchi, S. Okada and J.-i. Yamaki, J. Electrochem. Soc., 2010, 157, A536–A543 CrossRef CAS.
- J. Yang, D.-W. Han, M. R. Jo, K. Song, Y.-I. Kim, S.-L. Chou, H.-K. Liu and Y.-M. Kang, J. Mater. Chem. A, 2015, 3, 1005–1009 CAS.
- S. Li, Y. Dong, L. Xu, X. Xu, L. He and L. Mai, Adv. Mater., 2014, 26, 3358 CrossRef.
- S. Y. Lim, H. Kim, R. A. Shakoor, Y. Jung and J. W. Choi, J. Electrochem. Soc., 2012, 159, A1393–A1397 CrossRef CAS.
- J. Mao, C. Luo, T. Gao, X. Fan and C. Wang, J. Mater. Chem. A, 2015, 3, 10378–10385 CAS.
- K. Saravanan, C. W. Mason, A. Rudola, K. H. Wong and P. Balaya, Adv. Energy Mater., 2013, 3, 444–450 CrossRef CAS.
- S. Cull, J. Holbrey, V. Vargas-Mora, K. Seddon and G. Lye, Biotechnol. Bioeng., 2000, 69, 227–233 CrossRef CAS PubMed.
- G. Nagasubramanian and K. Fenton, Electrochim. Acta, 2013, 101, 3–10 CrossRef CAS.
- V. Etacheri, R. Marom, R. Elazari, G. Salitra and D. Aurbach, Energy Environ. Sci., 2011, 4, 3243–3262 CAS.
- S. W. Kim, D. H. Seo, X. Ma, G. Ceder and K. Kang, Adv. Energy Mater., 2012, 2, 710–721 CrossRef CAS.
- H. Matsumoto, M. Yanagida, K. Tanimoto, M. Nomura, Y. Kitagawa and Y. Miyazaki, Chem. Lett., 2000, 29, 922–923 CrossRef.
- B. Garcia, S. Lavallée, G. Perron, C. Michot and M. Armand, Electrochim. Acta, 2004, 49, 4583–4588 CrossRef CAS.
- M. Galiński, A. Lewandowski and I. Stępniak, Electrochim. Acta, 2006, 51, 5567–5580 CrossRef.
- A. Lewandowski and A. Świderska-Mocek, J. Power Sources, 2009, 194, 601–609 CrossRef CAS.
- H. Matsumoto, H. Sakaebe and K. Tatsumi, J. Power Sources, 2005, 146, 45–50 CrossRef CAS.
- C. Ding, T. Nohira, K. Kuroda, R. Hagiwara, A. Fukunaga, S. Sakai, K. Nitta and S. Inazawa, J. Power Sources, 2013, 238, 296–300 CrossRef CAS.
- S. A. Mohd Noor, P. C. Howlett, D. R. MacFarlane and M. Forsyth, Electrochim. Acta, 2013, 114, 766–771 CrossRef CAS.
- J. S. Moreno, G. Maresca, S. Panero, B. Scrosati and G. Appetecchi, Electrochem. Commun., 2014, 43, 1–4 CrossRef.
- T. Hosokawa, K. Matsumoto, T. Nohira, R. Hagiwara, A. Fukunaga, S. Sakai and K. Nitta, J. Phys. Chem. C, 2016, 120, 9628–9636 CAS.
- H. Yoon, H. Zhu, A. Hervault, M. Armand, D. R. MacFarlane and M. Forsyth, Phys. Chem. Chem. Phys., 2014, 16, 12350–12355 RSC.
- M. Armand, F. Endres, D. R. MacFarlane, H. Ohno and B. Scrosati, Nat. Mater., 2009, 8, 621–629 CrossRef CAS PubMed.
- S. Hashmi, M. Y. Bhat, M. K. Singh, N. K. Sundaram, B. P. Raghupathy and H. Tanaka, J. Solid State Electrochem., 2016, 20, 2817–2826 CrossRef CAS.
- D. Monti, E. Jónsson, M. R. Palacín and P. Johansson, J. Power Sources, 2014, 245, 630–636 CrossRef CAS.
- J. G. Huddleston, A. E. Visser, W. M. Reichert, H. D. Willauer, G. A. Broker and R. D. Rogers, Green Chem., 2001, 3, 156–164 RSC.
- K. Kreuer, A. Fuchs, M. Ise, M. Spaeth and J. Maier, Electrochim. Acta, 1998, 43, 1281–1288 CrossRef CAS.
- P. Bonhote, A.-P. Dias, N. Papageorgiou, K. Kalyanasundaram and M. Grätzel, Inorg. Chem., 1996, 35, 1168–1178 CrossRef CAS PubMed.
- S. Menne, R.-S. Kühnel and A. Balducci, Electrochim. Acta, 2013, 90, 641–648 CrossRef CAS.
- S. Theivaprakasam, D. R. MacFarlane and S. Mitra, Electrochim. Acta, 2015, 180, 737–745 CrossRef CAS.
- S. Wilken, S. Xiong, J. Scheers, P. Jacobsson and P. Johansson, J. Power Sources, 2015, 275, 935–942 CrossRef CAS.
- M. Montanino, M. Moreno, M. Carewska, G. Maresca, E. Simonetti, R. L. Presti, F. Alessandrini and G. Appetecchi, J. Power Sources, 2014, 269, 608–615 CrossRef CAS.
- T. Vogl, S. Menne and A. Balducci, Phys. Chem. Chem. Phys., 2014, 16, 25014–25023 RSC.
- D. Monti, A. Ponrouch, M. R. Palacín and P. Johansson, J. Power Sources, 2016, 324, 712–721 CrossRef CAS.
- G. Girard, M. Hilder, H. Zhu, D. Nucciarone, K. Whitbread, S. Zavorine, M. Moser, M. Forsyth, D. MacFarlane and P. Howlett, Phys. Chem. Chem. Phys., 2015, 17, 8706–8713 RSC.
- H. Yoon, P. Howlett, A. Best, M. Forsyth and D. MacFarlane, J. Electrochem. Soc., 2013, 160, A1629–A1637 CrossRef CAS.
- H. Wang, D. Jiang, Y. Zhang, G. Li, X. Lan, H. Zhong, Z. Zhang and Y. Jiang, Electrochim. Acta, 2015, 155, 23–28 CrossRef CAS.
- X. Zhu, Y. Fang, X. Ai, H. Yang and Y. Cao, J. Alloys Compd., 2015, 646, 170–174 CrossRef CAS.
- J. Lee, Y. Lee, J. Lee, S.-M. Lee, J.-H. Choi, H. Kim, M.-S. Kwon, K. Kang, K. T. Lee and N.-S. Choi, ACS Appl. Mater. Interfaces, 2017, 9, 3723–3732 CAS.
- J. Qian, W. A. Henderson, W. Xu, P. Bhattacharya, M. Engelhard, O. Borodin and J.-G. Zhang, Nat. Commun., 2015, 6, 6362 CrossRef CAS PubMed.
- J. Wang, Y. Yamada, K. Sodeyama, C. H. Chiang, Y. Tateyama and A. Yamada, Nat. Commun., 2016, 7, 12032 CrossRef CAS PubMed.
- C.-H. Wang, C.-H. Yang and J.-K. Chang, Chem. Commun., 2016, 52, 10890–10893 RSC.
- Z. W. Seh, J. Sun, Y. Sun and Y. Cui, ACS Cent. Sci., 2015, 1, 449–455 CrossRef CAS PubMed.
- S. Theivaprakasam, J. Wu, J. C. Pramudita, N. Sharma, D. R. Macfarlane and S. Mitra, J. Phys. Chem. C, 2017, 129, 15630–15638 Search PubMed.
- R.-S. Kühnel, N. Böckenfeld, S. Passerini, M. Winter and A. Balducci, Electrochim. Acta, 2011, 56, 4092–4099 CrossRef.
- A. Bhide, J. Hofmann, A. K. Dürr, J. Janek and P. Adelhelm, Phys. Chem. Chem. Phys., 2014, 16, 1987–1998 RSC.
Footnote |
| † Electronic supplementary information (ESI) available. See DOI: 10.1039/c7se00537g |
| This journal is © The Royal Society of Chemistry 2018 |

