DOI:
10.1039/C8RA01744A
(Paper)
RSC Adv., 2018,
8, 16069-16081
Predicting sulfur solubility in hydrogen sulfide, carbon dioxide, and methane with an improved thermodynamic model
Received
27th February 2018
, Accepted 19th April 2018
First published on 30th April 2018
Abstract
During development of high sulfur-content natural gas fields, gaseous sulfur is likely to precipitate and deposit in the reservoir and transmission pipelines owing to changes in the temperature, pressure, and gas components. It is important to accurately predict the elemental sulfur solubility in hydrogen sulfide, carbon dioxide, and methane because these are the three main components of high-sulfur-content natural gas. The binary interaction coefficients between sulfur and hydrogen sulfide, carbon dioxide, and methane are the key parameters for predicting the sulfur solubility with a thermodynamic model. In this work, we show that the binary interaction coefficients are not constant, but temperature dependent. Three-parameter temperature-dependent equations for the binary interaction coefficients between sulfur and solvents are proposed. The corresponding regression equations for calculating the binary interaction coefficients between sulfur and hydrogen sulfide, carbon dioxide, and methane are obtained using experimental sulfur solubility data. The average relative errors of the sulfur solubility predicted using the experimental data in hydrogen sulfide, carbon dioxide, and methane using the thermodynamic model with the improved binary interaction coefficients are 6.30%, 1.69%, and 4.34%, and the average absolute relative errors are 7.90%, 13.12%, and 14.98%, respectively. Comparing the improved binary interaction coefficients with four other sets of reported values shows that the solubility values predicted by the thermodynamic model with improved binary interaction coefficients fit the experimental data better.
1. Introduction
High-sulfur-content natural gas contains hydrogen sulfide, mercaptans, sulfoethers, and other sulfurous substances, with hydrogen sulfide gas comprising the majority of all sulfurous substances. There are many high-sulfur-content gas fields. For example, the hydrogen sulfide volume contents in natural gas mixtures are 15% to 18% in the Puguang Gas Field (China).1 High-sulfur-content natural gas fields supply not only clean energy, but also raw materials for sulfur series products.2 However, deposited elemental sulfur may cause pore formation, wellbore blockage, and even transmission pipeline blockage and corrosion with changes in pressure, temperature, and gas components.3–5 This can lead to the normal production of the gas field being severely inhibited.6–9 In recent years, the problem of sulfur deposition has received extensive attention. Notably, elemental sulfur solubility in high-sulfur-content natural gas is the key factor determining whether sulfur deposition occurs.10–12
Many researchers have measured the sulfur solubility in hydrogen sulfide (H2S), carbon dioxide (CO2), and methane (CH4), because high-H2S-content natural gas mainly comprises these three gas components. Kennedy and Wieland3 were the first to measure elemental sulfur solubility in pure H2S, CO2, CH4 and their mixtures in 1960. Their work showed that elemental sulfur solubility increases with increasing pressure and temperature. Roof found that the solubility in H2S first increases and then decreases with increasing temperature.13 Swift, Brunner, and Gu et al. extended the pressure and temperature range for sulfur solubility in H2S.14–16 Serin et al. developed an experimental apparatus for measuring elemental sulfur solubility in CO2.17 Using the same experimental apparatus, Cloarec et al.18 obtained experimental data of sulfur solubility in CH4.
The above experimental results of solubility in H2S, CO2, and CH4 provide the basis for establishing a solubility predicting model, and strongly support the development of high-sulfur-content natural gas fields.19–24 The binary interaction coefficients between sulfur and H2S, CO2, and CH4 in natural gas are important parameters when using a thermodynamic predicting model based on the equation of state (EoS). As shown in Table 1, Heidemann25 reported that the binary interaction coefficients between sulfur and H2S, CO2, or CH4 after regression of the experimental data were 0.0812, 0.135, and 0.155, respectively.25 In Sun's model,26 the binary interaction coefficients between sulfur and H2S, CO2, and CH4 are 0.0758, 0.190, and 0.115, respectively. However, Gu16 and Cézac et al.27 suggested that the binary interaction coefficients are related to the gas mixture temperature. Based on the experimental data of Roof, Brunner, and their own work, Gu16 reported binary interaction coefficients between sulfur and H2S, CO2, and CH4 of 316.3–374.8 K, 363.2 and 383.2 K, and 383.2 K, respectively. Cézac et al.27 proposed three equations for calculating the binary interaction coefficients between sulfur and H2S, CO2, and CH4 based on analysis of experimental data. The binary interaction coefficients from the above studies are considerably different, and it is unclear which set represents better experimental data.
Table 1 The binary interaction coefficient values
| Comp. |
Binary interaction coefficient kij |
Author |
| S8–H2S |
0.0812 |
Heidemann R. A.25 |
| 0.0758 |
Sun C. Y.26 |
| 0.093–2.079/T |
Cézac P.27 |
| 316.3 K |
338.7 K |
366.5 K |
374.8 K |
373.2 K |
363.2 K |
383.2 K |
Gu M. X.16 |
| 0.1111 |
0.1112 |
0.1042 |
0.1062 |
0.1038 |
0.1033 |
0.0892 |
| S8–CO2 |
0.135 |
Heidemann R. A.25 |
| 0.190 |
Sun C. Y.26 |
| 0.2423–21.44/T |
Cézac P.27 |
| 363.2 K |
383.2 K |
Gu M. X.16 |
| 0.2107 |
0.1993 |
| S8–CH4 |
0.155 |
Heidemann R. A.25 |
| 0.115 |
Sun C. Y.26 |
| 1.154–377/T |
Cézac P.27 |
| 0.1345 |
Gu M. X.16 |
This work aims to evaluate differences in the binary interaction coefficients between sulfur and H2S, CO2, and CH4. We investigated the relationships between the binary interaction coefficients and temperature to extend the range and improve the accuracy of predicting the sulfur solubility in H2S, CO2, and CH4 using a thermodynamic model based on the Peng–Robinson (PR) EoS. Based on experimental data analysis, new three-parameter temperature-dependent equations for calculating the binary interaction coefficients are proposed. The equation parameters are obtained by regression analysis of the experimental data. Furthermore, we compared the solubility results calculated using the thermodynamic model with the binary interaction coefficients reported by Heidemann, Sun, Cézac, Gu, and in this work.
2. Model description
2.1. Governing equations
The model is based on thermodynamic gas–solid phase equilibrium theory, which assumes perfect mixing of the sulfur and gas components. As mentioned by Gu, Sun, and Heidemann, solid sulfur should be treated as single molecule S8.16,25,26 The phase equilibrium condition of the gas–solid system requires the fugacity of gaseous sulfur to be the same as that of the solid phase, as expressed by eqn (1):28| |
 | (1) |
2.2. Solid phase fugacity
The solid sulfur fugacity is related to the saturation vapor pressure of solid sulfur, as expressed by eqn (2):28| |
 | (2) |
The sulfur saturation vapor pressure is always small in the gas–solid phase equilibrium system, so  = 1.0 in this model.28 Shuai and Meisen29 reported regression equations of the sulfur saturation vapor pressure at different temperatures.
When T < 368 K,  is expressed by eqn (3):
| |
 | (3) |
When T > 368 K,  is expressed by eqn (4):
| |
 | (4) |
| |
 | (5) |
Using eqn (2)–(5), we can calculate the fugacity of sulfur in solid phase.
2.3. Elemental sulfur fugacity in the gas phase
The elemental sulfur fugacity in the gas phase can be expressed with eqn (6):28| |
 | (6) |
2.3.1. Peng–Robinson (PR) EoS. According to eqn (6),  is the key parameter for calculating the gaseous sulfur fugacity, and can be described by the PR EoS. The basic form of the PR EoS is shown in eqn (7):30
| |
 | (7) |
where a and b are the parameters of PR EoS. When gas mixtures are single component, a and b can be expressed as follows:| |
 | (8) |
| |
 | (9) |
| | |
α = [1 + (1 − Tr0.5)(0.37464 + 1.54226ω − 0.26992ω2)]2
| (10) |
| |
 | (11) |
Table 2 shows the critical parameters and acentric factors of S8, H2S, CO2, and CH4.27,28
Table 2 Critical parameters and acentric factors
| Component |
Critical pressure (MPa) |
Critical temperature (K) |
Acentric factor |
| S8 |
5.2 |
1065.0 |
0.3805 |
| H2S |
8.963 |
373.5 |
0.094 |
| CO2 |
7.383 |
304.2 |
0.224 |
| CH4 |
4.599 |
190.6 |
0.012 |
After the solid and gas phase sulfur reach the equilibrium state, the gas phase is composed of a solvent gas component and gaseous sulfur. The a and b parameters need be calculated using the mixing rule according to the values of the single components. In this model, b is calculated by the classic mixing rule, as follows:
| |
 | (12) |
The a parameter of the gas mixture components will be discussed in detail in Section 3.
The fugacity coefficient of gaseous sulfur  can be expressed as:
| |
 | (13) |
where
| |
 | (14) |
Z is calculated using
| |
 | (15) |
Relevant parameters in eqn (15) are expressed by eqn (16)–(19):
| |
 | (16) |
| |
 | (17) |
| |
 | (18) |
| |
 | (19) |
In this work, this equation was solved using the Newton–Raphson method. The elemental sulfur solubilities in H2S, CO2, and CH4 can be calculated easily using eqn (1)–(19).
3. Proposed method
The classical mixing rule for a is:28| |
 | (20) |
where kij are the binary interaction coefficients between S8 and the gas solvents (H2S, CO2, and CH4). Eqn (20) shows that kij are important parameters.
The reported binary interaction coefficients between S8 and H2S, CO2, and CH4 obtained by regression of the sulfur solubility experimental data are shown in Table 1. The binary interaction coefficients reported by Sun and Heidemann are constant.25,26 However, as mentioned by Gu16 and Cézac,27 the binary interaction coefficients are temperature dependent. Therefore, we proposed a new mixing rule for a to calculate the gaseous S8 fugacity:
| |
 | (21) |
Therefore,
The kij values with temperature were regressed based on the experimental data of Kennedy, Roof, Brunner, Serin, and Gu,3,13,15–17 and the calculated diagram is shown in Fig. 1.
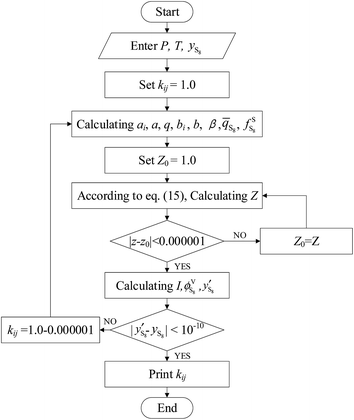 |
| | Fig. 1 Calculating diagram of kS8j. | |
According to Eslamimanesh's study of the consistency of the experimental results of sulfur solubility in H2S, only ∼45% of the values are reliable.20 To obtain an equation for the binary interaction coefficient between sulfur and H2S, we chose the 14 sets of experimental data at temperatures of 316.26, 338.71, and 363.15 K reported by Roof and Gu.13,16 Fig. 2 shows the binary interaction coefficient between S8 and H2S calculated at temperatures of 316.26–363.15 K. To better fit the kij value, we obtained the average kij values at the same temperatures shown in Fig. 3, and a new equation and fitting curve of kS8–H2S with temperature were obtained. The adjusted R2 value (Radj2) was 0.896, which showed that the fitting precision was high. The new equation for the binary interaction coefficient between S8 and H2S is:
| |
 | (23) |
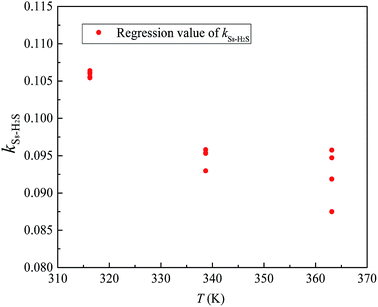 |
| | Fig. 2 The kij between S8 and H2S. | |
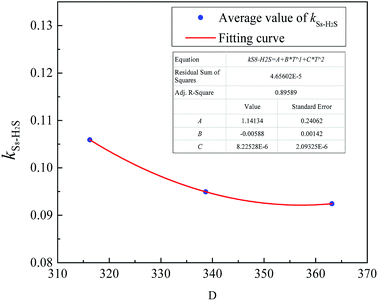 |
| | Fig. 3 The kij fitting curve between S8 and H2S. | |
Fig. 4 and 5 show the new equation and fitting curve for kS8–CO2 in the temperature range 333.15–394.26 K (Radj2 = 0.966). The new equation for the binary interaction coefficient between S8 and CO2 is:
| |
 | (24) |
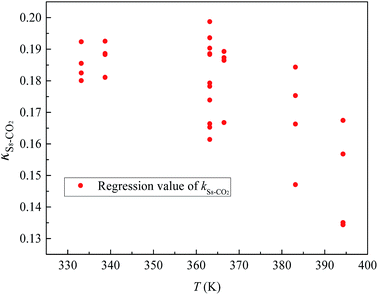 |
| | Fig. 4 The kij between S8 and CO2. | |
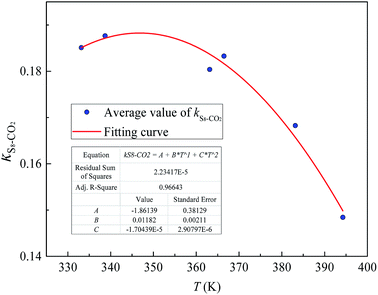 |
| | Fig. 5 The kij fitting curve between S8 and CO2. | |
Fig. 6 and 7 show the new equation and fitting curve for kS8–CH4 in the temperature range 338.71–394.26 K (Radj2 = 0.933). The new equation for the binary interaction coefficient between S8 and CH4 is:
| |
 | (25) |
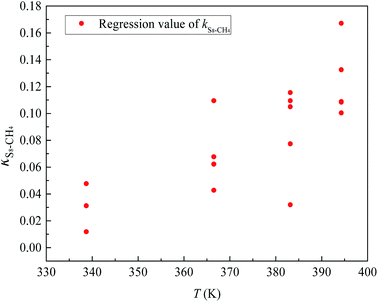 |
| | Fig. 6 The kij between S8 and CH4. | |
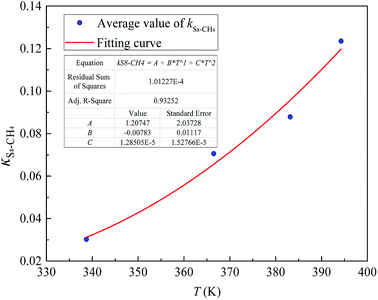 |
| | Fig. 7 The kij fitting curve between S8 and CH4. | |
4. Results and discussion
4.1. Predicting the sulfur solubility using the proposed binary interaction coefficients
The sulfur solubility in H2S predicted by the thermodynamic model using the proposed binary interaction coefficient between sulfur and H2S obtained by eqn (23) is shown in Table 5, along with the experimental results of Roof and Gu at temperatures of 316.26, 338.71, and 363.15 K and in the pressure range 7.03–32.03 MPa.13,16 Parameter a in this model was calculated with the proposed mixing rule (eqn (21)) and (23).
Table 3 Deviation comparisons of predicting solubility in CO2 with different kS8–CO2
| Deviation |
kS8–CO2 |
| Improved kS8–CO2 |
0.190 |
0.135 |
363.2 K |
383.2 K |
0.2423–21.44/T |
| 0.2107 |
0.1993 |
| ARE (%) |
1.69 |
−14.57 |
111.32 |
−34.20 |
−3.11 |
| AARE (%) |
13.12 |
16.38 |
111.36 |
34.20 |
18.22 |
Table 4 Deviation comparisons of predicting solubility in CH4 with different kS8–CH4
| Deviation |
kS8–CH4 |
| Improved kS8–CH4 |
0.115 |
0.155 |
383.2 K |
1.154–377/T |
| 0.1345 |
| ARE (%) |
4.34 |
−20.08 |
−40.70 |
−26.58 |
−33.04 |
| AARE (%) |
14.98 |
25.23 |
41.66 |
26.58 |
34.07 |
There are 14 sets of experimental data in Table 5. The RE, ARE, and AARE values were calculated using eqn (26)–(28):
| |
 | (26) |
| |
 | (27) |
| |
 | (28) |
Based on Table 5, the total ARE and AARE values for predicting the sulfur solubility were 6.30% and 7.90%, respectively.
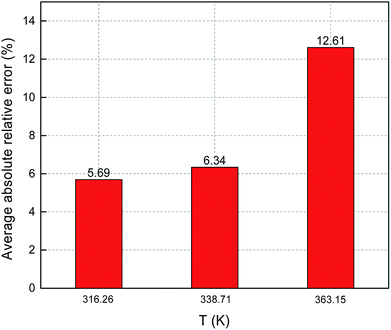
Fig. 8 and 9 show the ARE and AARE values of sulfur solubility in H2S calculated from the experimental data at three different temperatures (316.26, 338.71, and 363.15 K). Fig. 8 shows that the ARE values were positive at temperatures of 316.26, 338.71, and 363.15 K. The lowest ARE value was 5.69% at 316.26 K, with a highest ARE value of 7.64% at 363.15 K. Fig. 9 shows that the greatest AARE value was 12.61% at 363.15 K. The other AARE values were all below 7%. Considering the critical temperature of H2S (373.5 K), the large deviation at 363.15 K could be due to the kinetic characteristics of the solvent molecule (H2S) being influenced by external factors near the critical temperature and pressure.16
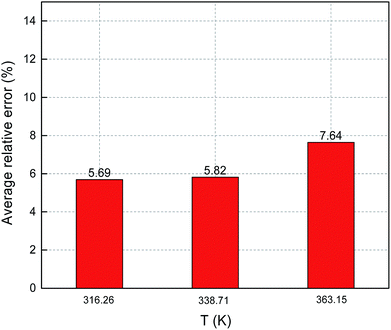 |
| | Fig. 8 ARE of sulfur solubility in H2S. | |
 |
| | Fig. 9 AARE of sulfur solubility in H2S. | |
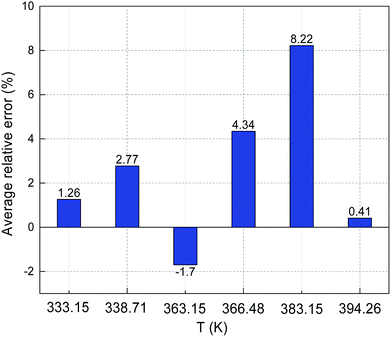
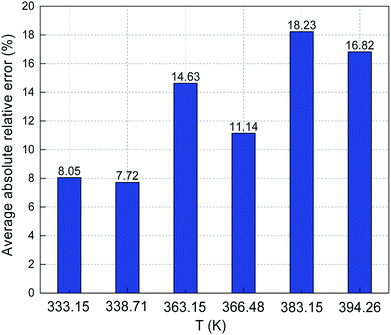
The predicted sulfur solubility in CO2 using the proposed binary interaction coefficient, along with the experimental data of Kennedy, Gu, and Serin, in the temperature range 333.15–394.26 K at pressures of 15.1–41.4 MPa are shown in Table 6.3,16,17 Parameter a with the proposed mixing rule (eqn (21)) was calculated using eqn (24). There were 32 sets of experimental data included in Table 6. Based on these calculated results, the total ARE and AARE values of the predicted sulfur solubility in CO2 were 1.69% and 13.12%, respectively. Fig. 10 and 11 show the ARE and AARE values of sulfur solubility in CO2 calculated using the experimental data for six temperature ranges from 333.15–394.26 K. The lowest ARE value was 0.41% at 394.26 K, and the highest ARE value was 8.22% at 383.15 K (Fig. 10). Fig. 11 shows that the highest AARE value was 18.23% at 383.15 K.
 |
| | Fig. 10 ARE of sulfur solubility in CO2. | |
 |
| | Fig. 11 AARE of sulfur solubility in CO2. | |
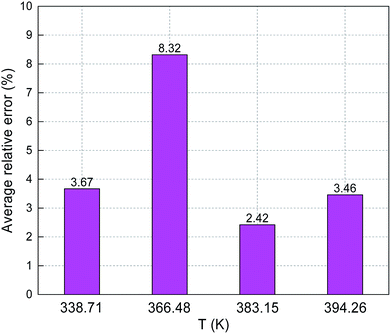
The predicted sulfur solubility in CH4 using the proposed binary interaction coefficient, along with the experimental data of Kennedy and Gu in the temperature range 338.71–394.26 K and pressures range 6.89–41.4 MPa, are shown in Table 7.3,16 Parameter a with the proposed mixing rule (eqn (21)) was calculated with eqn (25). There are 17 sets of experimental data in Table 7. Based on the calculated results in Table 7, the total ARE and AARE values calculated with eqn (27) and (28) were 4.34% and 14.98%, respectively. Fig. 12 and 13 show the ARE and AARE values of sulfur solubility in CH4 calculated using the experimental data for four temperatures in the range 338.71–394.26 K. Fig. 12 shows that the lowest ARE value was 2.42% at 383.15, while the highest ARE value was 8.32% at 366.48 K. The highest AARE value was 17.53% at 383.15 K (Fig. 13). Combined with the results of the calculated sulfur solubilities in CO2 and CH4, the main reason for the large deviation could be that the solubility values in CO2 and CH4 are too small.
 |
| | Fig. 12 ARE of sulfur solubility in CH4. | |
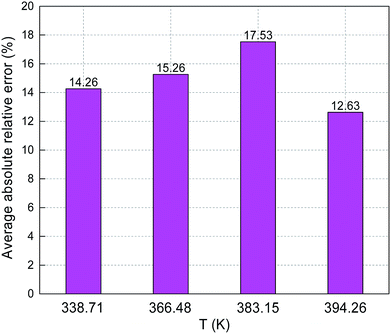 |
| | Fig. 13 AARE of sulfur solubility in CH4. | |
4.2. Comparison of binary interaction coefficients
4.2.1. Comparison of sulfur solubility in H2S with different kS8–H2S. As mentioned above, Sun and Heidemann suggested that kS8–H2S is temperature independent.15,16 However, Gu and Cézac et al. suggested that kS8–H2S is temperature dependent.16,27 Gu determined kS8–H2S values at different temperatures from 316.3 to 383.2 K based on experimental data, and Cézac proposed a temperature-dependent kS8–H2S equation.16,27 Here, we compared the sulfur solubilities predicted using these different kS8–H2S values with our proposed kS8–H2S model (eqn (23)). Fig. 14 shows that the accuracy of the predicted sulfur solubility in H2S with the proposed kS8–H2S was significantly higher than those of the other four kS8–H2S values. At 316.26 K, the value proposed by Gu was more reasonable than the three other values. The deviation in the solubility calculated with the thermodynamic model and the experimental data was relatively large using the values reported by Sun, Heidemann, and Cézac. The three values also showed that the predicted solubility was closely related to the binary interaction coefficient between sulfur and H2S. Furthermore, for the sulfur solubility in H2S, the model with the proposed kS8–H2S applied to temperatures ranging from 316.26 to 363.15 K and pressures ranging from 7.03 to 32.03 MPa.
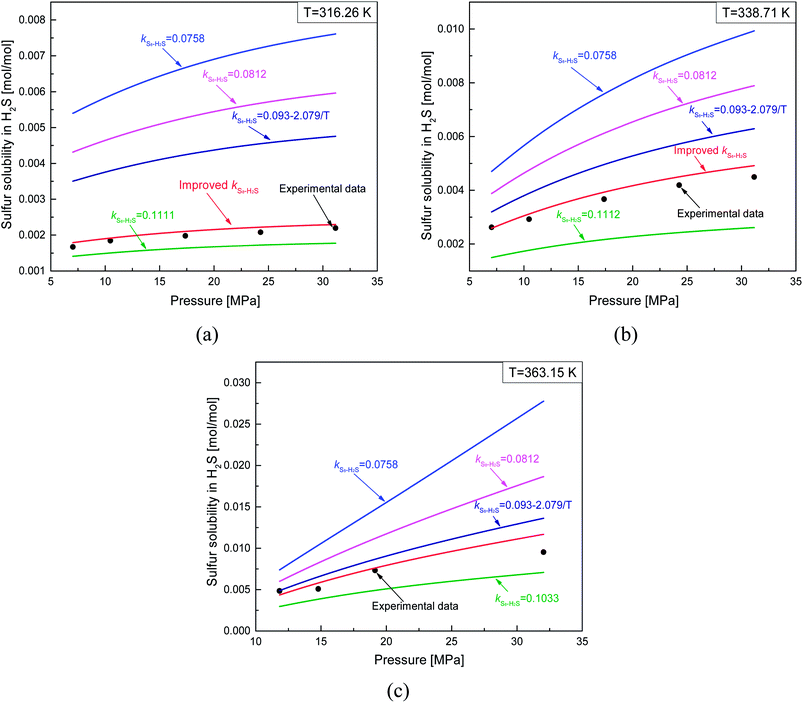 |
| | Fig. 14 Comparisons of predicting sulfur solubility in H2S with different kS8–H2S. | |
4.2.2. Comparison of sulfur solubility in CO2 with different kS8–CO2. Fig. 15 shows a comparison of the sulfur solubility in CO2 calculated using the thermodynamic model with five different kS8–CO2 values at temperatures ranging from 333.15 to 394.26 K. When kS8–CO2 was 0.135, the difference between the calculated sulfur solubility and the experimental data was the largest at 383.15 K. Based on Fig. 15, the accuracy of the predicted sulfur solubility seemed to be acceptable using all of the other four kS8–CO2 values except 0.135.
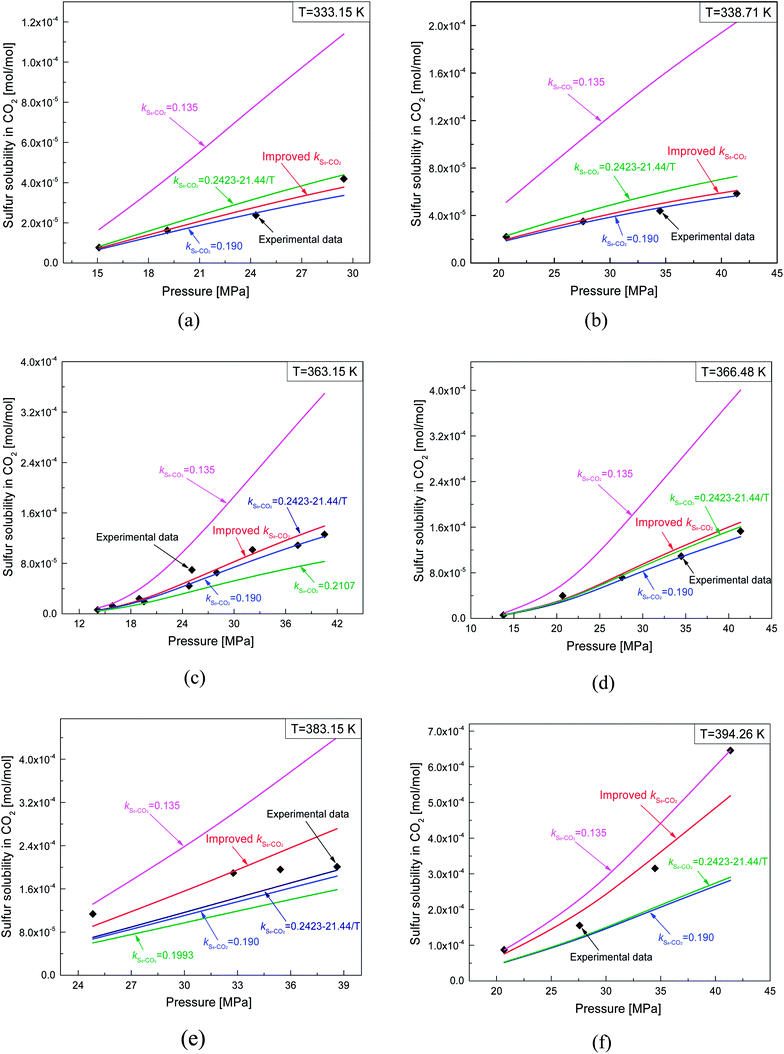 |
| | Fig. 15 Comparisons of predicting sulfur solubility in CO2 with different kS8–CO2. | |
As shown in Table 1, the kS8–CO2 values obtained by Sun and Heidemann were 0.190 and 0.135.25,26 Gu et al.16 related the kS8–CO2 parameter to the temperature, and reported kS8–CO2 values of 0.2107 and 0.1993 at 363.2 and 383.2 K.16 Cézac27 suggested that kS8–CO2 was temperature dependent and proposed an equation for calculating kS8–CO2, as shown in Table 1. A comparison of the total ARE and AARE values of the calculated sulfur solubility in CO2 with different kS8–CO2 values is shown in Table 3. From Table 3, the deviations of the solubility values calculated using the proposed kS8–CO2 from the experimental data were smaller than those using the other four kS8–CO2 values.
A comparison of the ARE and AARE values for different kS8–CO2 at temperatures of 333.15 to 394.26 K is shown in Fig. 16. Fig. 16(a) shows that ARE is the closest to 0% with the proposed kS8–CO2, ARE < 0 when kS8–CO2 is 0.190, and ARE is both negative and positive for the kS8–CO2 reported by Cézac.27 Using the kS8–CO2 and kS8–CO2 values reported by Cézac,27 the ARE values were −1.67% and −1.57% at 363.15 K, and 4.34% and 0.55% at 366.48 K, respectively.
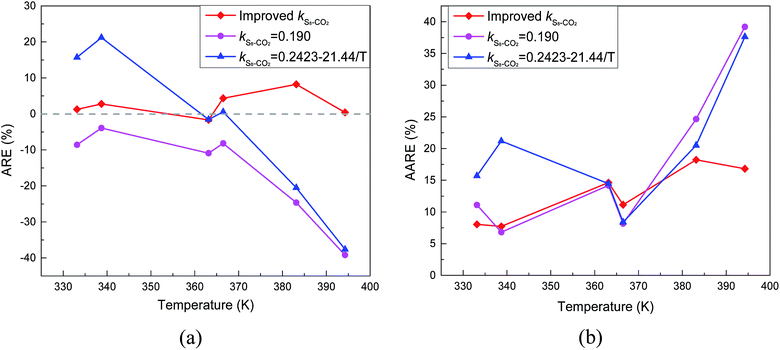 |
| | Fig. 16 The deviation of predicting solubility in CO2 with different kS8–CO2. | |
As shown Fig. 16(b), the AARE values were smaller using the proposed kS8–CO2 than using the other two kS8–CO2 values. At 338.71 K, the AARE values were 7.72% and 6.82% using the proposed kS8–CO2 and kS8–CO2 = 0.190, respectively. Using the proposed kS8–CO2, the kS8–CO2 reported by Sun, and the kS8–CO2 reported by Cézac, the AARE values were 14.63%, 14.18%, and 14.64% at 363.15 K, and 11.14%, 8.18%, and 8.40% at 366.48 K, respectively. Fig. 16 shows that the accuracy of the predicted solubility using kS8–CO2 reported by Cézac was higher than that using the kS8–CO2 proposed in this paper at 363.15 and 366.48 K. However, the total deviation was still the lowest using the proposed binary interaction coefficient between sulfur and CO2 (Table 6 and Fig. 16).
4.2.3. Comparison of sulfur solubility in CH4 with different kS8–CH4. As shown in Table 1, the kS8–CH4 values reported by Heidemann and Sun are 0.155 and 0.115, respectively.25,26 Gu et al. related kS8–CH4 to temperature, but only reported the kS8–CH4 value at 383.2 K.16 Cézac et al.27 proposed a temperature-dependent equation for calculating kS8–CH4 (Table 1). The total ARE and AARE values of the calculated sulfur solubility in CH4 using the different values of kS8–CH4 are shown in Table 4. The lowest ARE and AARE values of 4.34% and 14.98% were obtained using the proposed kS8–CH4. When kS8–CH4 = 0.155, the deviations between the calculated solubility values and the experimental data were the largest. From Table 4, the deviations between the solubility values calculated using the proposed kS8–CH4 and the experimental data were smaller than those using the other four kS8–CH4.Fig. 17 shows a comparison of the predicted sulfur solubility in CH4 using the thermodynamic model with five different kS8–CH4 at temperatures ranging from 338.71 to 394.26 K. Fig. 17(c) shows the calculated sulfur solubility in CH4 with five different kS8–CH4 at 383.15 K, because kS8–CH4 = 0.1345 reported by Gu was only suitable at 383.2 K. Therefore, Fig. 17(a), (b), and (d) only show the predicted solubility with four different kS8–CH4.
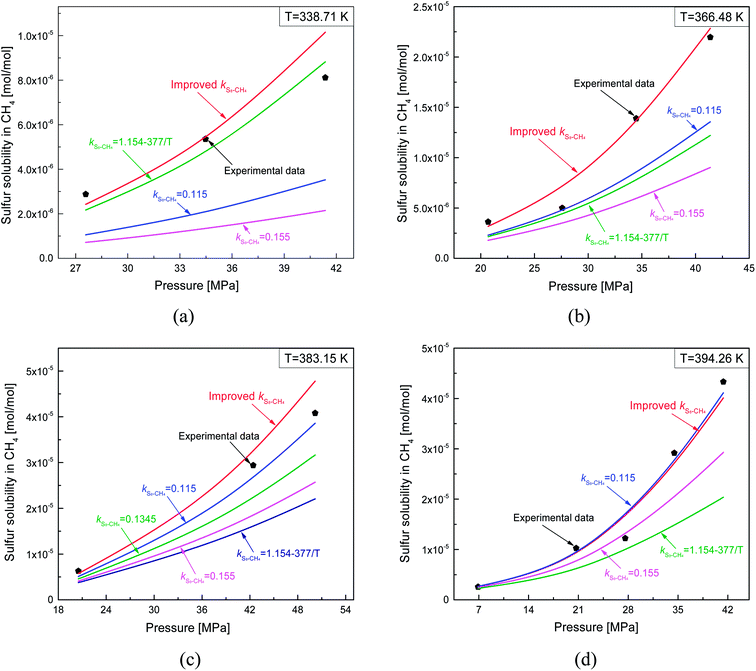 |
| | Fig. 17 Comparisons of predicting sulfur solubility in CH4 with different kS8–CH4. | |
As shown in Fig. 17, the predicted solubility values were negative, except for that calculated using the proposed kS8–CH4. When kS8–CH4 = 0.115 at 394.26 K, the calculated solubility in CH4 was close to the experimental data (Fig. 17(d)). Using kS8–CH4 = 0.115 and the proposed kS8–CH4, the ARE values were 5.25% and 3.46%, while the AARE values were 12.11% and 12.63%, respectively. This indicated that the predicted solubility at 394.26 K using the kS8–CH4 value reported by Sun was also acceptable.26
5. Conclusions
We have proposed new three-parameter equations to calculate the binary interaction coefficients between sulfur and H2S, CO2, and CH4. The parameters in these three equations were obtained by regression of the experimental sulfur solubility data in H2S, CO2, and CH4. The relationship between the binary interaction coefficients and temperature was quadratic. The binary interaction coefficients kS8–H2S, kS8–CO2, and kS8–CH4 were expressed by eqn (23)–(25), and the Radj2 values of the new fitting equations were 0.896, 0.966, and 0.933, respectively, which indicated that the new three-parameter equations were reliable.
By comparing the experimental solubility data with the solubility results predicted using the binary interaction coefficients proposed by this work and those reported by Sun, Heidemann, Gu, and Cézac, the total ARE and AARE values were significantly smaller when using the proposed binary interaction coefficients than those when using the other four. However, the accuracy of the predicted sulfur solubility in CO2 using kS8–CO2 reported by Cézac was slightly higher than that using kS8–CO2 proposed in this article at temperatures of 363.15 and 366.48 K. Furthermore, the calculated solubility in CH4 using kS8–CH4 reported by Sun was acceptable.
In general, the predicted results were satisfactory considering the ARE and AARE values obtained using the proposed binary interaction coefficients. The accuracies of the predicted sulfur solubilities in H2S, CO2, and CH4 using the thermodynamic model with the proposed binary interaction coefficients based on the PR EoS were greatly improved, and the thermodynamic model was suitable for a wide range of temperatures and pressures.
Conflicts of interest
There are no conflicts to declare.
Appendix
Table 5 Elemental sulfur solubility in H2S
| T/K |
P/MPa |
Solubility (experiment)/mol mol−1 |
Solubility (this model)/mol mol−1 |
Relative error |
| 316.26 |
7.03 |
0.001669 |
0.001790 |
0.0722 |
| 10.48 |
0.001846 |
0.001915 |
0.0373 |
| 17.37 |
0.001977 |
0.002099 |
0.0619 |
| 24.27 |
0.002078 |
0.002220 |
0.0682 |
| 31.16 |
0.002196 |
0.002294 |
0.0448 |
| 338.71 |
7.03 |
0.00262 |
0.002586 |
−0.0129 |
| 10.48 |
0.002926 |
0.003120 |
0.0662 |
| 17.37 |
0.00367 |
0.003927 |
0.0701 |
| 24.27 |
0.004189 |
0.004502 |
0.0747 |
| 31.16 |
0.004494 |
0.004913 |
0.0932 |
| 363.15 |
11.83 |
0.004832 |
0.004352 |
−0.0993 |
| 14.79 |
0.005081 |
0.005789 |
0.1393 |
| 19.14 |
0.007313 |
0.007613 |
0.0410 |
| 32.03 |
0.009523 |
0.011664 |
0.2248 |
Table 6 Elemental sulfur solubility in CO2
| T/K |
P/MPa |
Solubility (experiment)/mol mol−1 |
Solubility (this model)/mol mol−1 |
Relative error |
| 333.15 |
15.10 |
7.682 × 10⁻⁶ |
7.400 × 10⁻⁶ |
−0.0368 |
| 19.10 |
1.624 × 10⁻⁵ |
1.650 × 10⁻⁵ |
0.0144 |
| 24.31 |
2.377 × 10⁻⁵ |
2.790 × 10⁻⁵ |
0.1718 |
| 29.47 |
4.193 × 10⁻⁵ |
3.780 × 10⁻⁵ |
−0.0991 |
| 338.71 |
20.68 |
2.205 × 10⁻⁵ |
1.990 × 10⁻⁵ |
−0.0991 |
| 27.58 |
3.504 × 10⁻⁵ |
3.610 × 10⁻⁵ |
0.0316 |
| 34.47 |
4.395 × 10⁻⁵ |
4.990 × 10⁻⁵ |
0.1351 |
| 41.37 |
5.851 × 10⁻⁵ |
6.100 × 10⁻⁵ |
0.0431 |
| 363.15 |
15.86 |
1.252 × 10⁻⁵ |
9.960 × 10⁻⁶ |
−0.2044 |
| 19.53 |
1.961 × 10⁻⁵ |
2.390 × 10⁻⁵ |
0.2174 |
| 24.76 |
4.439 × 10⁻⁵ |
5.190 × 10⁻⁵ |
0.1684 |
| 27.99 |
6.528 × 10⁻⁵ |
7.080 × 10⁻⁵ |
0.0845 |
| 14.14 |
6.200 × 10⁻⁶ |
5.920 × 10⁻⁶ |
−0.0455 |
| 18.97 |
2.400 × 10⁻⁵ |
2.130 × 10⁻⁵ |
−0.1109 |
| 25.10 |
6.970 × 10⁻⁵ |
5.380 × 10⁻⁵ |
−0.2276 |
| 25.10 |
7.090 × 10⁻⁵ |
5.380 × 10⁻⁵ |
−0.2407 |
| 32.14 |
1.017 × 10⁻⁴ |
9.490 × 10⁻⁵ |
−0.0673 |
| 37.41 |
1.087 × 10⁻⁴ |
1.236 × 10⁻⁴ |
0.1374 |
| 40.52 |
1.260 × 10⁻⁴ |
1.392 × 10⁻⁴ |
0.1051 |
| 366.48 |
13.79 |
5.805 × 10⁻⁶ |
6.110 × 10⁻⁶ |
0.0529 |
| 20.68 |
3.966 × 10⁻⁵ |
3.290 × 10⁻⁵ |
−0.1700 |
| 27.58 |
7.193 × 10⁻⁵ |
7.800 × 10⁻⁵ |
0.0843 |
| 34.47 |
1.091 × 10⁻⁴ |
1.253 × 10⁻⁴ |
0.1487 |
| 41.37 |
1.530 × 10⁻⁴ |
1.685 × 10⁻⁴ |
0.1012 |
| 383.15 |
24.83 |
1.135 × 10⁻⁴ |
9.080 × 10⁻⁵ |
−0.2001 |
| 32.76 |
1.894 × 10⁻⁴ |
1.921 × 10⁻⁴ |
0.0142 |
| 35.41 |
1.960 × 10⁻⁴ |
2.281 × 10⁻⁴ |
0.1640 |
| 38.62 |
2.009 × 10⁻⁴ |
2.714 × 10⁻⁴ |
0.3509 |
| 394.26 |
20.68 |
8.716 × 10⁻⁵ |
7.570 × 10⁻⁵ |
−0.1317 |
| 27.58 |
1.554 × 10⁻⁴ |
1.924 × 10⁻⁴ |
0.2382 |
| 34.47 |
3.153 × 10⁻⁴ |
3.489 × 10⁻⁴ |
0.1064 |
| 41.37 |
6.457 × 10⁻⁴ |
5.188 × 10⁻⁴ |
−0.1966 |
Table 7 Elemental sulfur solubility in CH4
| T/K |
P/MPa |
Solubility (experiment)/mol mol−1 |
Solubility (this model)/mol mol−1 |
Relative error |
| 338.71 |
27.5792 |
2.882 × 10⁻⁶ |
2.420 × 10⁻⁶ |
−0.1588 |
| 34.474 |
5.357 × 10⁻⁶ |
5.450 × 10⁻⁶ |
0.0178 |
| 41.3688 |
8.113 × 10⁻⁶ |
1.020 × 10⁻⁵ |
0.2511 |
| 366.48 |
20.6844 |
3.623 × 10⁻⁶ |
3.170 × 10⁻⁶ |
−0.1241 |
| 27.5792 |
5.008 × 10⁻⁶ |
7.170 × 10⁻⁶ |
0.4316 |
| 34.474 |
1.389 × 10⁻⁵ |
1.370 × 10⁻⁵ |
−0.0146 |
| 41.3688 |
2.196 × 10⁻⁵ |
2.280 × 10⁻⁵ |
0.0400 |
| 383.15 |
20.517 |
8.100 × 10⁻⁶ |
5.750 × 10⁻⁶ |
−0.2903 |
| 20.517 |
6.300 × 10⁻⁶ |
5.750 × 10⁻⁶ |
−0.0875 |
| 42.414 |
2.940 × 10⁻⁵ |
3.260 × 10⁻⁵ |
0.1077 |
| 42.414 |
2.670 × 10⁻⁵ |
3.260 × 10⁻⁵ |
0.2197 |
| 50.172 |
4.080 × 10⁻⁵ |
4.780 × 10⁻⁵ |
0.1711 |
| 394.26 |
6.8948 |
2.588 × 10⁻⁶ |
2.660 × 10⁻⁶ |
0.0282 |
| 20.6844 |
1.027 × 10⁻⁵ |
9.380 × 10⁻⁶ |
−0.0861 |
| 27.5792 |
1.223 × 10⁻⁵ |
1.680 × 10⁻⁵ |
0.3742 |
| 34.474 |
2.918 × 10⁻⁵ |
2.720 × 10⁻⁵ |
−0.0695 |
| 41.3688 |
4.331 × 10⁻⁵ |
4.010 × 10⁻⁵ |
−0.0737 |
Nomenclature
Abbreviations
| EoS | Equation of state |
| RE | Relative error |
| ARE | Average relative error |
| AARE | Absolute average relative error |
Roman symbols
 | Fugacity of the pure solid specie S8 [Pa] |
 | Fugacity of sulfur in vapor phase [Pa] |
| P | Absolute pressure [Pa] |
| T | Temperature [K] |
| y | Sulfur solubility in gas [mol mol−1] |
 | Fugacity factor of sulfur saturation vapor |
| R | Gas constant [8.314 J (mol−1 K−1)] |
 | Sulfur saturation vapor pressure at temperature T [Pa] |
 | Molar volume of solid sulfur [m3 mol−1] |
| yS8 | Mole fraction of gaseous sulfur |
 | Fugacity coefficient of gaseous sulfur |
| V | Specific volume [m3 mol−1] |
| Tc | Critical temperature [K] |
| Pc | Critical pressure [Pa] |
| ω | Acentric factor |
| Tr | Reduced temperature |
| Z | Gas mixtures compressibility factor |
| n | Number of gas component |
| yi | Mole fraction in gas mixtures of component i |
| yj | Mole fraction in gas mixtures of component j |
| kij | Binary interaction coefficients between component i and component j |
| Zpredi | Predicting sulfur solubility with model |
| Zexpi | Sulfur solubility from experiment |
| kS8–H2S | Binary interaction coefficient between S8 and H2S |
| kS8–CO2 | Binary interaction coefficient between S8 and CO2 |
| kS8–CH4 | Binary interaction coefficient between S8 and CH4 |
Subscripts and superscripts
| i, j | Species index |
| S | Solid sulfur |
| V | Vapor |
| sat | Saturation |
| r | Reduced state |
| c | Critical state |
| pre | Predicting results |
| exp | Experimental data |
Acknowledgements
This study was financially supported by the National Natural Science Foundation of China (No. 51674213, 51504206, 1604233 and 51474184).
References
- S. Li, F. Yang and F. Liu, A discussion on the sulphur deposition in the ground surface gathering and transmission system of the Puguang Gas Field, Nat. Gas Ind., 2011, 31, 74–79 Search PubMed.
- G. Zhu, S. Zhang, J. Li and Q. Jin, Formation and distribution of hydrogen sulfide bearing gas in China, Petroleum Exploration and Development, 2004, 31, 18–21 CAS.
- H. Kennedy and D. Wieland, Equilibrium in the Methane-carbon Dioxide-hydrogen Sulfide-sulfur System, Petrol. Trans. AIME, 1960, 219, 166–169 CAS.
- B. Roberts, The Effect of Sulfur Deposition on Gas Well Inflow Performance, SPE Reservoir Eng., 1997, 12, 118–123 CrossRef CAS.
- J. David, Elemental Sulphur Formation in Natural Gas Transmission Pipelines, The University of Western Australia, , Perth 2005 Search PubMed.
- J. Santos, A. Lobato, C. Moraes, A. Cunha, G. Silva and L. Santos, Comparison of different processes for preventing deposition of elemental sulfur in natural gas pipelines: A review, J. Nat. Gas Sci. Eng., 2016, 32, 364–372 CrossRef.
- J. Hu, Z. Lei, Z. Chen and Z. Ma, Effect of sulphur deposition on well performance in a sour gas reservoir, Can. J. Chem. Eng., 2017, 1–9 Search PubMed.
- X. Guo, P. Wang, J. Liu, G. Song, H. Dang and T. Gao, Gas-well water breakthrough time prediction model for high-sulfur gas reservoirs considering sulfur deposition, J. Pet. Sci. Eng., 2017, 157, 999–1006 CrossRef.
- C. Andre and J. David, S8 threatens natural gas operations, environment, Oil Gas J., 1997, 95, 74–79 Search PubMed.
- X. Guo and Q. Wang, A new prediction model of elemental sulfur solubility in sour gas mixtures, J. Nat. Gas Sci. Eng., 2016, 31, 1875–5100 Search PubMed.
- J. Hu, J. Zhao, L. Wang and L. Meng, Prediction model of elemental sulfur solubility in sour gas mixtures, J. Nat. Gas Sci. Eng., 2014, 18, 31–38 CrossRef CAS.
- J. Mao, X. Yang and D. Wang, Optimization of effective sulfur solvents for sour gas reservoir, J. Nat. Gas Sci. Eng., 2016, 36, 463–471 CrossRef CAS.
- J. Roof, Solubility of Sulfur in Hydrogen Sulfide and in Carbon Disulfide at Elevated Temperature and Pressure, SPEJ, Soc. Pet. Eng. J., 1971, 11, 272–276 CrossRef CAS.
- S. Swift, F. Manning and R. Thompson, Sulfur-bearing Capacity of Hydrogen Sulfide Gas, SPEJ, Soc. Pet. Eng. J., 1976, 16, 57–64 CrossRef CAS.
- E. Brunner and W. Woll, Solubility of Sulfur in Hydrogen Sulfide and Sour Gases, SPEJ, Soc. Pet. Eng. J., 1980, 20, 377–384 CrossRef CAS.
- M. Gu, Q. Li, S. Zhou, W. Chen and T. Guo, Experimental and Modeling Studies on the Phase Behavior of High H2S-content Natural Gas Mixtures, Fluid Phase Equilib., 1993, 82, 173–182 CrossRef CAS.
- J. Serin, S. Jay, P. Cézac, F. Contamine, J. Mercadier, C. Arrabie and J. Legros-Adrian, Experimental Studies of Solubility of Elemental Sulphur in Supercritical Carbon Dioxide, J. Supercrit. Fluids, 2010, 53, 12–16 CrossRef CAS.
- E. Cloarec, J. Serin, P. Cézac, F. Contamine, J. Mercadier, A. Louvat, A. Lopez, P. Caneghem, R. Forster and U. Kim, Experimental Studies of Solubility of Elemental Sulfur in Methane at 363.15 K for Pressure Ranging From (4 to 25) MPa, J. Chem. Eng. Data, 2012, 57, 1222–1225 CrossRef CAS.
- K. Karan, R. Heidemann and L. Behie, Sulfur Solubility in Sour Gas: Predictions with an Equation of State Model, Ind. Eng. Chem. Res., 1998, 37, 1679–1684 CrossRef CAS.
- A. Eslamimanesh, A. Mohammadi and D. Richon, Thermodynamic Consistency Test for Experimental Data of Sulfur Content of Hydrogen Sulfide, Ind. Eng. Chem. Res., 2011, 50, 3555–3563 CrossRef CAS.
- A. Eslamimanesh, A. Mohammadi and D. Richon, Determination of Sulfur Content of Various Gases Using Chrastil-Type Equations, Ind. Eng. Chem. Res., 2011, 50, 7682–7687 CrossRef CAS.
- A. Mohammadi and D. Richon, Estimating Sulfur Content of Hydrogen Sulfide at Elevated Temperatures and Pressures Using an Artificial Neural Network Algorithm, Ind. Eng. Chem. Res., 2008, 47, 8499–8504 CrossRef CAS.
- M. Mehrpooya, A. Mohammadi and D. Richon, Extension of an Artificial Neural Network Algorithm for Estimating Sulfur Content of Sour Gases at Elevated Temperatures and Pressures, Ind. Eng. Chem. Res., 2009, 49, 439–442 CrossRef.
- B. Zarenezhad and A. Aminian, Predicting the Sulfur Precipitation Phenomena During the Production of Sour Natural Gas by Using an Artificial Neural Network, Pet. Sci. Technol., 2011, 29, 401–410 CrossRef CAS.
- R. Heidemann, A. Phoenix, K. Karan and L. Behie, A Chemical Equilibrium Equation of State Model for Elemental Sulfur and Sulfur-containing Fluids, Ind. Eng. Chem. Res., 2001, 40, 2160–2167 CrossRef CAS.
- C. Sun and G. Chen, Experimental and Modeling Studies on Sulfur Solubility in Sour Gas, Fluid Phase Equilib., 2003, 214, 187–195 CrossRef CAS.
- P. Cézac, J. Serin, J. Mercadier and G. Mouton, Modelling Solubility of Solid Sulphur in Natural Gas, Chem. Eng. J., 2007, 133, 283–291 CrossRef.
- J. Smith, H. Van ness and M. Abbott, Introduction to chemical engineering thermodynamics, The McGraw-Hill Companies, 7th edn, 2005 Search PubMed.
- X. Shuai and A. Meisen, New correlations predict physical properties of elemental sulfur, Oil Gas J., 1995, 93, 50–55 Search PubMed.
- D. Peng and D. Robinson, A New Two-Constant Equation of State, Ind. Eng. Chem. Fundam., 1976, 15, 59–64 CAS.
|
| This journal is © The Royal Society of Chemistry 2018 |
 Open Access Article
 *a and
Yang Pengb


 = 1.0 in this model.28 Shuai and Meisen29 reported regression equations of the sulfur saturation vapor pressure at different temperatures.
 is expressed by eqn (3):
 is expressed by eqn (4):


 is the key parameter for calculating the gaseous sulfur fugacity, and can be described by the PR EoS. The basic form of the PR EoS is shown in eqn (7):30


 can be expressed as:


