Adsorption of diclofenac on a magnetic adsorbent based on maghemite: experimental and theoretical studies†
V. O.
Leone
a,
M. C.
Pereira
 b,
S. F.
Aquino
a,
L. C. A.
Oliveira
c,
S.
Correa
d,
T. C.
Ramalho
d,
L. V. A.
Gurgel
 a and
A. C.
Silva
 *a
*a
aDepartamento de Química, Instituto de Ciências Exatas e Biológicas, Universidade Federal de Ouro Preto, 35400-000 Ouro Preto, Minas Gerais, Brazil. E-mail: adilsonqui@iceb.ufop.br; adilsonufla@gmail.com; Tel: +55 31 3559 1934
bInstituto de Ciência, Engenharia e Tecnologia, Universidade Federal dos Vales do Jequitinhonha e Mucuri, 39803-371 Teófilo Otoni, Minas Gerais, Brazil
cDepartamento de Química, Universidade Federal de Minas Gerais, 31270-090 Belo Horizonte, Minas Gerais, Brazil
dDepartamento de Química, Universidade Federal de Lavras, 37200-000 Lavras, Minas Gerais, Brazil
First published on 23rd November 2017
Abstract
In the present study, a magnetic adsorbent for diclofenac formed by maghemite (γ-Fe2O3) nanoparticles with high saturation magnetization (19.8 emu g−1) and specific area (79 m2 g−1) was synthesized by a one-pot method through the precipitation of Fe2+ ions with NaOH solution followed by rapid oxidation with hydrogen peroxide. The X-ray diffraction and Mössbauer spectroscopy data confirmed that the adsorbent is formed solely by maghemite. The adsorption equilibrium time for diclofenac (C0 = 500 mg L−1) was reached after 120 min, and the kinetic data were best fitted to the pseudo-first-order model. The adsorption isotherms acquired at five different temperatures showed an increase in the maximum adsorption capacity (261 mg g−1) until 298 K, but at higher temperatures, the maximum adsorption capacity was not increased. The isotherm data were best fitted to the Langmuir and Sips models. Adsorption tests as a function of solution pH showed a decrease in the diclofenac adsorption capacity with increasing solution pH, suggesting that the hydroxyl anions compete with diclofenac molecules for the adsorption sites. Diclofenac adsorption on maghemite was endothermic (67.31 kJ mol−1) and entropically driven (TΔadsS° = 96.33 kJ mol−1). Finally, theoretical calculations and infrared spectroscopy data suggest a physisorption mechanism of diclofenac on the maghemite surface.
Introduction
Among the various toxic organic compounds known, contaminants of emerging concern, such as pharmaceuticals and personal care products (PPCPs), have been widely studied by different research groups in recent years.1,2 The increasing number of PPCPs in the environment has drawn the attention of governmental and non-governmental organizations worldwide due to their impact. Indeed, some international agencies have listed some pharmaceuticals and endocrine-disrupting compounds (EDCs) as priority substances or placed them on the list of potential candidates to be considered as priority substances. In the European Union, some drugs such as the contrast medium amidotrizoate, the antiepileptic carbamazepine, the fungicide clotrimazole and the anti-inflammatory diclofenac (DCF) were included in the list of compounds to be considered as priority substances, even though the approved Directive 2008/105/EC3 did not consider them as such. Recently, the Directive 2013/39/EU of the European Parliament and the Council has decided that DCF shall be included in the first watch list, to gather monitoring data to facilitate the determination of appropriate measures to address the risk posed by this substance. If approved, the provisional guideline for DCF in surface waters would be 100 ng L−1.Nevertheless, due to their chemical resistance and xenobiotic nature, it is necessary to develop useful technology for removing those compounds from contaminated wastewater1,4 so that their impacts on aquatic life are minimized, thereby abiding to increasingly stricter legislation. For instance, the Resolution 430/2011 of the Brazilian Environmental Council (CONAMA) states that the discharge of effluents should not cause toxic effects to aquatic organisms in the receiving body, according to the ecotoxicity criteria established by the environmental agency.
A pharmaceutical that has been found in raw and treated sewage, as well as surface waters, is the nonsteroidal anti-inflammatory DCF, which is widely used for relief of pain and inflammation, especially in specific cases such as rheumatoid arthritis, osteoarthritis, tendonitis and postoperative pain.5 Another study showed the occurrence of three pharmaceuticals (carbamazepine, clofibric acid, and diclofenac) in treated wastewaters in four European countries and evaluated their environmental impacts toward bacteria, algae, invertebrates, and fish.6 The results demonstrated that all tested pharmaceuticals were detected and quantified in most of the effluents analyzed.6,7 Diclofenac induces oxidative stress on Hyalella azteca, and the set of tests used in this study (lipid peroxidation, protein carbonyl content and antioxidant enzyme activities) is considered as an adequate early damage biomarker for use in evaluating the toxicity of that pharmaceutical group in aquatic species.7
Various technologies have been tested for the removal of pharmaceuticals from contaminated water. Among these, the adsorption process deserves to be highlighted since it can be more easily coupled to existing water treatment plants that employ the conventional water treatment process (coagulation, flocculation, clarification, and disinfection). In the adsorption process, the pollutant is removed from a liquid phase to the surface of an adsorbent material, and among the studied materials used to adsorb diclofenac, one should highlight porous adsorbents such as activated carbon, alumina, zeolite, silica, and iron-based materials.8–11
Carbon-based materials are the most widely used adsorbents for DCF in water due to their high hydrophobicity and high surface area.12–14 However, the carbon-based material powders tend to mix with the suspended solids in real wastewater, making it difficult to separate them and impossible to reuse particulate carbon-based adsorbents. On the other hand, maghemite is attractive to be used as an adsorbent because of its high saturation magnetization,15 which facilitates its separation from the adsorption medium through the application of a magnetic field for further use. Also, the abundance of iron in the environment contributes to its low-cost preparation compared to carbon materials such as carbon nanotubes and graphene.16–18
Maghemite is usually prepared in two steps: in the first step, magnetite is synthesized by the chemical co-precipitation of ferrous and ferric ions in an alkali solution, and in the second step, magnetite is oxidized at 200–400 °C to form maghemite.15 Alternatively, different methods have been reported for the synthesis of maghemite nanoparticles such as hydrothermal,19 solvothermal,20 microemulsion,21 and thermal conversion.22 However, these methods of synthesis have some inconvenience for large-scale preparation such as pH control, the use of surfactants, long-time reactions, and high-temperature reactions.
Herein, we present a simple, one-step, fast, room temperature, and clean method for the synthesis of maghemite nanoparticles and their use as an adsorbent for diclofenac, an emerging pollutant of water bodies. A detailed characterization of maghemite was carried out by different techniques. Kinetic and equilibrium adsorption studies were performed to understand the mechanism of DCF adsorption. Also, thermodynamic parameters and theoretical calculations were used to investigate the adsorption mechanism and the types of interactions occurring between DCF and maghemite.
Material and methods
Chemicals
Sodium diclofenac (2-[(2,6-dichlorophenyl)amino]-benzeneacetic acid sodium salt) (318.13 g mol−1) was purchased from Sigma-Aldrich (Brazil). Fe(SO4)2(NH4)2·6H2O, HCl, H2O2 (35%, v/v), NaCl, and NaOH were purchased from Synth (Brazil).Adsorbent preparation
For the synthesis of γ-Fe2O3 nanoparticles, 5.56 g of Fe(SO4)2(NH4)2·6H2O was weighed in a 250 mL glass Beaker and dissolved in 30 mL of distilled water. Then, 15 mL of an aqueous 2.0 mol L−1 NaOH solution was slowly (100 min) added to the Fe2+ aqueous solution. After the formation of a green rust precipitate, 5 mL of 35% (v/v) H2O2 was immediately added to the Beaker under magnetic stirring (180 rpm). Then, the suspension was stirred for 30 min and then centrifuged for 10 min at 3600 rpm. The supernatant was separated from the solid and then distilled water was added to the centrifuged solid. The centrifugation process was repeated until a neutral pH of the supernatant was obtained. The solid (maghemite) was dried at 65 °C for 18 h. The maghemite was stored in an amber flask for further use.Characterization of the adsorbent
Powder XRD data were obtained using a diffractometer (RIGAKU, model GEIGERFLEX) under CuKα radiation (λ = 1.5406 Å, 40 kV and 20 mA). The diffraction pattern was recorded from 10 to 80° 2θ (Bragg angle) at a scan rate of 0.6° min−1. Particle size was calculated using the Scherrer equation23 (eqn (1)). | (1) |
Mössbauer spectra were obtained using a Mössbauer spectrometer (CMTE, model MA250) with a 57Co/Rh radiation source at room temperature (298 K) and 80 K. Nitrogen adsorption/desorption isotherms were obtained using a Quantachrome Autosorb iQ analyzer. The specific surface area was calculated using the Brunauer, Emmett, and Teller (BET)24 method and the pore size distributions were determined by the Barrett, Joyner, and Halenda (BJH)25 method.
The magnetic properties of maghemite were evaluated using a vibrating sample magnetometer (VSM) (LakeShore, model 7404). VSM measurements were used to measure the hysteresis curve and the parameters of saturation magnetization (the maximum magnetization achieved with an applied field), remanence (the zero field magnetization value) and coercive field (the value of the magnetic field to be applied to the material to bring the magnetization to zero).
The infrared spectra of maghemite, DCF, and DCF-loaded maghemite were recorded on an FT-IR spectrometer Alpha (Bruker Instruments) equipped with a diffuse reflectance infrared Fourier spectroscopy (DRIFTS) module with 128 scans per sample at a resolution of 2 cm−1.
Determination of the point of zero charge (PZC)
The pH of the point of zero charge (pHPZC) of the γ-Fe2O3 adsorbent was determined by the solid addition method.26 Samples of 20.0 mg of γ-Fe2O3 were transferred to Erlenmeyer flasks containing 20 mL of an aqueous NaCl (0.1 mol L−1) solution. The initial pH (pHi) of the aqueous solution was previously adjusted to different values from 2 to 12 by adding drops of aqueous 0.01 mol L−1 HCl or 0.01 mol L−1 NaOH solutions. The flasks were shaken at 180 rpm in an orbital incubator (Solab Scientific, model SL223) and 25 °C for 24 h to reach equilibrium. After 24 h, the final pH (pHf) of each suspension was measured using a pH meter (Metrohm) and the data obtained were plotted in a graphic representation of ΔpH (pHi − pHf) against pHi.Determination of maghemite acidity
A sample of 0.0500 g of γ-Fe2O3 was accurately weighed in a 100 mL Erlenmeyer flask, and 20.0 mL of an aqueous NaOH (0.01 mol L−1) solution was added. After 24 h of agitation at 180 rpm and 25 °C, the solution was separated from the maghemite powder by single filtration and titrated with an aqueous HCl (0.05 mol L−1) solution up to the phenolphthalein endpoint.Adsorption studies
For adsorption studies as a function of contact time (kinetics) and initial diclofenac concentration, the initial pH of the aqueous diclofenac solutions was adjusted with drops of aqueous 0.1 mol L−1 NaOH or 0.1 mol L−1 HCl solutions.Kinetic studies
Samples of 100.0 mL of a stock diclofenac (100 or 500 mg L−1) solution at pH 7.0 were added to 250 mL Erlenmeyer flasks containing 100.0 mg of the adsorbent and stirred at 150 rpm and 25 ± 1 °C in an orbital shaker incubator (Solab Scientific, model SL223) for different contact times. The adsorption capacity at a time t was determined by measuring the equilibrium concentration (Ce) of diclofenac using a UV-Vis spectrophotometer (Hewlett-Packard, model 8453) at its maximum absorbance wavelength (275 nm). A standard calibration curve was built for the quantification of diclofenac in aqueous solution (Fig. S1, ESI†).The adsorption capacity was calculated using eqn (2):
 | (2) |
The kinetic models commonly used for fitting the adsorption kinetic data in the liquid phase are the pseudo-first-order,27 pseudo-second-order,28 and intraparticle diffusion models.29 The pseudo-first-order kinetic model is defined in eqn (3):
 | (3) |
| h/(mg g−1 min−1) = k1qe | (4) |
The pseudo-second-order kinetic model implies that the adsorption capacity is proportional to the number of active sites on the adsorbent surface.28 The pseudo-second-order kinetic model is defined using eqn (5):
 | (5) |
| h/(mg g−1 min−1) = k2qe2 | (6) |
Finally, the intraparticle diffusion (IPD) kinetic model describes a mechanism in which there may be one or more steps in the adsorption on a given adsorbate. First, the adsorbate approximates to the surface of the adsorbent and then it undergoes diffusion into the pores of the adsorbent (intraparticle diffusion). Subsequently, the adsorbate is adsorbed in the inner pores of the adsorbent.30 The IPD model is represented in eqn (7):
| qt/(mg g−1) = kit0.5 + C | (7) |
Adsorption isotherms
Adsorption isotherms were performed at 25 ± 1 °C and at an initial pH of 7.0 ± 0.3. Samples of 100.0 mL of a stock diclofenac solution were added to 250 mL Erlenmeyer flasks containing 100.0 mg of adsorbent. The flasks were stirred at 150 rpm for 24 h in an orbital shaker incubator (Solab Scientific, model SL223).The isotherm models of the Langmuir,31 Freundlich,32 Temkin,33 and Sips34 were used to fit the equilibrium data of diclofenac adsorption onto γ-Fe2O3. The Langmuir model (eqn (8)) assumes the formation of an adsorbed monolayer in which all adsorption sites present the same energy. This model also assumes that the active sites are finite and that there are no lateral interactions between the adsorbates.
 | (8) |
The Freundlich model assumes multilayer adsorption onto heterogeneous surfaces. It is commonly described using eqn (9):
| qe/(mg g−1) = KFC1/ne | (9) |
The Temkin model (eqn (10)) assumes the interactions between the adsorbent and adsorbate without having the limitation of low or high concentrations of adsorbate. It assumes that the heat of adsorption of all adsorbates decreases linearly with the adsorbent coverage and that the adsorption is characterized by a uniform distribution of the binding energies up to a maximum binding energy.35
 | (10) |
The Sips or Langmuir–Freundlich model (eqn (11)) is a model derived from the Langmuir and Freundlich equations. The adsorption system will be more heterogeneous if the value of 1/n is far from unity. On the other hand, values of 1/n close to unity also suggest homogeneous surfaces, with the experimental data approaching the Langmuir model assumptions.
 | (11) |
Thermodynamic calculations
The change in enthalpy of adsorption (ΔadsH°) and the change in entropy of adsorption (ΔadsS°) were calculated using the van’t Hoff equation (eqn (12)) as follows:36 | (12) |
 | (13) |
 | (14) |
The change in free energy of adsorption (ΔadsG°) was calculated using eqn (15) as follows:
| ΔadsG°/(kJ mol−1) = ΔadsH° − TΔadsS° | (15) |
Computational methods
The DFT (Density Functional Theory) method was used for all calculations with the software ADF-BAND 2009.01.40,41 The maghemite surface and the diclofenac molecule were studied for a better understanding of how they interact.According to Yang et al.,42 the accuracy of the DFT derived results depends on the choice of functional and basis sets. The exchange–correlation functional in the generalized gradient approximation (GGA) is expressed using both the local electron density and the gradient of the electron density. Thus, it is held that the GGA functionals can provide more accurate results.42
The calculations for the optimization of the structures were performed using the PBE/GGA functional. This functional has been used with the TZP basis set, which is a large uncontracted set of Slater-type orbitals containing diffuse functions, which is of triple-ζ quality and has been improved with one polarization functional set: 3d on carbon, 4f on iron, and 2p on hydrogen. The parameters used to build the maghemite structure were based on previous studies,49–51 with the space group Fd3m as the cubic structure. The structure of maghemite with the space group Fd3m has both Fe3+ atoms per formula unit at tetrahedral sites “0.125, 0.125, and 0.125” and octahedral sites “0.5, 0.5 and 0.5”, and the positions of O atoms are defined by their coordinates “0.25468, 0.25468 and 0.25468”, with the lattice parameter a = 0.834 Å.
Results and discussion
Characterization of the adsorbent
In this study, a new, one-step, low-cost and straightforward method was used to synthesize maghemite. Table 1 provides a short comparison of the methods reported for synthesizing maghemite. The maghemite produced in the present study has a high surface area, similar to those produced by different methods, but with the advantage of using a green, simple, and fast method at room temperature and without using surfactants.The powder XRD pattern of the synthesized adsorbent is shown in Fig. 1a. The diffractogram of the synthesized material shows peaks that are characteristic of cubic maghemite, according to the Joint Committee on Powder Diffraction Standards (JCPDS), File No. 24-81, thus confirming that γ-Fe2O3 was successfully produced. The crystallite size of maghemite calculated using the Scherrer equation (eqn (1)) was estimated to be 10 nm.
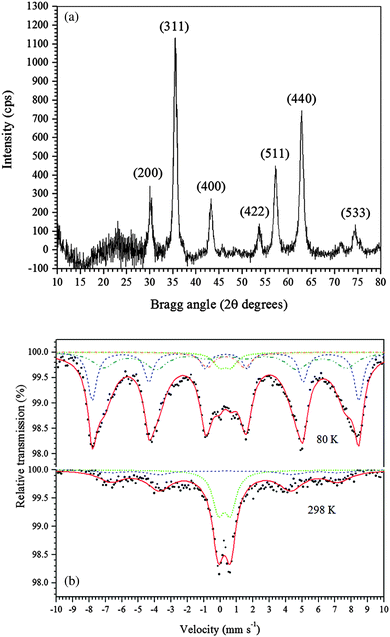 | ||
| Fig. 1 (a) Powder XRD pattern of the γ-Fe2O3 adsorbent. (b) Mössbauer spectra of the γ-Fe2O3 adsorbent at 298 K and 80 K. | ||
The 57Fe Mössbauer spectra of the synthesized maghemite recorded at 298 K and 80 K are shown in Fig. 1b. The spectrum of the sample recorded at 298 K (Fig. 1b) shows a magnetically ordered component (sextet), with the hyperfine field at approximately 48.5 T and a quadrupole shift at around zero, which is consistent with the formation of maghemite, as confirmed by XRD. Also, an intense doublet with an isomer shift of 0.36 mm s−1, typical of Fe3+ ions in octahedral coordination, was observed. This doublet suggests that the iron species have small particle size. To confirm this hypothesis, Mössbauer measurements were collected at 80 K, and the obtained spectrum is also shown in Fig. 1b. The spectrum was fitted with two subspectra corresponding to Fe3+ in octahedral (solid red lines) and tetrahedral (short dashed blue lines) sites in the maghemite structure. In addition to these two sextets, a Fe3+ doublet can still be noted even at 80 K, reflecting that the sample is constituted by two principal distributions of particle sizes: (i) larger particles (sextet in the Mössbauer spectrum) and (ii) smaller particles (doublet).
Fig. 2a shows the N2 adsorption–desorption isotherms for the γ-Fe2O3 adsorbent, which exhibited a type IV isotherm that is characteristic of mesoporous materials and a type H1 hysteresis loop that is related to the filling of the mesopores due to capillary condensation.51 The specific surface area of the γ-Fe2O3 adsorbent was 79 m2 g−1, and the pore size distribution curve (Fig. 2b) obtained by the BJH method showed a relatively narrow pore distribution in the range from 2 to 12 nm, thus confirming the formation of mesopores in the γ-Fe2O3 adsorbent. The synthesized maghemite exhibited mesopore and micropore volumes of 1.199 cm3 g−1 and 0.056 cm3 g−1, respectively.
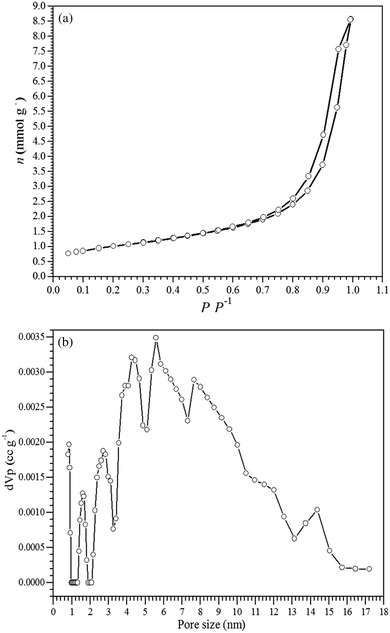 | ||
| Fig. 2 (a) Nitrogen adsorption–desorption isotherms and (b) the pore size distribution for the γ-Fe2O3 adsorbent. | ||
The maghemite acidity was found to be 0.25 mmol g−1, indicating that the adsorbent shows low surface acidity.52 The acidity can be related to the hydroxyl groups on the maghemite surface, which may also contribute to the adsorption process.
The magnetization curve for the γ-Fe2O3 is shown in Fig. S2 in the ESI.† The corresponding saturation magnetization of the synthesized maghemite nanoparticles was 19.8 emu g−1. This magnetization value for maghemite nanoparticles was higher than that reported by Hu et al.46 It is worth noting that after the application of the external magnetic field, a complete magnetic separation of the maghemite was achieved in 60 s by a permanent magnet near the wide-mouth bottle (Fig. S2, inset, ESI†). This property can be used for recovering the adsorbent from the adsorption medium for further reuse.
The infrared (IR) spectrum of maghemite (Fig. S3, ESI†) shows various bands commonly observed for iron oxides, which are related to the vibrations of Fe–O and Fe–O–H bonds. The band at 567 cm−1 was attributed to stretching of Fe–O while the bands at 896 cm−1 and 795 cm−1 were attributed to the bending of the hydrogen bond of Fe–OH⋯H. The broadband between 1442 and 1644 cm−1 was related to the angular bending of adsorbed water molecules. Finally, the region between 3000 and 3500 cm−1 indicated the presence of hydroxyl groups and also the stretching vibrations of adsorbed water molecules on the maghemite surface.47
Adsorption experiments
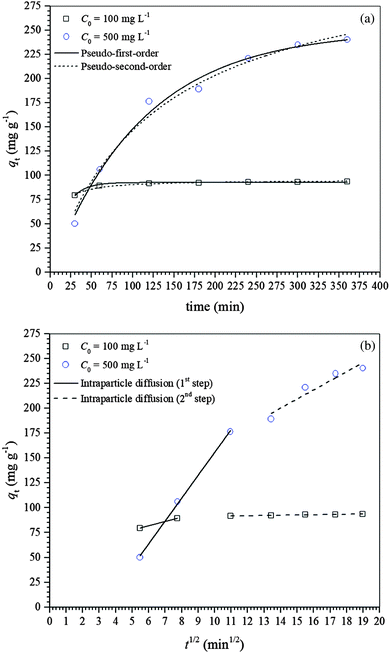
Three adsorption kinetic models, i.e., pseudo-first-order, pseudo-second-order and intraparticle diffusion, were used for modeling the kinetic data and consequently understanding the mechanism of diclofenac adsorption onto γ-Fe2O3 nanoparticles. The non-linear regression analysis of the experimental data using the pseudo-first- and pseudo-second-order models is shown in Fig. 3a while the linear regression analysis of the experimental data using the intraparticle diffusion model is presented in Fig. 3b. Fig. 3a shows that as the diclofenac concentration increases, the equilibrium is attained more slowly, i.e., 120 and 360 min for initial diclofenac concentrations of 100 and 500 mg L−1, respectively. The diclofenac adsorption process was described in two stages, with an initial fast adsorption followed by a much slower adsorption rate afterward (Fig. 3b). The slower initial adsorption of diclofenac at the lower concentration suggests that the adsorption process occurs mainly on the γ-Fe2O3 adsorbent surface. This was expected since the pore distribution of the γ-Fe2O3 is in the range from 2 to 12 nm while the length of the diclofenac molecule is ∼1.08 nm, and at lower diclofenac concentration the driving force is smaller. Then, as the initial diclofenac concentration increases, its adsorption can be separated into two steps: (i) fast initial adsorption resulting from the fast attachment of the diclofenac molecules on the maghemite surface and (ii) slow adsorption resulting from the diffusion of the diclofenac molecules inside the pores.53Table 2 shows the kinetic parameters estimated by fitting the kinetic data of diclofenac adsorption on maghemite with pseudo-first- and pseudo-second-order kinetic models while the kinetic parameters for the intraparticle diffusion model are given in Table 3. The kinetic data were better fitted by a pseudo-first-order model based on the χred2 values for both initial concentrations of 100 and 500 mg L−1. It is important to note that the experimental qe values, i.e., qe,exp,100 = 92.69 mg g−1 and qe,exp,500 = 240.50 mg g−1, were also similar to the estimated qe values obtained by the pseudo-first-order kinetic model. The parameter h, which indicates the initial rate of adsorption, decreased when the initial diclofenac concentration was increased.
| C 0 (mg L−1) | Pseudo-first-order | ||||
|---|---|---|---|---|---|
| q e,est (mg g−1) | k 1 (min−1) | h (mg g−1 min−1) | R 2 | χ red 2 | |
| 100 | 92.52 | 6.44 × 10⁻² | 5.96 | 0.9669 | 0.8217 |
| 500 | 249.94 | 8.98 × 10⁻³ | 2.24 | 0.9864 | 69.3112 |
| C 0 (mg L−1) | Pseudo-second-order | ||||
|---|---|---|---|---|---|
| q e,est (mg g−1) | k 2 (g mg−1 min−1) | h (mg g−1 min−1) | R 2 | χ red 2 | |
| 100 | 95.32 | 1.91 × 10⁻³ | 17.36 | 0.9519 | 1.1949 |
| 500 | 332.62 | 2.37 × 10⁻⁵ | 2.62 | 0.9810 | 96.6644 |
| C 0 (mg L−1) | k i,1 | k i,2 | C i,1 | C i,2 | R i,1 2 | R i,2 2 |
|---|---|---|---|---|---|---|
| (mg g−1 min−1) | (mg g−1) | |||||
| 100 | 4.350 | 0.240 | 55.65 | 89.04 | 1 | 0.9623 |
| 500 | 23.024 | 9.189 | –74.652 | 71.711 | 0.9977 | 0.8764 |
Different phenomena can control the adsorption process and determine its velocity. The external surface diffusion from the boundary layer and inside the pores were considered the most rate-limiting steps. Therefore, the kinetic results were also analyzed using the intraparticle diffusion model for a better understanding of the adsorption mechanism. The intraparticle diffusion plot, i.e., qt against t1/2, for the adsorption of diclofenac on the γ-Fe2O3 adsorbent is shown in Fig. 3b. Both plots presented multilinearity, suggesting at least two stages controlling the diclofenac adsorption process. The first stage indicates instantaneous adsorption, where the fastest stage is observed, and the second stage is a progressive adsorption where there is a limitation of the velocity due to the intraparticle diffusion. It is during the second stage that the adsorption equilibrium is attained after intraparticle diffusion begins to slow down probably due to three main reasons: (i) adsorption inside the pores; (ii) the electrostatic repulsion on the maghemite due to surface saturation; and (iii) the solute concentration in solution becomes very low, which decreased the driving force.54
Table 3 shows the parameters estimated by fitting the intraparticle diffusion model to the kinetic data of diclofenac adsorption on the γ-Fe2O3 adsorbent. It can be noticed that the intraparticle diffusion rate constants, ki,1, for the first adsorption step are higher than ki,2 for both initial diclofenac concentrations, indicating that the adsorption rate was higher at the beginning and decreased over time.55 Also, if the plot of qt against t1/2 yields a straight line that intersects the origin (C = 0), then pore diffusion is the only rate-limiting step controlling the adsorption of diclofenac on maghemite. However, the straight lines for both plots did not intersect the origin (C ≠ 0), and both plots were multilinear (Fig. 3b), suggesting that film diffusion or surface diffusion and pore diffusion are controlling the adsorption of diclofenac on the γ-Fe2O3.56–58
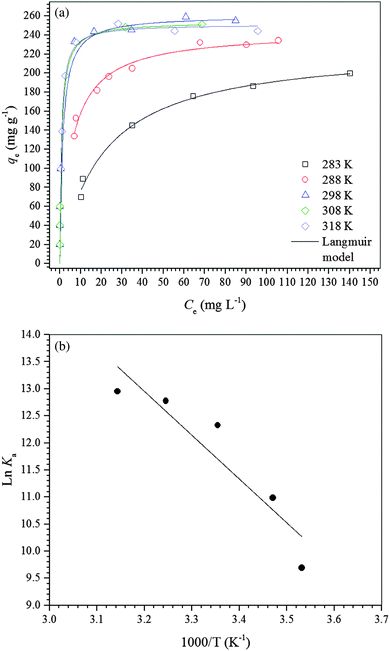 | ||
| Fig. 4 (a) Adsorption isotherms of diclofenac on the γ-Fe2O3 adsorbent at different temperatures at pH 7.0. (b) van’t Hoff plot for adsorption of diclofenac on the γ-Fe2O3 adsorbent at pH 7.0. | ||
For a better understanding of the thermodynamics of the adsorption process studied, the Langmuir constants were adequately converted into equilibrium thermodynamic constants according to the approach reported by Liu37 and Ghosal and Gupta38 and used to obtain the changes in enthalpy and entropy of adsorption using the van’t Hoff plot (Fig. 4b). Then, the change in free energy of adsorption was calculated using the fundamental thermodynamic equation. The van’t Hoff plot exhibited a satisfactory fit to the experimental data with a coefficient of determination (R2) of 0.8669 and a χred2 of 0.3399. Table 4 presents the thermodynamic parameters of adsorption. The change in enthalpy of adsorption indicates that the adsorption process of diclofenac on maghemite at pH 7.0 is endothermic, although there are many exothermic adsorption processes. However, the enthalpy of adsorption is a contribution of three subprocesses, i.e., desolvation of maghemite surface sites and diclofenac molecules, solute–solute interaction and interaction between γ-Fe2O3 surface sites and diclofenac molecules. Since the enthalpy of adsorption is positive, the energy released from interactions between maghemite surface sites and diclofenac molecules is lower than the energy involved in the desolvation of maghemite surface sites and diclofenac molecules and solute–solute interactions on the adsorbent surface.59,60 On the other hand, interactions weaker than 84 kJ mol−1 are typical of physisorption while the chemical bonding energies are between 84 and 420 kJ mol−1.61 Thus, the adsorption process of diclofenac on maghemite can be classified as physisorption. Analyzing the value of the change in entropy of adsorption, it is comprehended that the negative value of the change in free energy of adsorption is a consequence of a thermodynamic compensation balance since the value of entropy of adsorption is much higher than the enthalpy of adsorption. Thus, the adsorption process of diclofenac on maghemite at pH 7.0 is entropically driven. The entropic contribution can be attributed to the release of water molecules from the maghemite surface caused by the migration of diclofenac molecules from bulk solution to the surface of the adsorbent, which presents oxygen atoms capable of making hydrogen bonds with water molecules.59,60 Also, the free energy of adsorption becomes more negative as the temperature increases, thereby increasing the spontaneity of the adsorption process.
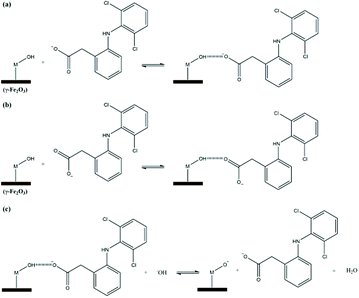
Fig. 6 shows a proposed mechanism for diclofenac adsorption onto the maghemite surface. The surface of the adsorbent (–M) has hydroxyl groups, which can probably adsorb diclofenac molecules by two main interactions, i.e., ion–dipole (Fig. 6a) and hydrogen bonding (Fig. 6b). In addition, an ion–dipole interaction between positive Fe atoms on the surface of the adsorbent and negatively charged oxygen atoms of the carboxylate groups can also occur. In the theoretical studies section, these modes of diclofenac attachment on the maghemite surface will be confirmed.
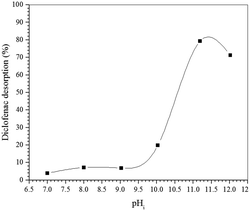
To confirm the suggested mechanism for diclofenac adsorption on maghemite, a desorption study at different pH values was performed. The desorption percentage of diclofenac as a function of solution pH is shown in Fig. 7. The desorption percentage of diclofenac slightly increases as solution pH increases from 7 to 9, but the amount desorbed did not exceed 10%. However, at pH values higher than 9, the concentration of hydroxyl anions is increased, and these basic groups are probably responsible for deprotonating the hydroxyl groups on the maghemite surface. Therefore, at pH values higher than 9, the surface adsorption sites become negative (M–O−), which leads to the breakdown of the interactions between diclofenac molecules and the adsorption sites of maghemite. This promotes the desorption of diclofenac molecules from the surface of maghemite, thereby confirming the desorption mechanism proposed in Fig. 6c.
Adsorption of diclofenac at low concentrations
Fig. S4a (see ESI†) shows the removal of diclofenac from aqueous solutions at a low concentration (5 mg L−1) as a function of time, and Fig. S4b (ESI†) shows the adsorption isotherm of diclofenac at lower initial concentrations in comparison to those shown in Fig. 4a. The kinetic and equilibrium studies of diclofenac adsorption at lower initial concentrations showed that maghemite could be an efficient adsorbent for the treatment of surface waters contaminated with diclofenac.Reuse of spent maghemite
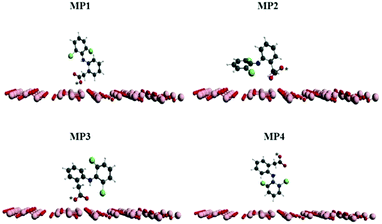
The reuse of spent maghemite was performed for five cycles. Fig. S5 (see ESI†) shows the diclofenac removal efficiency as a function of the number of adsorption cycles. In the first two cycles, the diclofenac removal efficiency by maghemite is practically maintained; however, from the third cycle, a progressive decrease in the diclofenac removal efficiency by maghemite is observed, attaining ∼45% of its initial removal efficiency in the fifth cycle. Thus, although maghemite is an efficient adsorbent for diclofenac removal, more maghemite is needed in a water treatment plant (WTP) to ensure the complete removal of diclofenac as its efficiency decreases with its use along the adsorption cycles.Fig. 9 presents the plots of the energy values calculated for the different DCF/γ-Fe2O3 configurations. In this system, the perpendicular configurations, MP1 and MP4, yielded different energy values. In comparison to the perpendicular configurations, the energy values for both parallel configurations, MP2 and MP3, presented higher energy values. For the perpendicular and parallel (MP1, MP2, and MP3) adsorption models, the low energy values can be associated with physisorption. Two factors can be used to explain the change in the energy. One is the effective contact area between the diclofenac molecule and the maghemite surface, and the other is the atomic correlation between the DCF structural group and the maghemite surface. It is expected that the parallel configuration would be more favorable due to the interaction of the carboxylic group with the maghemite surface atoms. Analyzing the data reported in Fig. 9, the lowest energy value corresponds to the MP1 structure, with the carboxylic functional group interacting perpendicularly to the maghemite surface. This conformation was identified by a distance of 7 Å, which is consistent with the 700 pm distance between the diclofenac molecule and the maghemite surface.
 | ||
| Fig. 9 Evolution of energy values at different distances of the diclofenac molecule and the maghemite surface. | ||
In a previous study, Rocha et al.50 pointed out that the charge density is higher close to O atoms. This feature can lead to a significant electron transfer from Fe to O atoms in iron oxides. These results are consistent with the main features of the calculated density states map displayed in Fig. 10, which was found in the present study for the plane (311). The red areas around the iron atoms indicate the locations of the volumes with low electron density. In short, the electrostatic calculations carried out indicate the Fe as the sites for preferential bonding with the diclofenac molecule.
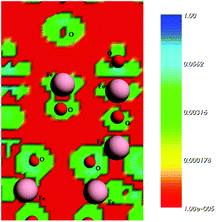 | ||
| Fig. 10 Electrostatic surface contours of the maghemite surface, plane (311). Red and green indicate volumes of low electron density and high electron density, respectively. | ||
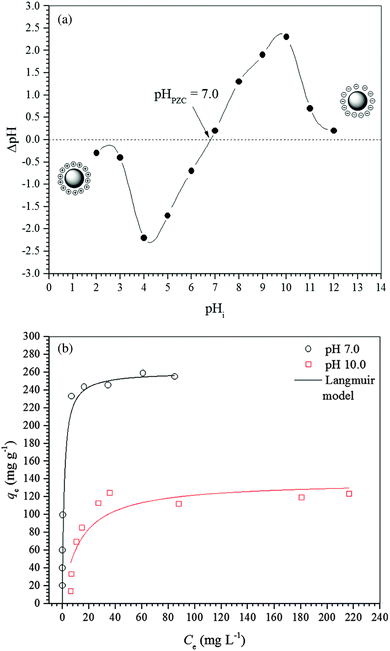
The study of diclofenac adsorption as a function of solution pH showed that adsorption is favored at pH values closer to neutrality while for basic pH values the high basicity of the solution probably leads to the deprotonation of hydroxyl groups on the adsorbent surface and consequently to the repulsion between the negatively charged maghemite surface and diclofenac molecules. The structures used in the theoretical calculations simulate a neutral surface of maghemite with the approach of the deprotonated diclofenac molecule. The deprotonated O atoms are marked with an asterisk in Fig. 10.
![[double bond, length as m-dash]](https://www.rsc.org/images/entities/char_e001.gif) C stretching absorption of the aromatic ring. The bands at 1583 and 1396 cm−1 correspond to the asymmetric and symmetric stretching of a carboxylate group, respectively, while the band at 1457 cm−1 corresponds to CH2 bending. The band at 1305 cm−1 is attributed to the stretching vibration of the C–N bond while the band at 1047 cm−1 is related to the C–Cl stretching in aryl chlorides.64 New bands appeared in the IR spectrum of maghemite loaded with DCF when compared to the IR spectrum of unloaded maghemite, which is attributed to the adsorbed diclofenac molecules on the maghemite surface. The band at 3323 cm−1 corresponds to the amine group of DCF. The shift of this band in the IR spectrum of DCF–maghemite when compared to the infrared spectrum of DCF may be related to hydrogen bond interactions occurring between the amine groups of DCF molecules and the hydroxyl groups in the maghemite surface. The spectrum of DCF–maghemite also exhibited two bands at 1589 and 1420 cm−1, which are attributed to the stretching of the carboxylate group and are in good agreement with the theoretical calculations. These IR bands were shifted in the spectrum of DCF–maghemite in comparison with the spectrum of DCF. In addition, theoretical calculations showed that carboxylate groups would be the groups most favorable for interaction between diclofenac molecules and the maghemite surface. Furthermore, the vibrations of the Fe–O bonds were shifted from 563 cm−1 to 552 cm−1 and 582 cm−1 due to the interactions with the diclofenac molecules.47
C stretching absorption of the aromatic ring. The bands at 1583 and 1396 cm−1 correspond to the asymmetric and symmetric stretching of a carboxylate group, respectively, while the band at 1457 cm−1 corresponds to CH2 bending. The band at 1305 cm−1 is attributed to the stretching vibration of the C–N bond while the band at 1047 cm−1 is related to the C–Cl stretching in aryl chlorides.64 New bands appeared in the IR spectrum of maghemite loaded with DCF when compared to the IR spectrum of unloaded maghemite, which is attributed to the adsorbed diclofenac molecules on the maghemite surface. The band at 3323 cm−1 corresponds to the amine group of DCF. The shift of this band in the IR spectrum of DCF–maghemite when compared to the infrared spectrum of DCF may be related to hydrogen bond interactions occurring between the amine groups of DCF molecules and the hydroxyl groups in the maghemite surface. The spectrum of DCF–maghemite also exhibited two bands at 1589 and 1420 cm−1, which are attributed to the stretching of the carboxylate group and are in good agreement with the theoretical calculations. These IR bands were shifted in the spectrum of DCF–maghemite in comparison with the spectrum of DCF. In addition, theoretical calculations showed that carboxylate groups would be the groups most favorable for interaction between diclofenac molecules and the maghemite surface. Furthermore, the vibrations of the Fe–O bonds were shifted from 563 cm−1 to 552 cm−1 and 582 cm−1 due to the interactions with the diclofenac molecules.47
![[thin space (1/6-em)]](https://www.rsc.org/images/entities/char_2009.gif) 000 inhabitants (considering a per capita water consumption of 200 L hab−1 d−1). However, since there might be other contaminants competing with DCF for the adsorption sites of maghemite, a higher amount would probably be required. In this case, adsorption tests with environmental samples (multicomponent matrix) are needed to ascertain the amount of maghemite needed for a given treatment. It should be highlighted that this high adsorption capacity was found for the unmodified maghemite adsorbent, and therefore, several possibilities to improve the adsorption capacity of this magnetic iron oxide based on surface chemical modification are still open for further studies.
000 inhabitants (considering a per capita water consumption of 200 L hab−1 d−1). However, since there might be other contaminants competing with DCF for the adsorption sites of maghemite, a higher amount would probably be required. In this case, adsorption tests with environmental samples (multicomponent matrix) are needed to ascertain the amount of maghemite needed for a given treatment. It should be highlighted that this high adsorption capacity was found for the unmodified maghemite adsorbent, and therefore, several possibilities to improve the adsorption capacity of this magnetic iron oxide based on surface chemical modification are still open for further studies.
| Adsorbent | Q max (mg g−1) at 298 K | pH | Ref. |
|---|---|---|---|
| Reduced graphene oxide | 59.67 | 10.0 | 65 |
| Montmorillonite | 497.00 | 6.7 | 66 |
| Chloride-modified zeolite | 31.35 | 7.4 | 67 |
| Hexadecyltrimethylammonium bromide-modified zeolite | 45.87 | 7.4 | 67 |
| Modified diatomite | 390.02 | 7.5 | 68 |
| Graphene oxide | 500.00 | 7.0 | 69 |
| Isabel grape bagasse | 76.98 | 5.0 | 70 |
| Molecularly imprinted polymer | 324.80 | 8.0 | 71 |
| Granular carbon nanotubes/alumina hybrid | 33.86 | 6.0 | 72 |
| Commercial activated carbon | 83 | 5.5 | 70 |
| This study | 120.00 | 10.0 | |
| This study | 252.00 | 7.0 | — |
Conclusions
Maghemite was synthesized by a new synthesis route using low-cost and non-toxic reagents. The synthesized maghemite had a high surface area and a small particle size, as suggested by the data obtained from BET/BJH and XRD. The maximum adsorption capacity for diclofenac in an aqueous solution was 252 mg g−1 at pH 7.0. Thermodynamic studies indicated that the adsorption of diclofenac on maghemite is an endothermic process. The Langmuir and Sips models best fitted the equilibrium data obtained while the adsorption kinetics followed a pseudo-first-order model. Adsorption experiments at different pH values showed that the solution pH was a crucial parameter for diclofenac removal by maghemite nanoparticles. At pH higher than 9, diclofenac removal was hindered, possibly due to its competition with hydroxyl ions for the active sites of the material. The theoretical calculations reinforce the adsorption mechanism proposed (physisorption), in which the diclofenac molecules bind on the maghemite surface by using OH functional groups.Conflicts of interest
There are no conflicts to declare.Acknowledgements
The authors are grateful to the Federal University of Ouro Preto (UFOP grant number 23109.003209/2016-98), the Brazilian National Research Council (CNPq grant number 443426/2014-7), the Minas Gerais State Research Funding Agency (FAPEMIG grant number APQ-00847-14; APQ-00369-14) and the National Council for the Improvement of Higher Education (CAPES) for funding this research.Notes and references
- B. Petrie, R. Barden and B. Kasprzyk-Hordern, Water Res., 2015, 72, 3–27 CrossRef CAS PubMed.
- C. Jung, A. Son, N. Her, K.-D. Zoh, J. Cho and Y. Yoon, J. Ind. Eng. Chem., 2015, 27, 1–11 CrossRef CAS.
- European Parliament, Off. J. Eur. Communities: Legis., 2008, 164, 19–40 Search PubMed.
- S. Álvarez-Torrellas, A. Rodríguez, G. Ovejero and J. García, Chem. Eng. J., 2016, 283, 936–947 CrossRef.
- A. Ziylan and N. H. Ince, J. Hazard. Mater., 2011, 187, 24–36 CrossRef CAS PubMed.
- B. t. Ferrari, N. Paxéus, R. L. Giudice, A. Pollio and J. Garric, Ecotoxicol. Environ. Saf., 2003, 55, 359–370 CrossRef CAS PubMed.
- D. G. Oviedo-Gomez, M. Galar-Martinez, S. Garcia-Medina, C. Razo-Estrada and L. M. Gomez-Olivan, Environ. Toxicol. Pharmacol., 2010, 29, 39–43 CrossRef CAS PubMed.
- A. G. Slater and A. I. Cooper, Science, 2015, 348, aaa8075 CrossRef PubMed.
- R. E. Morris and J. Cejka, Nat. Chem., 2015, 7, 381–388 CrossRef CAS PubMed.
- B. Ashourirad, A. K. Sekizkardes, S. Altarawneh and H. M. El-Kaderi, Chem. Mater., 2015, 27, 1349–1358 CrossRef CAS.
- N. Chalal, H. Bouhali, H. Hamaizi, B. Lebeau and A. Bengueddach, Microporous Mesoporous Mater., 2015, 210, 32–38 CrossRef CAS.
- H. Zhao, X. Liu, Z. Cao, Y. Zhan, X. Shi, Y. Yang, J. Zhou and J. Xu, J. Hazard. Mater., 2016, 310, 235–245 CrossRef CAS PubMed.
- B. N. Bhadra, P. W. Seo and S. H. Jhung, Chem. Eng. J., 2016, 301, 27–34 CrossRef CAS.
- M. J. Ahmed, J. Environ. Manage., 2017, 190, 274–282 CrossRef CAS PubMed.
- H. L. Derang Cao, L. Pan, J. Li, X. Wang, P. Jing, X. Cheng, W. Wang, J. Wang and Q. Liu, Sci. Rep., 2016, 6, 32360 CrossRef PubMed.
- J. Lalley, C. Han, X. Li, D. D. Dionysiou and M. N. Nadagouda, Chem. Eng. J., 2016, 284, 1386–1396 CrossRef CAS.
- N. V. Long, Y. Yang, T. Teranishi, C. M. Thi, Y. Cao and M. Nogami, Mater. Des., 2015, 86, 797–808 CrossRef CAS.
- M. C. Pereira, L. C. A. Oliveira and E. Murad, Clay Miner., 2012, 47, 285–302 CrossRef CAS.
- O. Horner, S. Neveu, S. de Montredon, J.-M. Siaugue and V. Cabuil, J. Nanopart. Res., 2009, 11, 1247–1250 CrossRef CAS.
- J. Lu, X. Jiao, D. Chen and W. Li, J. Phys. Chem. C, 2009, 113, 4012–4017 CAS.
- J. Vidal-Vidal, J. Rivas and M. López-Quintela, Colloids Surf., A, 2006, 288, 44–51 CrossRef CAS.
- M. Aliahmad and N. Nasiri Moghaddam, Mater. Sci.-Pol., 2013, 31, 264–268 CrossRef CAS.
- P. Scherrer, Nachr. Ges. Wiss. Goettingen, Math.-Phys. Kl., 1918, 98–100 Search PubMed.
- S. Brunauer, P. H. Emmett and E. Teller, J. Am. Chem. Soc., 1938, 60, 309–319 CrossRef CAS.
- E. P. Barrett, L. G. Joyner and P. P. Halenda, J. Am. Chem. Soc., 1951, 73, 373–380 CrossRef CAS.
- L. Ai, C. Zhang, F. Liao, Y. Wang, M. Li, L. Meng and J. Jiang, J. Hazard. Mater., 2011, 198, 282–290 CrossRef CAS PubMed.
- S. Y. Lagergren, Handlingar, 1898, 24, 1–39 Search PubMed.
- Y. S. Ho and G. McKay, Process Biochem., 1999, 34, 451–465 CrossRef CAS.
- T. W. Weber and R. K. Chakravorti, AIChE J., 1974, 20, 228–238 CrossRef CAS.
- T. A. Khan, S. A. Chaudhry and I. Ali, J. Mol. Liq., 2015, 202, 165–175 CrossRef CAS.
- I. Langmuir, J. Am. Chem. Soc., 1918, 40, 1361–1403 CrossRef CAS.
- H. M. Freundlich, Z. Phys. Chem., 1906, 57, 385–470 CAS.
- M. Temkin and V. Pyzhev, Acta Physicochim. URSS, 1940, 12, 217–222 Search PubMed.
- R. Sips, J. Chem. Phys., 1948, 16, 490–495 CrossRef CAS.
- O. Hamdaoui and E. Naffrechoux, J. Hazard. Mater., 2007, 147, 381–394 CrossRef CAS PubMed.
- J. H. Van't Hoff, Etudes de dynamique chimique, Frederik Mullet and Co., Amsterdam, 1884 Search PubMed.
- Y. Liu, J. Chem. Eng. Data, 2009, 54, 1981–1985 CrossRef CAS.
- P. S. Ghosal and A. K. Gupta, J. Mol. Liq., 2017, 225, 137–146 CrossRef CAS.
- E. Guntelberg, Z. Phys. Chem., 1926, 123, 199–247 CAS.
- G. te Velde, F. M. Bickelhaupt, E. J. Baerends, C. Fonseca Guerra, S. J. A. van Gisbergen, J. G. Snijders and T. Ziegler, J. Comput. Chem., 2001, 22, 931–967 CrossRef CAS.
- E. J. B. G. te Velde, P. H. T. Philipsen, G. Wiesenekker, J. A. Groeneveld, J. A. Berger, P. L. de Boeij and R. Klooster, F. Kootstra, P. Romaniello, J. G. Snijders, E. S. Kadantsev, T. Ziegler, Vrije Universiteit, Amsterdam, The Netherlands, 2009 Search PubMed.
- Q. Yang, D. Liu, C. Zhong and J.-R. Li, Chem. Rev., 2013, 113, 8261–8323 CrossRef CAS PubMed.
- E. Darezereshki, M. Ranjbar and F. Bakhtiari, J. Alloys Compd., 2010, 502, 257–260 CrossRef CAS.
- W. Jiang, M. Pelaez, D. D. Dionysiou, M. H. Entezari, D. Tsoutsou and K. O’Shea, Chem. Eng. J., 2013, 222, 527–533 CrossRef CAS.
- A. Afkhami and R. Moosavi, J. Hazard. Mater., 2010, 174, 398–403 CrossRef CAS PubMed.
- J. Hu, G. Chen and I. M. C. Lo, J. Environ. Eng., 2006, 132, 709–715 CrossRef CAS.
- S. Rajput, L. P. Singh, C. U. Pittman and D. Mohan, J. Colloid Interface Sci., 2017, 492, 176–190 CrossRef CAS PubMed.
- A. Etale, H. Tutu and D. C. Drake, Appl. Water Sci., 2016, 6, 187–197 CrossRef CAS.
- R. M. Cornell and U. Schwertmann, The Iron Oxides: Structure, Properties, Reactions, Occurrences and Uses, Wiley-VCH, Darmstadt, Germany, 2nd edn, 2006 Search PubMed.
- M. V. J. Rocha, H. W. P. de Carvalho, V. H. V. Sarmento, A. F. Craievich and T. C. Ramalho, Polym. Compos., 2016, 37, 51–60 CrossRef CAS.
- F. Rojas, I. Kornhauser, C. Felipe, J. M. Esparza, S. Cordero, A. Dominguez and J. L. Riccardo, Phys. Chem. Chem. Phys., 2002, 4, 2346–2355 RSC.
- G. Corro, F. Bañuelos, E. Vidal and S. Cebada, Fuel, 2014, 115, 625–628 CrossRef CAS.
- D. Lázaro, C. Caldeira, M. Dantas, M. Mansur, L. Oliveira and A. Franca, Int. J. Sustain. Dev. Plann., 2012, 7, 446–456 CrossRef.
- W. J. Weber and E. H. Smith, Environ. Sci. Technol., 1987, 21, 1040–1050 CrossRef.
- L. Largitte and R. Pasquier, Chem. Eng. Res. Des., 2016, 109, 495–504 CrossRef CAS.
- M. A. Bahri, L. Calvo, J. Lemus, M. A. Gilarranz, J. Palomar and J. J. Rodriguez, Chem. Eng. J., 2012, 198–199, 346–354 CrossRef CAS.
- K. A. G. Gusmão, L. V. A. Gurgel, T. M. S. Melo and L. F. Gil, J. Environ. Manage., 2013, 118, 135–143 CrossRef PubMed.
- L. A. Al-Khateeb, A. Y. Obaid, N. A. Asiri and M. Abdel Salam, J. Ind. Eng. Chem., 2014, 20, 916–924 CrossRef CAS.
- F. S. Teodoro, S. N. D. C. Ramos, M. M. C. Elias, A. B. Mageste, G. M. D. Ferreira, L. H. M. da Silva, L. F. Gil and L. V. A. Gurgel, J. Colloid Interface Sci., 2016, 483, 185–200 CrossRef CAS PubMed.
- B. C. S. Ferreira, F. S. Teodoro, A. B. Mageste, L. F. Gil, R. P. de Freitas and L. V. A. Gurgel, Ind. Crops Prod., 2015, 65C, 521–534 CrossRef.
- H. Mahmoodian, O. Moradi, B. Shariatzadeha, T. A. Salehf, I. Tyagi, A. Maity, M. Asif and V. K. Gupta, J. Mol. Liq., 2015, 202, 189–198 CrossRef CAS.
- H. Zhao, X. Liu, Z. Cao, Y. Zhan, X. Shi, Y. Yang, J. Zhou and J. Xu, J. Hazard. Mater., 2016, 310, 235–245 CrossRef CAS PubMed.
- G. Lamanna, M. Kueny-Stotz, H. Mamlouk-Chaouachi, C. Ghobril, B. Basly, A. Bertin, I. Miladi, C. Billotey, G. Pourroy, S. Begin-Colin and D. Felder-Flesch, Biomaterials, 2011, 32, 8562–8573 CrossRef CAS PubMed.
- D. Pavia, G. Lampman, G. Kriz and J. Vyvyan, Introduction to Spectroscopy, Cengage Learning, 4th edn, 2014 Search PubMed.
- I. M. Jauris, C. F. Matos, C. Saucier, E. C. Lima, A. J. G. Zarbin, S. B. Fagan, F. M. Machado and I. Zanella, Phys. Chem. Chem. Phys., 2016, 18, 1526–1536 RSC.
- M. Kaur and M. Datta, Adsorpt. Sci. Technol., 2014, 32, 365–387 CrossRef CAS.
- D. Krajisnik, A. Dakovic, M. Milojevic, A. Malenovic, M. Kragovic, D. B. Bogdanovic, V. Dondur and J. Milic, Colloids Surf., B, 2011, 83, 165–172 CrossRef CAS PubMed.
- J. Janicijevic, D. Krajisnik, B. Calija, B. N. Vasiljevic, V. Dobricic, A. Dakovic, M. D. Antonijevic and J. Milic, Int. J. Pharm., 2015, 496, 466–474 CrossRef CAS PubMed.
- S.-W. Nam, C. Jung, H. Li, M. Yu, J. R. V. Flora, L. K. Boateng, N. Her, K.-D. Zoh and Y. Yoon, Chemosphere, 2015, 136, 20–26 CrossRef CAS PubMed.
- M. Antunes, V. I. Esteves, R. Guégan, J. S. Crespo, A. N. Fernandes and M. Giovanela, Chem. Eng. J., 2012, 192, 114–121 CrossRef CAS.
- C. M. Dai, S. U. Geissen, Y. L. Zhang, Y. J. Zhang and X. F. Zhou, Environ. Pollut., 2011, 159, 1660–1666 CrossRef CAS PubMed.
- H. Wei, S. Deng, Q. Huang, Y. Nie, B. Wang, J. Huang and G. Yu, Water Res., 2013, 47, 4139–4147 CrossRef CAS PubMed.
- D. R. S. Lima, M. C. Tonucci, S. F. Aquino and M. Libânio, Eng. Sanit. Ambiental, 2017 Search PubMed , in press.
Footnote |
| † Electronic supplementary information (ESI) available. See DOI: 10.1039/c7nj03214e |
| This journal is © The Royal Society of Chemistry and the Centre National de la Recherche Scientifique 2018 |

