 Open Access Article
Demonstration of parallel algal processing: production of renewable diesel blendstock and a high-value chemical intermediate
Eric P.
Knoshaug
 *a,
Ali
Mohagheghi
a,
Nick J.
Nagle
a,
Jonathan J.
Stickel
a,
Tao
Dong
a,
Eric M.
Karp
a,
Jacob S.
Kruger
a,
David G.
Brandner
 a,
Lorenz P.
Manker
a,
Nick A.
Rorrer
a,
Deb A.
Hyman
a,
Earl D.
Christensen
b and
Philip T.
Pienkos
a
a,
Lorenz P.
Manker
a,
Nick A.
Rorrer
a,
Deb A.
Hyman
a,
Earl D.
Christensen
b and
Philip T.
Pienkos
a
aNational Bioenergy Center, National Renewable Energy Laboratory, Golden, CO 80401, USA. E-mail: eric.knoshaug@nrel.gov
bTransportation and Hydrogen Systems, National Renewable Energy Laboratory, Golden, CO 80401, USA
First published on 19th December 2017
Abstract
Co-production of high-value chemicals such as succinic acid from algal sugars is a promising route to enabling conversion of algal lipids to a renewable diesel blendstock. Biomass from the green alga Scenedesmus acutus was acid pretreated and the resulting slurry separated into its solid and liquor components using charged polyamide induced flocculation and vacuum filtration. Over the course of a subsequent 756 hours continuous fermentation of the algal liquor with Actinobacillus succinogenes 130Z, we achieved maximum productivity, process conversion yield, and titer of 1.1 g L−1 h−1, 0.7 g g−1 total sugars, and 30.5 g L−1 respectively. Succinic acid was recovered from fermentation media with a yield of 60% at 98.4% purity while lipids were recovered from the flocculated cake at 83% yield with subsequent conversion through deoxygenation and hydroisomerization to a renewable diesel blendstock. This work is a first-of-its-kind demonstration of a novel integrated conversion process for algal biomass to produce fuel and chemical products of sufficient quality to be blend-ready feedstocks for further processing.
Introduction
Though algae-based feedstocks offer a greater theoretical conversion yield in terms of gallons of gasoline equivalent per ton of biomass over terrestrial-based feedstocks, reducing the costs for algal feedstocks remains a challenge for renewable fuel production.1 One strategy to offset these costs is to improve the net profitability of biorefineries through co-production of higher value chemicals in tandem with commodity fuels. Succinic acid, produced via fermentation of storage carbohydrates present in algal biomass, can serve as a higher-value chemical and as a feedstock for other chemicals such as maleic anhydride, 1,4-butanediol, tetrahydrofuran, and poly-butyl succinate.2–4 These down-stream chemical products can supply multiple markets and thus disperse the potentially large succinic acid supply when commercial scale algal biofuels come online. Conversion of algal biomass to succinic acid using a biological route is particularly advantageous from a sustainability viewpoint as renewable algae biomass has a higher productivity than terrestrial feedstocks5–7 and biological routes to succinic acid consume CO2 rather than releasing it and reduce the need for conversion of dangerous chemicals such as benzene or butane.8The most well-known succinic acid producing microorganism, Actinobacillus succinogenes has been used to ferment many diverse terrestrial feedstocks3,9 while another more recently described succinic acid producing bacteria, Basfia succiniciproducens, has been used to produce succinic acid from crude glycerol and lignocellulosic hydrolysate.10–12 An abundance of terrestrial feedstocks have been explored for succinic acid production; however, for aquatic feedstocks, only macroalgae have been evaluated as a source of fermentation sugars. Using A. succinogenes 130Z, batch fermentations of sugars released using enzymatic hydrolysis from Saccharina latissimi or Laminaria digitata achieved maximum titers, yields, and productivities of 36.8 g L−1, 0.92 g g−1 sugars, and 3.9 g L−1 h−1 and 33.8 g L−1, 0.87 g g−1 sugars, and 0.5 g L−1 h−1 respectively.13,14 Similarly, sugars released from Palmaria palmata using a two-step hydrochloric acid followed by enzymatic hydrolysis pretreatment were fermented to produce succinic acid by an engineered E. coli strain that achieved a maximum titer, yield, and productivity of 22.4 g L−1, 0.73 g g−1 total sugars, and 0.3 g L−1 h−1 respectively.15
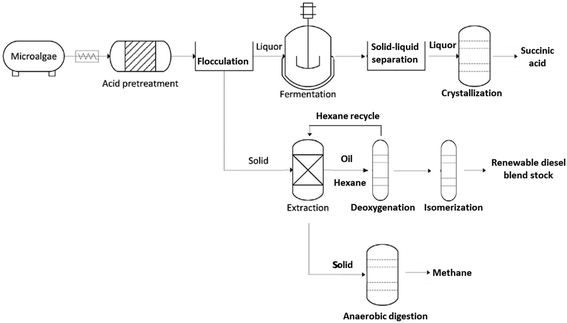
Recently, combined algal processing (CAP) demonstrated integrated biofuel production from pretreated algal biomass.16 The CAP process employs acid pretreatment of algal biomass to provide whole-slurry for ethanol fermentation followed by distillation and lipid extraction of the stillage to generate biofuel precursors. Similar to CAP, parallel algal processing for succinic acid (PAP-SA) uses acid pretreatment of algal biomass but follows with a solid–liquid separation step prior to fermentation of the liquor (Fig. 1). The solid liquid separation is included to facilitate the recovery of succinic acid following fermentation.
The two solid–liquid separation steps are critical, in that recovery of succinic acid, and potentially other high-value carbohydrate-fermentation derived chemicals uses a crystallization process that would be negatively impacted by insoluble solids present in the whole slurry (insoluble pretreated algal biomass particulates) or fermentation broth (spent fermentative organism biomass).17 Due to the small size and low density of the residual solids, separation of pretreated algal hydrolysate using batch centrifugation is time and energy consuming and results in losses of both lipids and carbohydrates. Thus, in order to improve separation efficiency and recovery yields, alternative separation approaches are necessary. Flocculation and filtration for solid–liquid separation of pretreated and enzymatically hydrolyzed corn stover biomass was previously shown to be successful18 and thus offers a potential pathway for reducing material losses and costs associated with separation of pretreated algal hydrolysates. Finally, the solids from the PAP-SA process are extracted for oil recovery using a hexanes-recycle process.
Lipids extracted from oleaginous algal biomass consist primarily of triacylglycerols (TAGs) and free fatty acids (FFAs). Conversion of TAGs and FFAs into normal- and iso-alkanes using catalytic deoxygenation (DO) and/or hydroisomerization (HI) has been demonstrated for animal fats and vegetable oils.19–21 However, despite the promising potential of algal lipids to become a major biofuel feedstock,22 examples of algal-lipid upgrading are comparatively sparse23–30 especially with respect to the integration of DO and HI with other biorefinery processes. We were thus motivated to describe a DO and HI process for converting crude algal lipids isolated using the hexanes-recycle process into a renewable diesel blendstock (RDBS). We selected Pd/C and Pt/SAPO-11 catalysts for DO and HI, respectively, due to the attractive performance of these catalysts in previous studies.31–36 Here we demonstrate the complete PAP-SA from microalgal biomass through to finished RDBS and a purified, high-value, chemical co-product (succinic acid). Significantly, this is the first integrated demonstration of each of the units of operation for establishing an algae feedstock-based biorefinery. This demonstration is notable for employing flocculation to separate the pretreated algae solids from the liquor with subsequent RDBS and continuous succinic acid production from the recovered solids and liquor respectively.
Materials and methods
Feedstock processing
Microalgal biomass, Scenedesmus acutus, was provided by the Arizona Center for Algae Technology and Innovation at Arizona State University (Phoenix, AZ). This biomass, designated high-carbohydrate Scenedesmus (HCSD), was harvested at the mid-cultivation stage for high-carbohydrate content.16 In brief, by timing the harvest, biomass of high carbohydrate composition was obtained from an outdoor flat panel photobioreactor (650 L) in nitrate-deplete cultivation media. The cultivation time after reaching nitrate-deplete conditions was established by the desired biomass composition, which was typically 3 to 5 days for high carbohydrate biomass. Harvesting of the biomass was accomplished using an Alfa Laval (Richmond, VA) centrifugal separator. The concentrated algal solids were frozen, shipped to NREL, and stored frozen until pretreated.Pretreatment and hydrolysate preparation
Pretreatment of HCSD was performed in a batch-type reactor, a 4 L (2 L working volume) ZipperClave® reactor (Autoclave Engineers, Erie, PA), as previously described.16 Wet algal paste (450 g) was loaded into the reaction container and H2SO4 and water were added to achieve a final total solids loading of 25% (w/w) at an acid concentration of 2% (w/w). Algal biomass was pretreated at 155 °C for 15 minutes. At the end of the pretreatment reaction, the sample canister was removed and quenched in an ice bath. The pretreated algal hydrolysate slurry (PAHS) was then removed and refrigerated. Multiple pretreatment runs were carried out and the material combined to provide enough PAHS for continuous fermentation. The methods used to determine protein, carbohydrate, lipids (as fatty acid methyl-esters (FAME)), and ash content of the various fractions based on dry weight have been described.37–41Flocculation and vacuum filtration
KemSep C-7801 is a cationic polyacrylamide with an 80% molar charge and molar mass of 14 million. The pH was adjusted to 6.1 to 6.5 (from the initial value of ∼2 for material taken out of the pretreatment reactor) with 50% NaOH solution, diluting the PAHS by less than 5%. The pH-adjusted PAHS was incubated for at least 4 h to allow the surface chemistry of the slurry solids to equilibrate at the adjusted pH. A working solution of 1 wt% was made from the stock solution of C-7801. This working solution was dosed by mass at ∼3% of the pH-adjusted PAHS (3 g working solution added to 100 g of slurry). For a concentration of 6% insoluble solids in the slurry, this results in an overall loading of 5 g of flocculant solution per kg of insoluble solids (i.e., 0.5%). All mixing during pH adjustment and flocculation addition was performed with a laboratory mixer equipped with a 50 mm marine impeller.Small scale flocculation and filtration experiments were performed with both a ceramic Buchner funnel (A = 14.2 cm2) using Whatman #1 filter paper and an Outotec Buchner filter (A = 100 cm2) using MARO S50 filter cloth. About 30 g of slurry was loaded in the ceramic unit, and about 250 g was loaded in the Outotec unit. Regulated house vacuum was applied at 15 in Hg as the driving force for filtration. A separate large (6 kg) batch of slurry was flocculated to prepare clarified liquor for continuous succinic acid fermentation. pH adjustment and flocculent dosing were as for the small experiments, except mixing was performed manually by stirring. A 30 in Buchner filter was used for vacuum filtration. Muslin filter cloth was used to line the filter, primarily to ease cleaning. A dedicated vacuum pump was used to apply vacuum. In order to test for potential toxicity of the C-7801 flocculent, solid–liquid separation was also performed using a Q-20 centrifuging filter (Western, Ill.) equipped with a 30-micron basket. The centrifuge was operated at 8000g for 20 minutes as described previously.16 Pretreated algal liquor (PAL) recovered from either flocculation or centrifugation was sterile filtered through a 0.2 μm filter prior to fermentation.
Fermentation
Wild-type A. succinogenes 130Z (ATCC 55618)42 and B. succiniciproducens CCUG 57335![[thin space (1/6-em)]](https://www.rsc.org/images/entities/char_2009.gif) 43 were used for succinic acid fermentations. Culture samples were stored at −80 °C in a cryopreservation solution (40% glycerol solution mixed with an equal volume of cells). Cells were revived by transferring a 1 mL frozen vial into 50 mL tryptic soy broth (TSB) (SigmaAldrich, cat# 22092) in 100 mL capped bottle incubated at 37 °C at 150 rpm overnight. The next day, 10% of the revived culture was transferred to 50 mL TSB in a 100 mL bottle incubated at 37 °C at 150 rpm and used as a seed culture for fermenter inoculation after overnight growth.
43 were used for succinic acid fermentations. Culture samples were stored at −80 °C in a cryopreservation solution (40% glycerol solution mixed with an equal volume of cells). Cells were revived by transferring a 1 mL frozen vial into 50 mL tryptic soy broth (TSB) (SigmaAldrich, cat# 22092) in 100 mL capped bottle incubated at 37 °C at 150 rpm overnight. The next day, 10% of the revived culture was transferred to 50 mL TSB in a 100 mL bottle incubated at 37 °C at 150 rpm and used as a seed culture for fermenter inoculation after overnight growth.
Fermentation medium consisted of 800 mL of PAL obtained after flocculation and vacuum filtration of PAHS and adjusted to pH 5.2 using NaOH. Neutralized PAL was combined with 50 mL of corn steep liquor (200 g L−1), 80 mL of yeast extract (60 g L−1), 50 mL of salts stock (20×), and 20 mL of phosphate salts stock (50×). The 20× stock salts solution contained 1 g L−1 NaCl and (NH4)2SO4, 0.2 g L−1 MgCl2·6H2O and CaCl2·2H2O. The 50× stock phosphate salts solution contained 1.5 g L−1 of both K2HPO4 and KH2PO4. The final fermentation media was sterilized using a 0.22 μm filtration cartridge.
Small scale bottle fermentations to test the toxicity of residual flocculant that could carry over to the liquor phase and to compare the performance of two succinic acid producing microbes were performed. To each bottle, 50 mL of the same media used for the continuous fermentation or, for the flocculant toxicity test, media made using the liquor recovered from centrifugation as described above, was added to autoclaved 125 mL screw-capped bottles containing 1.5 g (30 g L−1 MgCO3) as a CO2 source.44 The bottles were inoculated with actively growing overnight seed cultures at a starting OD600 of 0.1. The bottles were incubated at 37 °C and 150 rpm for 5 days. The pH was measured daily and adjusted up to 7 using 5 N NaOH if necessary. Daily samples were analyzed via high-performance liquid chromatography (HPLC) as described.
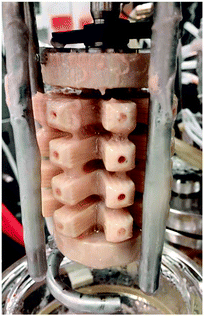
Continuous fermentation was performed using a 0.5 L BioFlo 3000 bioreactor system (New Brunswick Scientific, USA). The working volume was controlled at 0.3 L by means of an overflow tube connected to an exit pump running at a higher speed. To increase the available surface area for cell attachment and biofilm growth, a novel large surface area impeller was printed based on a previously reported model.45 The impeller was constructed with a Fortus 400 FDM 3D printer (Stratasys, USA) from Ultem 9085 thermoplastic resin. The material is known for higher strength and thermostability specifically above autoclave temperatures. The external surfaces were purposefully made rough and internal flow channels were added to increase the surface area for biofilm attachment. The central tube was attached to the agitation shaft by means of stainless steel brackets (Fig. 2).
The CO2 supply to the fermenter was controlled manually at a fixed rate of 0.10 vvm by means of a 65 mm aluminum rotameter (Cole-Parmer, USA) and fed through a submerged sparger located beneath the agitation shaft. All gas entering and exiting the fermenter and venting from reservoirs passed through Millex-FG 0.2 μm PTFE filters (Millipore, USA) to ensure sterility. Gas vented through the head of the fermenter was passed through a drainable foam trap to prevent blockage of the vent filter. Temperature was controlled at 37 °C. pH was controlled at 6.8 using a gel-filled 405-DPAS probe (Mettler Toledo, Switzerland) coupled to a PID controller which regulated the dosing of an unsterilized 5 N NaOH solution (Fisher Scientific, USA). A 10% v/v solution of antifoam SE-15 (Sigma-Aldrich, USA) was dosed as needed into the headspace to suppress foaming. The fermenter and 3D-printed impeller were autoclaved empty and separately at 121 °C for 60 minutes. The filter-sterilized media (300 mL) was aseptically poured into the fermenter and the remainder of the media was reserved as a feed stock for the continuous fermentation. The seed culture was concentrated by centrifugation and the cells were re-suspended in water and added to the fermenter to achieve a starting optical density at 600 nm of 0.5. The fermenter was operated in batch mode for approximately 24 h after inoculation. Continuous operation began once the concentrations of glucose and mannose were below 1.0 g L−1. The dilution rate during continuous operation was changed only after a minimum of 3 changes of fermentation media in the fermenter based on the new dilution rate.
Carbohydrate and acids analysis
Acids present in the fermentation media were quantified on an Agilent 1100/1200 HPLC system with refractive index detection. A Bio-Rad Aminex HPX-87H column was used with a flow rate of 0.6 mL min−1 using 0.01 N H2SO4 as the mobile phase. Each sample injection volume was 6 μL and had a run time of 50 minutes. The column and detector temperatures were both set at 55 °C. A set of standards containing succinic acid (Absolute Standards part 98149) were used for calibration. Carbohydrates were quantified by high performance anion exchange on a Thermo Scientific Dionex ICS 5000 system equipped with pulsed amperometric detection. A Dionex CarboPac PA20 column preceded by a Dionex AminoTrap was run at 0.5 mL min−1 and 35 °C for both column and detector compartments using the quadruple waveform recommended by Dionex for carbohydrate detection. Samples were injected at 10 μl and an eluent of 27.5 mM sodium hydroxide was used to separate the monosaccharides followed by a gradient from 2–17% of 1 M sodium acetate and 100 mM sodium hydroxide. All samples were filtered through a 0.2 μm nylon filter and diluted as necessary prior to analysis.Lipid extraction from the flocculated algal solids
The flocculated pretreated algal solids (PAS) cakes were mixed with 0.6 wt% of H2SO4 to disrupt the flocculated cake structure and reduce the pH for better lipid extraction. The acidified slurry was mixed with an equal volume of hexanes in a round bottom flask. The mixture was stirred for 3 hours using a mechanical stirrer (Arrow 850, Arrow Engineering, NJ) and then allowed to stand for 2 hours for phase separation. The upper hexanes phase was transferred to a round bottom flask and the hexanes were recovered using rotary evaporation at 45 °C at 20 in Hg vacuum. We used the recovered solvent for two more extraction cycles, and the three hexanes extracts were combined. The extracted oil was analyzed as described to quantify lipids as FAME content.38,41Succinic acid purification
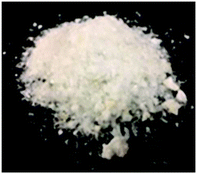
Succinic acid was separated from the fermentation broth following a 5-step procedure. In step 1, cells and debris were removed from 1.5 L of broth using centrifugation followed by filtration through a 0.2 μm pore size PTFE filter. The filter-sterilized broth was then filtered through a hollow fiber cartridge filter with a 10 kDa pore size (GE Healthcare Bio-Sciences Corp., Westborough MA) to remove proteins. In step 2, the broth was passed through the cation exchange resin DOWEX G-26 (Sigma-Aldrich, lot #MKBX1809V). The resin was cleaned and pretreated by adding 800 g of dry resin to a large beaker, which was covered with 10 wt% sulfuric acid and stirred for 1 hour. The resin and sulfuric acid solution was then slurried into a 1 L glass column with a glass frit at the base of the column. Approximately 10 bed volumes of ultra high purity water was then added and drained rapidly through the resin bed using a stopcock at the bottom of the column. The pH of the effluent water was tested using pH paper and additional water was rinsed through the column until the pH of the effluent water was neutral leaving the resin in its H-form.46 200 mL of the wet resin was then removed from the column and added to a large beaker and 1 L of filtered fermentation broth was added to the beaker and stirred with the resin for 1 hour. This batch exchange released CO2 gas from the broth before it was passed through the column. The pre-exchanged broth and resin were then poured on top of the resin column and drained through at a rate of ∼50 mL min−1. As the broth drained through the column additional water was added on top of the broth to ensure that the column did not run dry. This step transferred the sodium counterion from the sodium succinate to the resin and in exchange generated the free succinic acid in solution that drained from the column. In step 3, colored impurities were removed from the cation-exchanged broth with activated carbon by placing the cation exchanged broth in a large glass beaker with 3% w/w activated carbon with vigorous stirring for 4 hours. The carbon was removed via vacuum filtration through a 0.2 μm PTFE filter. In step 4, the succinic acid was dewatered from the decolored broth through adsorption to a poly(vinylpyridine) (PVP) resin. 1.5 L of acidified and activated-carbon-treated broth was loaded onto 623 g of PVP resin in a 1 L glass column. The broth was then drained at a rate of 3 bed per volumes per h until the liquid level was just above the bed of resin. The adsorbed succinic acid was eluted from the PVP resin with 4.5 bed volumes of methanol at a rate of 3 bed per volumes per h. Finally, in step 5, succinic acid was recovered from the methanol solution via evaporative crystallization. The methanol eluent from the PVP resin was concentrated by blowing down the methanol solution with house nitrogen gas until crystals of succinic acid began to form on the flask. The solution was then placed in a cold room (4 °C) overnight. The methanol was removed by vacuum filtration leaving a cake of white crystals (Fig. 8). The succinic acid crystals were then dried in a vacuum oven overnight at 40 °C. Purity was determined via melting point depression as determined by Modulated Digital Scanning Calorimetry (MDSC). Samples were prepared by measuring 20 mg of sample into a TA Instruments Aluminum Hematic T-Zero Pan and placed in a TA Instruments Q200 MDSC. The purified succinic acid crystals were tested from 160 to 200 °C at a ramp rate of 3 °C min−1 with a modulation period of 40 s and a modulation of amplitude of 0.12 °C. Crystallization yield was determined by dividing the mass of succinic acid eluted off the column by the dry weight of succinic acid obtained.Algal oil upgrading
DO and HI experiments were carried out in a continuous flow fixed-bed tubular reactor as described elsewhere.47 Briefly, the catalyst bed was positioned at the center of the reactor tube, with quartz chips filling the reactor tube upstream and downstream of the catalyst bed to facilitate heat transfer and hold the catalyst bed in place. A thermocouple was positioned in the center of the catalyst bed. The crude algae oil was diluted to 25 wt% in hexanes to facilitate pumping, and the mixture was fed to the reactor from an Eldex Optos HPLC pump. The catalyst for the DO stage was a commercial 5 wt% Pd/C, and for the HI stage, a 1 wt% Pt/SAPO-11 prepared by incipient wetness impregnation, each diluted to 20 wt% in SiC. Reaction conditions for the DO stage were 450 °C, 1300 psi H2, 0.1 mL min−1 liquid feed, and 92 sccm H2, corresponding to a Liquid Hourly Space Velocity (LHSV) = 1 h−1, and H2/feed ratio = 1000 Nm3 m−3. After exiting the reactor, the product was passed through a heat exchanger at 55 °C to condense liquid products. Non-condensable products were analyzed by online GC. Liquid products were collected periodically. Prior to the HI stage, the collected liquid products were combined, centrifuged, and decanted to remove product water, and concentrated by rotary evaporation to remove the hexanes diluent. Reaction conditions for the HI stage were 350 °C, 500 psi H2, 0.043 mL min−1 liquid feed, and 92 sccm H2, corresponding to LHSV = 0.5 h−1 and H2/feed ratio = 2325 Nm3 m−3. Reaction products from the HI stage were collected similarly, except the heat exchanger was kept at 40 °C.DO and HI liquid-phase products were characterized by gas chromatography with mass spectrometry (GC-MS) to identify components and qualitatively assess relative abundances of component classes. Samples were diluted 1![[thin space (1/6-em)]](https://www.rsc.org/images/entities/char_2009.gif) :
:![[thin space (1/6-em)]](https://www.rsc.org/images/entities/char_2009.gif) 10 volumetrically with carbon disulfide. An Agilent 7890A GC coupled with an Agilent 5975C mass selective detector (MSD) equipped with a DB-5MS column (5% phenyl-polydimethylsiloxane stationary phase; dimensions: 30 m × 0.25 mm, 0.25 μm df) was used for GC-MS analyses. The injection port temperature was set at 275 °C with column flow rate of 1 mL min−1 and an injection split ratio of 100
10 volumetrically with carbon disulfide. An Agilent 7890A GC coupled with an Agilent 5975C mass selective detector (MSD) equipped with a DB-5MS column (5% phenyl-polydimethylsiloxane stationary phase; dimensions: 30 m × 0.25 mm, 0.25 μm df) was used for GC-MS analyses. The injection port temperature was set at 275 °C with column flow rate of 1 mL min−1 and an injection split ratio of 100![[thin space (1/6-em)]](https://www.rsc.org/images/entities/char_2009.gif) :
:![[thin space (1/6-em)]](https://www.rsc.org/images/entities/char_2009.gif) 1. Injection volume was 0.2 μL. Oven temperature was held at 50 °C followed by a ramp of 10 °C min−1 to a final temperature of 350 °C held for 5 minutes. The MSD was operated in continuous scan mode from m/z 29 to 500 and the transfer line temperature was held at 350 °C. The solvent delay of the MSD was set to start data collection just prior to the retention time of n-heptane to exclude from the results hexanes and carbon disulfide solvents used in DO reactions and sample dilutions, respectively. Peaks detected were tentatively identified by comparison to the NIST 2011 library of mass spectra with NIST MS Search 2.0 software. A standard mixture of n-paraffins ranging from C5 to C44 (ASTM D2887 quantitative standard, Sigma Aldrich) was analyzed prior to samples to confirm proper operation of the GC-MS system and assignments of compounds identified.
1. Injection volume was 0.2 μL. Oven temperature was held at 50 °C followed by a ramp of 10 °C min−1 to a final temperature of 350 °C held for 5 minutes. The MSD was operated in continuous scan mode from m/z 29 to 500 and the transfer line temperature was held at 350 °C. The solvent delay of the MSD was set to start data collection just prior to the retention time of n-heptane to exclude from the results hexanes and carbon disulfide solvents used in DO reactions and sample dilutions, respectively. Peaks detected were tentatively identified by comparison to the NIST 2011 library of mass spectra with NIST MS Search 2.0 software. A standard mixture of n-paraffins ranging from C5 to C44 (ASTM D2887 quantitative standard, Sigma Aldrich) was analyzed prior to samples to confirm proper operation of the GC-MS system and assignments of compounds identified.
Cloud points of HI products were determined by ASTM method D5773. Distillation temperatures of HI products were determined by GC-FID based simulated distillation following ASTM method D2887. Simulated distillation results were adjusted to exclude the hexanes solvent from the distillation profiles. Carbon number distributions of both DO and HI products were determined from the simulated distillation data based on mass percent eluted between retention times of n-paraffin standards (slices) used for boiling point/retention time calibration.
Results and discussion
Pretreatment and flocculation of algal biomass
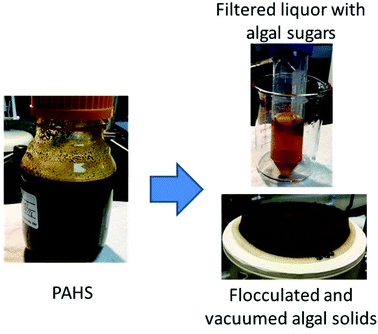
Charged polyamides have been shown to be highly effective for flocculating hydrolyzed lignocellulosic biomass.18,48 We screened 10 KemSep-brand flocculents (Kemira Chemicals, Helsinki, Finland) with a range of charge densities and molecular weights (data not shown) and identified the flocculent KemSep C-7801 as promising for use with PAHS with an effective pH range of 6.1 to 6.5. Flocculation of PAHS after pH adjustment enabled recovery of a clarified filtrate for fermentation while concentrating the insoluble solids for lipid extraction and oil upgrading (Fig. 3).The compositional analyses and solids fractions of the raw algal biomass and process streams are shown in Tables 1 and 2 respectively. The solids content decreased in the PAHS due to dilution to 25% total solids prior to pretreatment and further from the addition of steam during pretreatment. In addition, due to the solubilization of carbohydrates via hydrolysis during pretreatment, the fraction of insoluble solids in the PAHS was reduced to 6.2%, resulting in an easily processed slurry rather than a paste. The total solids of the PAS cake after flocculation increased to 24.9% and contained a high proportion of insoluble solids. The flocculated particles are highly porous and retain fluid, in addition to the fluid contained within the interstitial spaces. Nonetheless, the cake had sufficient structural integrity to hold its shape under the moderate load of vacuum filtration. Pretreatment yields of total and monomeric glucose and mannose present in PAL were calculated (Table 3).
| Ash | Protein | FAME | Glucan | Mannan | |
|---|---|---|---|---|---|
| Raw algal biomass | 1.15 ± 0.4 | 12.9 ± 1.6 | 22.3 ± 1.7 | 34.8 ± 1.2 | 9.5 ± 0.7 |
| PAS | <0.04 | 8.4 ± 1.0 | 61.3 ± 2.0 | 8.5 ± 1.3 | 1.4 ± 0.4 |
| PAS (after flocculation) | 0.5 ± 0.2 | 13.5 ± 0 | 59.4 ± 0.5 | 9.6 ± 0.6 | 2.4 ± 0.2 |
| % Total solids | Fraction insoluble solidsa | % Insoluble solids | % Soluble solids | |
|---|---|---|---|---|
| a Fraction insoluble solids (dry weight of washed solids/dry weight of slurry). b Raw algal biomass being a whole cell paste does not typically contain soluble solids and was thus not analyzed for the fraction insoluble solids. | ||||
| Raw algal biomassb | 33.4 ± 0.2 | — | — | — |
| PAHS | 18.9 ± 0.5 | 0.33 | 6.2 | 12.7 |
| PAS (after flocculation) | 24.9 ± 1.7 | 0.82 | 20.4 | 4.5 |
| Glucose | Mannose | |
|---|---|---|
| Yield % | Yield % | |
| Total | 73.4 ± 7.0 | 89.5 ± 3.6 |
| Monomeric | 66.4 ± 7.3 | 66.3 ± 4.8 |
Low yields of monomeric sugars are likely due to sugar oligomers remaining after incomplete acid hydrolysis. The enriched lipid concentrations in PAS resulted from the solubilization and removal of carbohydrates and proteins with the liquor.
Fermentation organism selection
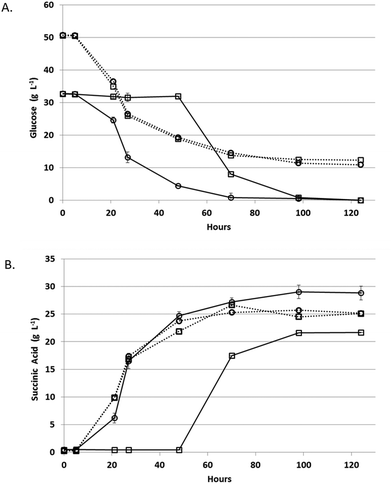
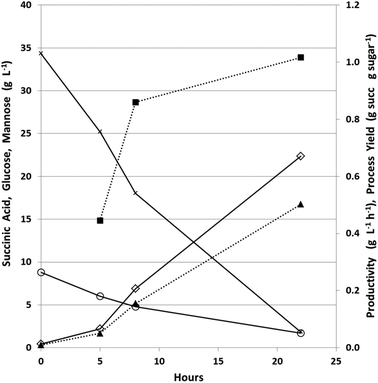
Fermentation rates of A. succinogenes and B. succiniciproducens were compared in PAL to select the most efficient fermentative organism for monomeric sugars present in pretreated algal hydrolysates (Fig. 4). After a short lag, both species began utilizing glucose and producing succinic acid in the pure sugar controls. In PAL, B. succiniciproducens experienced a significant delay prior to succinic acid production while A. succinogenes began producing succinic acid after only a short lag and gave higher titers. Thus, A. succinogenes was chosen as the most advantageous species for continuous fermentation.PAL fermentation and succinic acid purification
The fermenters were run in batch mode for the first 24 hours to establish a high biomass concentration for continuous fermentation. Glucose was nearly completely used in under 24 hours in the fermenter, which is much more rapid than in the bottles used for the strain comparison experiment (Fig. 4A), due to pH-control, CO2 sparging, and better mixing in the fermenter. This initial batch fermentation resulted in a maximum succinic acid productivity and yield of 1.0 g L−1 h−1 and 0.5 g g−1 sugars respectively (Fig. 5) compared to maximum productivity and yield in bottles of 0.39 g L−1 h−1 and 0.59 g g−1 sugars respectively (Table 4).| Batch | |||
|---|---|---|---|
| Productivity (g L−1 h−1) | Yield (g g−1) | Titer (g L−1) | |
| Bottle | 0.39 ± 0.01 | 0.59 ± 0.02 | 27.2 ± 0.73 |
| Fermenter | 1.0 | 0.55 | 22.37 |
| Continuous | |||
|---|---|---|---|
| Dilution rate | Average productivity for dilution rate period (g L−1 h−1) | Average yield for dilution rate period (g g−1) | Average titer for dilution rate period (g L−1) |
| 0.018 | 0.49 ± 0.02 | 0.62 ± 0.04 | 27.80 ± 1.62 |
| 0.020 | 0.58 ± 0.01 | 0.66 ± 0.01 | 29.63 ± 0.70 |
| 0.023 | 0.66 ± 0.02 | 0.64 ± 0.02 | 28.57 ± 0.68 |
| 0.043 | 1.0 ± 0.05 | 0.52 ± 0.03 | 23.03 ± 1.12 |
| 0.052 | 1.06 ± 0.06 | 0.46 ± 0.03 | 20.39 ± 1.19 |
| 0.062 | 1.04 ± 0.03 | 0.38 ± 0.01 | 16.86 ± 0.56 |
| 0.045 | 0.82 ± 0.02 | 0.41 ± 0.01 | 18.16 ± 0.44 |
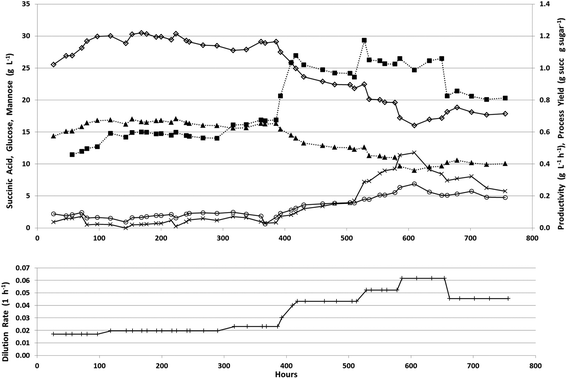
The fermenter was then fed at an initial dilution rate of 0.018 h−1 to start the continuous phase after 24 hours of batch growth. During the continuous fermentation, 7 dilution rates were explored to cover a range sufficient to determine the trade-off between productivity and process yield (Fig. 6).
During the first 390 hours of continuous operation, the dilution rate was increased from 0.018 to 0.023 h−1 with an increase in succinic acid productivity from 0.5 to 0.7 g L−1 h−1 while the process yield remained relatively stable at approximately 0.65 g g−1 total sugars having a maximum titer of 30.5 g L−1 with an average titer of 29.0 g L−1 (Table 4). During this period, changes were observed in biofilm formation inside the fermenter (Fig. 7).
During the first 48 hours, biofilm built up on the sides and bottom of the fermenter. This biofilm slowly decreased and nearly disappeared from the sides of the fermenter by 360 h into the continuous fermentation. We hypothesized that this was due to the near starvation conditions the cells were experiencing at such a low dilution rate and thus doubled the dilution rate. This nearly doubled productivity however both the process yield and concentration of succinic acid decreased markedly (Fig. 6, Table 4). Throughout the final 366 hours, the dilution rate was adjusted several times from 0.043, to 0.052, to 0.062, and finally back down to 0.045 h−1. Initially with the increase in dilution rate to 0.043 h−1, productivity increased to 1.0 g L−1 h−1 and with a further increase in dilution rate to 0.052 h−1, increased slightly to 1.06 g L−1 h−1, however there was no substantial increase above 1.06 g L−1 h−1 even with an increase in dilution rate to 0.062 h−1. During this time, succinic acid concentration was decreasing as sugar concentrations continued to rise in the effluent indicating insufficient residence time for complete fermentation. This higher dilution rate also led to the reestablishment of the biomass attached to the walls and impeller in the fermenter which was greater than the initial amount seen in the first 48 h (Fig. 7). With the increase in unfermented sugars and the decreasing succinic acid concentrations, we lowered the dilution rate to near our previous rate of 0.043 h−1 to try and take advantage of the increased biofilm now present in the fermenter (Fig. 7). A lower dilution rate with increased cell mass could potentially increase sugar consumption, succinic acid concentration, and productivity over the earlier time period that had a similar dilution rate but lower cell mass. Interestingly, when the dilution rate was lowered to 0.045 h−1 (nearly the previous level of 0.043 h−1), sugar consumption and succinic acid production lagged, resulting in a lower productivity than was expected based on our previous observations at 0.043 h−1. Moderate biofilm formation was noted on the agitator at the end of the fermentation (Fig. 2). By examining the culture frequently under the microscope, we monitored the continuous culture for contamination and did not observe at any time cells that did not phenotypically look like A. succinogenes demonstrating that we were able to successfully operate continuously for over 750 hours without loss of active culture due to contamination. Fermentation of acid-pretreated microalgae compared well with fermentation of pretreated macroalgae and other renewable sources. We achieved maximum productivity, yield, and titer of 1.1 g L−1 h−1, 0.7 g g−1 total sugar, and 30.5 g L−1 respectively. Other continuous fermentations of renewable biomass realized higher productivities (3.2 to 3.9 g L−1 h−1) though typically having a lower titer (8–20 g L−1) and yield (0.5–0.7 g g−1 total sugars).3 Our initial batch fermentation resulted in a maximum succinic acid productivity and yield of 1.0 g L−1 h−1 and 0.5 g g−1 sugars respectively. Previous A. succinogenes 130Z batch fermentations of macroalgae achieved productivities of 0.3–3.9 g L−1 h−1 and yields of 0.73–0.92 g g−1 total sugars.13–15 It must be noted that our titer values are a function of the sugar concentration in the PAL and so comparisons with other sugar sources are not necessarily applicable. Our yields and productivity values are lower than those seen with other sugar sources and we attribute that to the higher salt concentration introduced during the pretreatment and neutralization steps. We are evaluating means to reduce the acid load or to remove salt from the hydrolysate, but to date each mitigation approach results in increased costs (e.g. by incorporation of an enzymatic saccharification step to compensate for poor carbohydrate hydrolysis yields which result from less severe pretreatment approaches) that may impact the overall economics more than the low yields and productivities.
Cells and particulate matter were removed from the succinic acid-containing broth exiting the continuous fermentation which was then subjected to a novel crystallization process (described in detail in Materials and methods). This resulted in a 60% yield of succinic acid at a purity of 98.4% (Fig. 8). Our process compared favorably to other purification methods that showed yields of 28–95% with purities of 45–99% from fermentation broths.3
Lipid extraction and upgrading to RDBS
To demonstrate the complete integration of the PAP-SA scheme, lipids were extracted from the wet, flocculated, algal cake using a hexanes extraction with an evaporative hexanes recovery and recycling process. Hexanes were used due to their beneficial properties such as low boiling point, low toxicity, low cost, low density, and low evaporation enthalpy.49 Crude algal oil was recovered at 0.1 ± 0.004 g g−1 yield from the wet flocculated algal cake and used directly for upgrading to a RDBS. To check the purity of the extracted oil, lipids convertible to FAME were measured and found to be 93.4 ± 0.7% of the extracted oil. The overall extraction efficiency of lipids as FAME in the oil was measured at 83.3 ± 3.0% from the PAS cake which contained 46.6 ± 0.4% dry weight lipids as FAMEs. The crude algal oil was diluted to 25 wt% in hexanes and fed into the DO reactor. The total liquid product yield in the DO stage was approximately 77%, including an 8% yield to H2O. Gas-phase products accounted for an additional 10.3%. The remainder was most likely light hydrocarbons (propane, butane, etc.) that were partially condensed at reaction pressure but came out of solution and were lost when the pressure was reduced to collect the liquid sample.50–52 In our bench-scale process demonstration, we used hexanes to extract algal lipids from wet PAS and prior to DO, the hexanes were distilled off for re-use in extraction. However, if scaled, due to the need for hexanes as a carrier in DO, the distillation of the hexanes would occur after DO with recycle to the extraction step. Thus hexanes, though a hazardous solvent, would be used in a closed system with continuous recycling to mitigate its overall consumption. In the HI stage, the liquid yield was roughly 69%, with the remainder likely composed primarily of partially-condensed alkanes (Table 5). Overall, the DO and HI steps led to a 47.6% conversion yield of the crude hexanes-extracted algal oil to fuel-range hydrocarbons as a RDBS.| Product | DO | HI |
|---|---|---|
| a Calculated by difference of the oxygen atom balance. b After 8 h time-on-stream. | ||
| Liquids | ||
| Overall fuel-range hydrocarbons | 69.0% | 69.0% |
| Naphtha-range (C7–C11) | 20.9% | 24.7% |
| Diesel-range (C12+) | 79.1% | 75.3% |
| H2Oa (g g−1 oil) | 8.0% | — |
| Gases | ||
| CO (g g−1 oil) | 3.2% | — |
| CO2 (g g−1 oil) | 3.6% | — |
| Off-gas (C≤5H≤12) | 3.5% | 0.8% |
| Overall mass balance | 87.3% | 69.8% |
| Liquid product cloud point (°C) | 20 | −3.5b |
Within the fuel range hydrocarbons, 20–25% was C7–C12, which suggests that cracking reactions were significant at the relatively severe DO conditions. We selected these conditions based on previous work in which we showed that impurity removal (specifically, nitrogen-containing impurities) from the crude extracted oil is significantly higher at higher DO severity.47 Complete removal of nitrogenous compounds is likely necessary to avoid catalyst poisoning during HI. The fraction of naphtha increased slightly during HI indicating that a small amount of additional cracking occurred over the HI catalyst. DO also removed the majority of pigmented impurities present in the crude algal oil (Fig. 9).
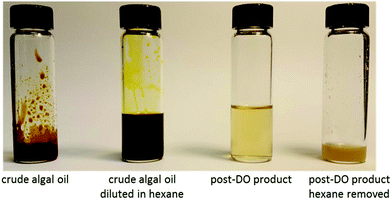 | ||
| Fig. 9 Representative samples of crude algal oil, DO processing steps, and the resulting DO product. | ||
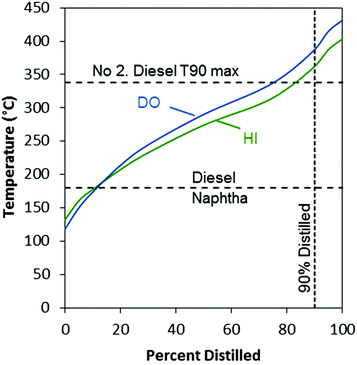
The simulated distillation curves showed that boiling points of the majority of the compounds present in both the DO and HI products were in the diesel range (Fig. 10). The HI product consisted of a mixture of compounds with lower-boiling points compared to the DO product, which is notable at the T50 and T90 of the distillation curve (temperatures at 50% and 90% distilled respectively). The T90 for the HI product was higher than the T90 maximum specification for no. 2 diesel fuel (ASTM D975). This elevated T90 was likely due to the formation of heavy paraffins (C20+) in the DO stage, which can be produced by mechanisms that are not fully understood,47 and were carried through the HI stage.
Phase change analysis of the HI product showed the liquid phase after isomerization to have a cloud point of −3.5 °C. This value is significantly improved from the DO product, which had a cloud point of roughly 20 °C. The reduction in cloud point was largely due to the conversion of normal paraffins to isoparaffins (Fig. 11). The relative contribution of n-paraffins decreased from more than 77% to less than 52%, while the relative contribution of isoparaffins increased from less than 4% to more than 32%. In contrast, the fractions of aromatics, naphthenes, and unidentified compounds remained relatively stable, though there may have been some hydrogenation of aromatics to naphthenics during HI.
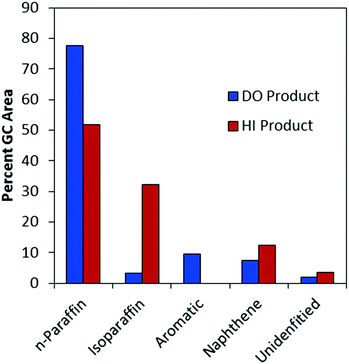 | ||
| Fig. 11 Relative proportions of compound classes in the algae oil DO and HI products. HI product is after 8 h time on stream. | ||
Similar to the high-boiling point compounds that extend the boiling range over the no. 2 diesel T90 maximum discussed above, the same compounds likely limited the effect of the isomerization to lower the cloud point. Longer chain hydrocarbons have higher freezing points which increases cloud point of mixtures in which they are present.20 With respect to the current HI product, fractional distillation to remove the heaviest components would likely improve both the boiling range and the cloud point to produce a finished fuel. Looking forward, the present HI product may be salable as a RDBS without modification, but its value could likely be increased by further optimization of the reaction conditions and catalysts.
Conclusion
In conclusion, we successfully demonstrated a fully integrated parallel algal processing scheme for the conversion of algal biomass into both a RDBS and succinic acid. This demonstration is a significant step forward towards enabling economic conversion of algal biomass to finished products in a commercial biorefinery. Several process improvements streamlining the overall process were noted. A solid–liquid separation utilizing flocculation of PAHS allowed for reduced energy inputs for effective separation and recovery of monomeric sugars from lipid-containing solids. In addition, the flocculant did not have any deleterious effects on either lipid recovery or fermentation. Continuous fermentation of PAL produced succinic acid at a titer, yield, and rate comparable to previous reports and was effectively recovered from fermentation broth in high purity. We also demonstrated lipid extraction using hexanes including a recycle step with subsequent conversion by deoxygenation and hydroisomerization to produce a RDBS. In addition, by utilizing a Pd/C catalyst for DO rather than the conventional sulfide catalyst, the need to co-feed hazardous H2S having the potential for sulfur leaching into the final product was eliminated and is thus beneficial in reducing SO2 emissions when the fuel is combusted.Finally, the data from this demonstration has been used as inputs for the NREL techno-economic model previously used to evaluate other process configurations that employed fermentation of algal sugars to ethanol rather than succinic acid.1,16 The substitution of the value-added chemical succinic acid for the low-value biofuel ethanol has been shown to result in a significant improvement in the overall process economics, despite our sub-optimal yields and complex succinic acid purification scheme.53 Future work will focus on optimization of the various unit operations to further reduce costs, as well as an incorporation of this process into a harmonized techno-economic, life-cycle, and resource assessment evaluation.
Conflicts of interest
The authors have no conflicts of interest to declare.Acknowledgements
The authors would like to acknowledge Drs John McGowen and Thomas Dempster (AzCATI, ASU, Mesa, AZ) for the algal biomass, Michelle Reed and Kailee Potter (NREL, National Bioenergy Center) for compositional analysis, and Ryan Davis and Jennifer Markham (NREL, National Bioenergy Center) for helpful techno-economic analysis discussions. This work was supported by the U.S. Department of Energy under Contract no. DE-AC36-08GO28308 with the National Renewable Energy Laboratory. Funding was provided by U.S. DOE Office of Energy Efficiency and Renewable Energy, Bioenergy Technologies Office. The U.S. Government retains and the publisher, by accepting the article for publication, acknowledges that the U.S. Government retains a nonexclusive, paid-up, irrevocable, worldwide license to publish or reproduce the published form of this work, or allow others to do so, for U.S. Government purposes.References
- L. M. L. Laurens, N. Nagle, R. Davis, N. Sweeney, S. Van Wychen, A. Lowell and P. T. Pienkos, Green Chem., 2015, 17, 1145–1158 RSC.
- M. J. Biddy, R. Davis, D. Humbird, L. Tao, N. Dowe, M. T. Guarnieri, J. G. Linger, E. M. Karp, D. Salvachua, D. R. Vardon and G. T. Beckham, ACS Sustainable Chem. Eng., 2016, 4, 3196–3211 CrossRef CAS.
- C. Pateraki, M. Patsalou, A. Vlysidis, N. Kopsahelis, C. Webb, A. Koutinas and M. Koutinas, Biochem. Eng. J., 2016, 112, 285–303 CrossRef CAS.
- J. G. Zeikus, M. K. Jain and P. Elankovan, Appl. Microbiol. Biotechnol., 1999, 51, 545–552 CrossRef CAS.
- E. P. Knoshaug and A. Darzins, Chem. Eng. Prog., 2011, 107, 37–47 CAS.
- P. T. Pienkos and A. Darzins, Biofuels, Bioprod. Biorefin., 2009, 3, 431–440 CrossRef CAS.
- K. M. Weyer, D. R. Bush, A. Darzins and B. D. Willson, BioEnergy Res., 2010, 3, 204–213 CrossRef CAS.
- J. C. Philp, R. J. Ritchie and J. E. M. Allan, Trends Biotechnol., 2013, 31, 219–222 CrossRef CAS PubMed.
- A. Maziere, P. Prinsen, A. Garcia, R. Luque and C. Len, Biofuels, Bioprod. Biorefin., 2017, 11, 908–931 CrossRef CAS.
- P. Kuhnert, E. Scholten, S. Haefner, D. Mayor and J. Frey, Int. J. Syst. Evol. Microbiol., 2010, 60, 44–50 CrossRef CAS PubMed.
- D. Salvachua, A. Mohagheghi, H. Smith, M. F. Bradfield, W. Nicol, B. A. Black, M. J. Biddy, N. Dowe and G. T. Beckham, Biotechnol. Biofuels, 2016, 9, 28 CrossRef PubMed.
- E. Scholten, T. Renz and J. Thomas, Biotechnol. Lett., 2009, 31, 1947–1951 CrossRef CAS PubMed.
- M. Alvarado-Morales, I. B. Gunnarsson, I. A. Fotidis, E. Vasilakou, G. Lyberatos and I. Angelidaki, Algal Res., 2015, 9, 126–132 CrossRef.
- G. S. Marinho, M. Alvarado-Morales and I. Angelidaki, Algal Res., 2016, 16, 102–109 CrossRef.
- A. M. Olajuyin, M. Yang, Y. Liu, T. Mu, J. Tian, O. A. Adaramoye and J. Xing, Bioresour. Technol., 2016, 214, 653–659 CrossRef CAS PubMed.
- T. Dong, E. P. Knoshaug, R. Davis, L. M. L. Laurens, S. Van Wychen, P. T. Pienkos and N. Nagle, Algal Res., 2016, 19, 316–323 CrossRef.
- J. B. McKinlay, C. Vieille and J. G. Zeikus, Appl. Microbiol. Biotechnol., 2007, 76, 727–740 CrossRef CAS PubMed.
- D. A. Sievers, J. J. Lischescke, M. J. Biddy and J. J. Stickel, Bioresour. Technol., 2015, 187, 37–42 CrossRef CAS PubMed.
- G. Knothe, Prog. Energy Combust. Sci., 2010, 36, 364–373 CrossRef CAS.
- T. G. Smagala, E. Christensen, K. M. Christison, R. E. Mohler, E. Gjersing and R. L. McCormick, Energy Fuels, 2013, 27, 237–246 CrossRef CAS.
- E. Warner, A. Schwab and D. Bacovsky, NREL/TP-6A10-67539, 2017.
- Q. Hu, M. Sommerfeld, E. Jarvis, M. Ghirardi, M. Posewitz, M. Seibert and A. Darzins, Plant J., 2008, 54, 621–639 CrossRef CAS PubMed.
- R. Loe, E. Santillan-Jimenez, T. Morgan, L. Sewell, Y. Ji, S. Jones, M. A. Isaacs, A. F. Lee and M. Crocker, Appl. Catal., B, 2016, 191, 147–156 CrossRef CAS.
- B. Peng, C. Yao, C. Zhao and J. A. Lercher, Angew. Chem., Int. Ed., 2012, 124, 2114–2117 CrossRef.
- B. Peng, X. Yuan, C. Zhao and J. A. Lercher, J. Am. Chem. Soc., 2012, 134, 9400–9405 CrossRef CAS PubMed.
- H. J. Robota, J. C. Alger and L. Shafer, Energy Fuels, 2013, 27, 985–996 CrossRef CAS.
- E. Santillan-Jimenez, T. Morgan, R. Loe and M. Crocker, Catal. Today, 2015, 258, 284–293 CrossRef CAS.
- W. Song, C. Zhao and J. A. Lercher, Chem. – Eur. J., 2013, 19, 9833–9842 CrossRef CAS PubMed.
- C. Wang, Q. Liu, J. Song, W. Li, P. Li, R. Xu, H. Ma and Z. Tian, Catal. Today, 2014, 234, 153–160 CrossRef CAS.
- L. Zhou and A. Lawal, Catal. Sci. Technol., 2016, 6, 1442–1454 CAS.
- J. Han, H. Sun, Y. Ding, H. Lou and X. Zheng, Green Chem., 2010, 12, 463–467 RSC.
- J. Hancsok, S. Kovacs, G. Polczmann and T. Kasza, Top. Catal., 2011, 54, 1094–1101 CrossRef CAS.
- I. Kubickova, M. Snare, K. Eranen, P. Maki-Arvela and D. Y. Murzin, Catal. Today, 2005, 106, 197–200 CrossRef CAS.
- S. Lestari, P. Maki-Arvela, H. Bernas, O. Simakova, R. Sjoholm, J. Beltramini, G. M. Lu, J. Myllyoja, I. Simakova and D. Y. Murzin, Energy Fuels, 2009, 23, 3842–3845 CrossRef CAS.
- M. Rabaev, M. V. Landau, R. Vidruk-Nehemya, A. Goldbourt and M. Herskowitz, J. Catal., 2015, 332, 164–176 CrossRef CAS.
- C. Wang, Z. Tian, L. Wang, R. Xu, Q. Liu, W. Qu, H. Ma and B. Wang, ChemSusChem, 2012, 5, 1974–1983 CrossRef CAS PubMed.
- L. M. L. Laurens, NREL/TP-5100-60943, 2013.
- L. M. L. Laurens, M. Quinn, S. Van Wychen, D. W. Templeton and E. J. Wolfrum, Anal. Bioanal. Chem., 2012, 403, 167–178 CrossRef CAS PubMed.
- S. Van Wychen and L. M. L. Laurens, NREL/TP-5100-60956, 2013.
- S. Van Wychen and L. M. L. Laurens, NREL/TP-5100-60957, 2013.
- S. Van Wychen, K. Ramirez and L. M. L. Laurens, NREL/TP-5100-60958, 2013.
- M. V. Guettler, D. Rumler and M. K. Jain, Int. J. Syst. Bacteriol., 1999, 49, 207–216 CrossRef CAS PubMed.
- D. Salvachua, H. Smith, P. C. St. John, A. Mohagheghi, D. J. Peterson, B. A. Black, N. Dowe and G. T. Beckham, Bioresour. Technol., 2016, 214, 558–566 CrossRef CAS PubMed.
- W. Zou, L.-W. Zhu, H.-M. Li and Y.-J. Tang, Microb. Cell Fact., 2011, 10, 87 CrossRef CAS PubMed.
- M. F. Bradfield, A. Mohagheghi, D. Salvachua, H. Smith, B. A. Black, N. Dowe, G. T. Beckham and W. Nicol, Biotechnol. Biofuels, 2015, 8, 558–566 Search PubMed.
- S. J. Gerberding and R. Singh, US Pat., 2010062635, 2011 Search PubMed.
- J. S. Kruger, E. D. Christensen, T. Dong, S. Van Wychen, G. M. Fioroni, P. T. Pienkos and R. L. McCormick, Energy Fuels, 2017, 31, 10946–10953 Search PubMed.
- D. R. Burke, J. Anderson, P. C. Gilcrease and T. J. Menkhaus, Biomass Bioenergy, 2011, 35, 391–401 CrossRef CAS.
- T. Dong, E. P. Knoshaug, P. T. Pienkos and L. M. L. Laurens, Appl. Energy, 2016, 177, 879–895 CrossRef CAS.
- G. W. Nederbragt, Ind. Eng. Chem., 1938, 30, 587–588 CrossRef CAS.
- J. V. Ribeiro, A. A. Susu and J. P. Kohn, J. Chem. Eng. Data, 1972, 17, 279–280 CrossRef CAS.
- G. Sivalingam, V. Natarajan, K. R. Sarma and U. Parasuveera, Ind. Eng. Chem. Res., 2008, 47, 8940–8946 CrossRef CAS.
- R. Davis, DOE Bioenergy Technologies Office (BETO) 2017 Project Peer Review, 2017, https://energy.gov/sites/prod/files/2017/05/f34/algae_davis_131200.pdf.
| This journal is © The Royal Society of Chemistry 2018 |

