A kinetic study of the gas-phase reactions of 1-methylsilacyclobutane in hot wire chemical vapor deposition
Ismail
Badran†
and
Yujun
Shi
 *
*
Department of Chemistry, University of Calgary, Calgary, Alberta T2N 1N4, Canada. E-mail: shiy@ucalgary.ca; Tel: +1 403 210 8674
First published on 16th November 2017
Abstract
The reaction kinetics of the decomposition of 1-methylsilacyclobutane (MSCB) in a hot wire chemical vapor deposition (HWCVD) reactor was investigated. The stable reaction products were monitored using vacuum ultraviolet laser single photon ionization in tandem with time-of-flight mass spectrometry. Steady-state approximation was used to determine the rate constants of three individual decomposition pathways of MSCB, i.e., cycloreversion to form ethene and methylsilene (R1), ring opening to form propene and methylsilylene (R2), and exocyclic Si–CH3 bond cleavage to form ˙CH3 radicals (R3). The activation energies (Ea) for R2 and R3 in a HWCVD reactor were determined to be 86.6 kJ mol−1 and 106 kJ mol−1, respectively. The fact that these Ea values are close to those obtained for the MSCB decomposition on metal surfaces under collision-free conditions indicates that the heterogeneous reactions on the hot wire surface govern the gas-phase reaction kinetics in the HWCVD reactor. In addition, the Ea values obtained from a theoretical study of the decomposition kinetics using ab initio calculations at the CCSD(T)/6-311++G(3d,2p)//MP2/6-311++G(d,p) level were 62.9 kcal mol−1 (i.e., 263 kJ mol−1), 62.0 kcal mol−1 (i.e., 259 kJ mol−1), and 86.2 kcal mol−1 (i.e., 361 kJ mol−1) for R1, R2, and R3, respectively. The much lower experimental Ea values compared with those from the theoretical calculations clearly suggest that the tungsten filament in the HWCVD reactor catalyzed the decomposition.
1. Introduction
Hot wire chemical vapor deposition (HWCVD), also known as catalytic chemical vapor deposition (Cat-CVD), has progressed greatly in research and development since its birth in the late 1980s.1,2 The technology has been used to deposit high-quality thin films and nanostructures for applications in solar cells, microelectronics/organic electronics, and membranes.3–5 Despite the extensive research on the process optimization in HWCVD, much less attention has been focused on the gas-phase reactions and the growth kinetics governing the deposition. Therefore, more work needs to be done before a complete understanding of the HWCVD process can be achieved.6 In addition, implementation of the technology at the industrial level requires good understanding of the gas-phase reaction kinetics since improvements in both the efficiency and profitability of the process rely heavily on the knowledge of the chemical reaction rates and their dependence on concentration, pressure, and temperature.7One of the most common thin film materials manufactured by HWCVD is silicon carbide (SixC1−x), which is well known for its superior chemical, physical, and electrical properties, as well as its wide variety of applications. Conventionally, a mixture of two separate gas sources for Si and C were used. Later, single-source precursors, e.g., open-chain alkylsilanes (mono-, di-, and tri-methylsilane) began to replace the conventional mixtures of SiH4 and CH4 to lower the temperature for SixC1−x growth.8,9 For the last few years, our research laboratory has been investigating the gas-phase reaction chemistry of single-source precursors including open-chain alkylsilanes10–13 and four-membered-ring silacyclobutane molecules.10,14,15 Both types of compound contain Si–C bond(s) within their structures, the latter of which is a group of compounds that have high ring strain to facilitate their dissociation on the hot metal wire so they decompose at lower filament temperatures than the conventional sources.
1-Methylsilacyclobutane (MSCB) is a four-membered-ring compound with a unique structure that contains both Si–H and Si–CH3 bonds; therefore, it can be regarded as the bridge between silacyclobutane (SCB) and 1,1-dimethylsilacyclobutane (DMSCB). Our previous study on the gas-phase reaction chemistry of MSCB in a HWCVD process has shown that the cyclic molecule decomposes on the hot filament via three different pathways under low-pressure conditions: (1) cycloreversion to form ethene and 1-methylsilene (R1); (2) ring opening initiated by 1,2-H shift to form propene and methylsilylene (R2); and (3) exocyclic homolytic bond rupture to form methyl and silacyclobutane-1-yl radicals (R3).16 The three reactions are illustrated in Scheme 1.
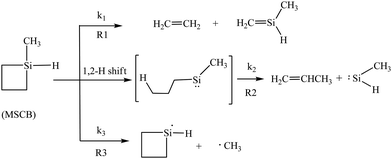 | ||
| Scheme 1 The decomposition pathways of MSCB on a hot W filament initiating the gas-phase reactions in a HWCVD reactor. | ||
In a HWCVD reactor, where typical deposition pressures ranging from tens of milliTorr to several Torr are used, secondary gas-phase reactions following the primary decomposition on the hot wire were also detected. Our previous work has shown that the secondary gas-phase reactions are characterized by the free radical chain reactions and the cycloaddition of silene species.16 The main stable product from the radical chain reactions is 1,1′-bis(silacyclobutane) (bisSCB, 142 amu) from the self-recombination of the silacyclobutane-1-yl radicals produced in R3 in Scheme 1. Silenes are very reactive species, and once produced, they undergo various reactions to form stable products. The main products detected from the silene addition reactions are 1,3-dimethyl-1,3-disilacyclobutane (DMDSCB, 116 amu), 1-methyl-1,3-disilacyclobutane (MDSCB, 102 amu), and 1,3-disilacyclobutane (DSCB, 88 amu), originating from the self- and cross-cycloaddition of methylsilene (from R1) and silene (isomerized from methylsilylene produced via R2).
In order to provide a quantitative overview on the different decomposition pathways of MSCB, the rate constants for each pathway need to be determined experimentally. In this work, we present a kinetic study for the gas-phase reactions of MSCB in a HWCVD reactor. The steady-state approximation method was used to deduce the rate constants of the main decomposition pathways. The activation energies for each individual decomposition pathway were determined from the study of rate constants at different temperatures. We have also performed theoretical calculations of the activation energies for the three decomposition pathways using the 2nd order Møller–Plesset perturbation theory (MP2) and the coupled cluster method with single, double, and perturbative triple excitations (CCSD(T)). A comparison of the kinetic data obtained from the experimental study in this work with those from the theoretical calculations helps answer the question of whether or not these decomposition reactions are catalytic in nature. Furthermore, the activation energies obtained from this kinetic study were compared with those determined under the low-pressure collision-free conditions to understand whether the reactions in the HWCVD reactor are governed by heterogeneous reactions on the hot filament surface or the reactions in the gas phase.
2. Experimental details
2.1 Experimental methodology
The experimental setup of the HWCVD reactor, laser ionization source, and time-of-flight mass spectrometer (TOF-MS) used in this study was described elsewhere.10,11,14 Only a brief description is provided here. A stainless-steel HWCVD reactor, where a 10 cm tungsten filament (D = 0.5 mm, 99.9+%, Aldrich) was placed, was connected through a small pin hole (D = 0.15 mm) to the ionization chamber housing the TOF-MS (R. M. Jordan). The stable gas-phase reaction products exited the reactor through the pinhole into the ionization chamber, where they were ionized by a vacuum ultraviolet (VUV) wavelength of 118 nm (10.5 eV) in a single photon ionization (SPI) process and detected by the TOF-MS. The 118 nm VUV radiation was generated by frequency tripling the 355 nm output from an Nd:YAG laser (Spectra Physics) in a gas cell containing 210 Torr of a gaseous mixture of Xe and Ar with a pressure ratio of 10![[thin space (1/6-em)]](https://www.rsc.org/images/entities/char_2009.gif) :
:![[thin space (1/6-em)]](https://www.rsc.org/images/entities/char_2009.gif) 1.10,17 The gas pressure inside the HWCVD reactor was controlled using a mass flow controller (MKS, type 1179A) and monitored by a capacitance manometer (MKS, Baratron). The temperature of the resistively heated filament was measured by a two-color pyrometer (Chino Works). The operating pressure in the ionization chamber and the filament temperature were recorded using a home-written LabView® program.
1.10,17 The gas pressure inside the HWCVD reactor was controlled using a mass flow controller (MKS, type 1179A) and monitored by a capacitance manometer (MKS, Baratron). The temperature of the resistively heated filament was measured by a two-color pyrometer (Chino Works). The operating pressure in the ionization chamber and the filament temperature were recorded using a home-written LabView® program.
MSCB was synthesized following an established procedure as described in the literature.16,18 Briefly, 1-chloro-1-methylsilacyclobutane (MSCB-Cl) was first prepared by Wurtz-type coupling of 3-chloropropylmethyl-dichlorosilane (Gelest, 97%).19 This was followed by the reduction of MSCB-Cl using LiAlH4 (Alfa Aesar, 97%) to produce MSCB. The structure and purity (>98%) of MSCB was examined by GC-MS, 1H NMR, 13C NMR, and our TOF-MS. The impurity was mainly from the solvent (diethyl ether) used during the synthesis. The liquid sample of MSCB was degassed using several cycles of freeze–pump–thaw before the room-temperature MSCB vapor was introduced into a 2.25 L cylinder to make a 1% gaseous mixture with He (99.999%, Praxair).
The kinetic investigation of the gas-phase reactions of MSCB in HWCVD was performed under steady-state flow using the reactor setup described above. Filament temperatures ranging from 1000 to 1400 °C were studied at increments of 50 °C. For each kinetic run at a different temperature, the reactor was filled with 10 Torr of 1% MSCB/He and a mass spectrum was collected every 1–2 min after the filament was turned on for a period of up to 60 min. A calibration curve to relate the peak intensity to its concentration was constructed for each kinetic run. This was done by recording the room-temperature mass spectra of the 1% MSCB/He sample in the reactor at each of the pressures of 5, 10, 15, 20, and 25 Torr, which corresponds to a partial pressure of MSCB at 0.05, 0.1, 0.15, 0.20, and 0.25 Torr, respectively. From the calibration line thus obtained, the concentration of MCB, in units of mol L−1, can be determined.20 Since the ionization cross sections when using the non-resonant single-photon ionization with a VUV photon tend to be uniform from molecule to molecule,21,22 the concentrations of the stable gaseous products generated by the gas-phase reactions in the reactor were also calculated from the same calibration line. This practice was employed in similar kinetic studies on acetone23 and methyltrichlorosilane.24 A fresh filament was replaced for each kinetic run at a specified temperature. Before sample introduction into the reactor, the filament was etched at 2000 °C for 60 min using 10 Torr of 10% H2 in He mixture.
The individual rate constants for the main decomposition pathways were determined by applying the steady-state approximation method to the reactive intermediates, e.g., radicals and silenes, in the reaction mechanism. In this way, the rate constant (k) for a given decomposition pathway can be written in terms of the steady-state rates of formation of the stable products.20,23,24 The steady-state rates of formation (Rss) were determined by plotting the concentration (in mol L−1) for each of the main stable products as a function of reaction time in seconds. In most of the experiments performed in this work, an initial rise in the concentration of the stable product was observed, followed by a decrease in the concentration mainly due to their further decomposition. Therefore, Rss was obtained by linear fitting the rising part of the plot.
2.2 Theoretical calculations
All the calculations in this work were performed using the Gaussian 09 package.25 Details on the theoretical calculations of reaction kinetics and thermochemistry of a specific decomposition pathway were described previously.26,27 The geometry of all species involved in this work was optimized at the MP2/6-311++G(d,p) level of theory in their singlet state unless stated otherwise. Transition states were located by exploring the potential energy surface (PES) along the expected reaction coordinate, followed by a transition state optimization for the highest point in the PES. All the transition states were confirmed to have one imaginary frequency. The intrinsic reaction coordinate (IRC) was used to confirm that each TS connects the two desired minima. Single point energies of all optimized geometries of the reactant, intermediates, products, and transition states were calculated at the CCSD(T)/6-311++G(3d,2p) level of theory. The full notation for the calculation method used in this work is referred to herein as CCSD(T)/6-311++G(3d,2p)//MP2/6-311++G(d,p). In order to validate the transition states at the CCSD(T) level, the maximum energy at the CCSD(T)/6-311++G(3d,2p) level along the reaction path was calculated using the IRCMAX method. Zero-point energies (ZPE) were computed at the MP2/6-311++G(d,p) level of theory and were scaled by a factor of 0.9748 as suggested by Scott and Radom.283. Results and discussion
3.1 Determining the gas temperature inside the HWCVD reactor
To determine the temperature of gases inside the HWCVD reactor, a model developed by Mankelevich et al.29 was implemented. In this model, the temperature distribution T(r) of a gas as a function of distance (r) away from a hot filament is represented by| T(r) = Tnf [1 − (1 − (TL/Tnf)2)ln(r/Rf)/ln(L/Rf)]1/2 | (1) |
 | (2) |
| Filament temp. (K) | Gas temp. (K) | k 1 × 10⁵ (s−1) | k 2 × 10⁵ (s−1) | k 3 × 10⁵ (s−1) | k overall × 105 (s−1) |
|---|---|---|---|---|---|
| 1423 | 646 | 1.51 | 0.123 | 0.232 | 25.0 |
| 1473 | 669 | 1.37 | 0.203 | 0.719 | 53.0 |
| 1523 | 687 | 2.32 | 0.267 | 1.20 | 49.0 |
| 1573 | 708 | 2.52 | 0.334 | 1.30 | 84.0 |
| 1623 | 728 | 2.32 | 0.984 | 2.63 | 91.0 |
3.2 Rate constants of gas-phase reaction with MSCB in the HWCVD reactor
The rate constants for the overall decay of MSCB as well as each of the three primary decomposition reactions of MSCB shown in Scheme 1 were investigated in the filament temperature range of 1000–1400 °C (i.e., 1273–1673 K) at 50 °C (K) intervals. However, the reactions were either very slow at Tf < 1150 °C or too fast at Tf > 1350 °C. Hence, the rate constants were only determined in the range of 1150 °C (1423 K) ≤ Tf ≤ 1350 °C (1623 K). This corresponds to a gas temperature of 646–728 K according to Mankelevich's temperature model as described above.In the experiments performed using 1% MSCB/He in the reactor at each of the constant Tf values, the MSCB peak intensity showed a first-order exponential decay. This is in agreement with the results obtained from the pyrolysis of MSCB reported by Conlin et al.35Fig. 1 shows a representative plot of the natural logarithm of the MSCB parent ion intensity, I(MSCB), as a function of reaction time. From the plot, the first-order decay constant, which represents the overall decomposition rates of MSCB (koverall), can be obtained. The values of koverall at different temperatures are tabulated in the last column of Table 1.
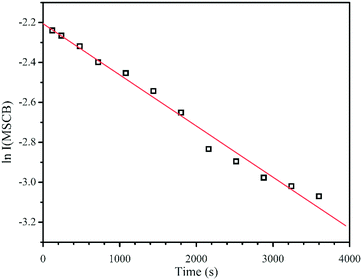 | ||
| Fig. 1 First-order decay of MSCB in a HWCVD reactor at a W filament temperature of 1150 °C (1423 K). | ||
As described in Section 1, the decomposition of MSCB on a hot W filament follows three pathways as represented by Scheme 1. In R1 and R2, stable products of ethene and propene were produced, respectively. Of the two products, the intensity of the propene peak is high, allowing the determination of the rate constant of the ring-opening reaction (R2) from the steady-state rate of formation of propene by eqn (3).
 | (3) |
The rate constants of cyclorevesion (R1) and radical formation via homolytic cleavage (R3) can be determined from the steady-state rate of formation for the stable products originating from the reactive intermediates involved in the two reactions. Under the operating MSCB pressure of 0.10 Torr in the reactor, the main stable products involving the 1-methylsilene intermediate are methyl-substituted 1,3-disilacyclobutanes, including DMDSCB and MDSCB from the silene addition reactions. 1,1′-Bis(silacyclobutane) is the product from the radical chain reactions involving the silacyclobutane-1-yl radical intermediate. By applying the steady-state approximation to the two reaction intermediates, i.e., 1-methylsilene (R1) and silacyclobutane-1-yl radical (R3), the rate constants, k1 (cycloreversion) and k3 (homolytic cleavage), can be obtained using eqn (4) and (5), respectively.
 | (4) |
 | (5) |
These steady-state rates were obtained by plotting the concentration of the respective product in units of mol L−1 as a function of reaction time in seconds, followed by linear fitting of the rising part of the plots. Fig. 2 shows the plots to obtain the rates of formation for the stable products of propene, MDSCB, DMDSCB, and bisSCB for 10 Torr of 1% MSCB at Tf of 1200 °C. The rate constants, k1, k2, and k3, were then obtained by using eqn (3)–(5). These values are also tabulated in Table 1.
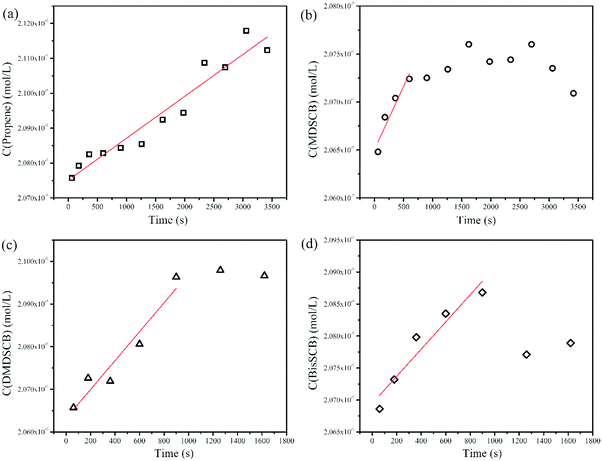 | ||
| Fig. 2 Rates of formation of the stable products of (a) propene, (b) MDSCB, (c) DMDSCB, and (d) bisSCB from 10 Torr of 1% MSCB/He in the HWCVD reactor at a W filament temperature of 1200 °C. | ||
3.3 Temperature dependence of the rate constants
The temperature dependence of the overall decay rate constant of MSCB, koverall, showed that it follows an Arrhenius behavior. This is shown in Fig. 3. The horizontal axis in each plot represents the reciprocal of the gas temperature in Kelvin, calculated for each filament temperature as explained before. The corresponding activation energy (Ea) for the overall decomposition of MSCB was determined to be 59.3 kJ mol−1 (Ea,overall). This value is much lower than the one obtained from the pyrolysis of MSCB at 247 kJ mol−1 reported by Conlin and Kwak.35 This suggests that the W filament plays a role in the MSCB decomposition in the HWCVD reactor.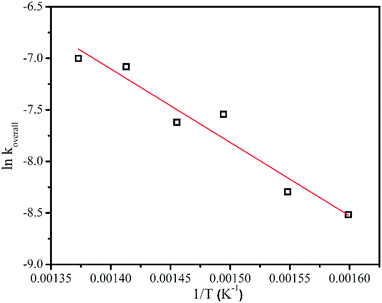 | ||
| Fig. 3 The Arrhenius plot for the overall decomposition of 1% MSCB at a reactor pressure of 10 Torr. Linear fit to the data is shown. | ||
Among the three rate constants for each individual decomposition pathway, i.e., k1, k2, and k3, only those for the ring opening (k2) and the homolytic cleavage (k3) have shown Arrhenius behavior within the studied filament temperature range of 1423–1623 K. The Arrhenius plots for k2 and k3 are shown in Fig. 4. The corresponding Ea's for the ring opening and the homolytic cleavage from free radicals from MSCB were determined to be 86.6 kJ mol−1 (Ea,2) and 106 kJ mol−1 (Ea,3), respectively. The Ea values for these two primary decomposition pathways on a hot wire have been determined to be 68.3 kJ mol−1 (Ea,2) and 46.7 kJ mol−1 (Ea,3) from our previous work under collision-free conditions, where the reactions in the gas phase were not possible. Therefore, the previously obtained Ea values were due to the heterogeneous reactions on the metal surfaces. The reactions in the current reactor setup at much higher pressures relative to the collision-free conditions are more complex involving both the heterogeneous reactions on the wire surfaces and the reactions in the gas phase. In order to shed more light onto the three decomposition pathways of MSCB, we performed a theoretical study of these decomposition reactions in the gas phase to better understand the difference between the activation energies measured in the reactor environment and those obtained under collision-free conditions.
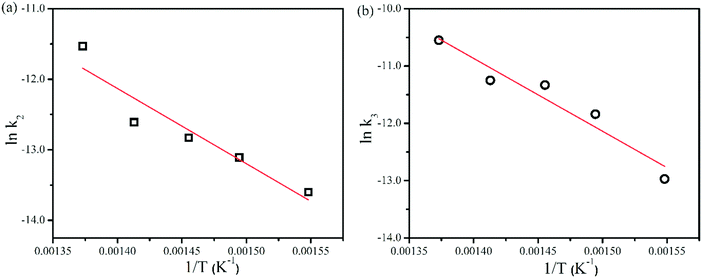 | ||
| Fig. 4 Arrhenius plots for the ring opening and free radical formation for 1% MSCB at a reactor pressure of 10 Torr. Linear fit to the data is shown. | ||
3.4 Theoretical calculations of the gas-phase decomposition reactions of MSCB
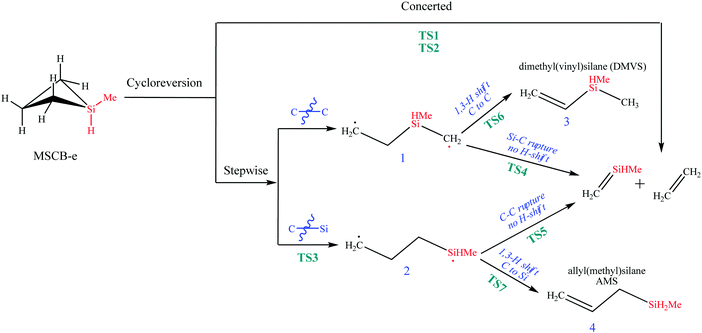
In general, the decomposition reactions of silacylobutane molecules are divided into two main categories: endocyclic and exocyclic.36 Endocyclic reactions include [2+2] cycloreversion to produce two olefins, or a ring opening via a 1,2-H shift from Si to C atoms to form an open-chain silylene intermediate, followed by its decomposition to form more stable products of silylene and propene. The exocyclic reactions, on the other hand, involve different types of reactions centered on the Si and C atoms. These reactions involve free radical formations and molecular eliminations of H2 or methane. In this work, we studied both types of these reactions.Interestingly, two transition states were found for the concerted cycloreversion of MSCB-e into ethene and methylsilene. They are labeled as TS1 and TS2, and their optimized geometries are shown in Fig. 5. The single imaginary frequencies for the two transition states were 326.2i cm−1 and 358.1i cm−1, respectively. The geometry of TS1 agrees well with the one obtained recently by Shiroudi and Zahedi using DFT methods (structure parameters shown in parentheses in Fig. 5 for comparison).38 To the best of our knowledge, TS2 has never been reported in the literature, either for MSCB or any other methyl substituted SCBs. The two transition states for the cycloreversion can be thought of as the same for the cycloaddition process, as stated in the principle of microscopic reversibility.39 As Fig. 5 shows, the fundamental difference between the two transition states is the orientation at which ethene is approaching methylsilene to complete the cycloaddition. In TS1, ethene is almost parallel to the methylsilene (4.8°), but it is twisted by 63.4° in TS2 (Fig. 5b). Later, we will show that TS2 plays an important role in the stepwise cycloreversion of MSCB.
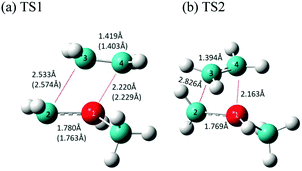 | ||
| Fig. 5 Optimized structure of the transition states (a) TS1 and (b) TS2 involved in the concerted [2+2] cycloreversion of MSCB. The values in parentheses are obtained from ref. 38 at the B3LYP/6-311G** level of theory. The numbers shown are for bond distances between heavy atoms. | ||
There was a long debate on whether the stepwise cycloreversion of SCBs proceeds via a C–C or Si–C bond rupture.15,40,41 Gordon et al. showed that a C–C rupture is preferred for the cycloreversion of the parent SCB molecule in his theoretical study using CASSCF methods.41 Their theoretical prediction was proved by Tong and Shi in their experimental investigation of DMSCB in a HWCVD reactor using deuterium labeling.15 At the MP2/6-311++G(d,p) level of theory, we have located the transition state for the stepwise [2+2] cycloreversion of MSCB-evia Si–C rupture. This transition state is labeled as TS3 (176.6i cm−1) and its optimized geometry is shown in Fig. 6a. All the attempts to locate a transition state that connects MSCB-e with diradical 1 formed by a C–C bond cleavage at the MP2/6-311++G(d,p) level of theory have failed. Gordon et al. determined that this type of transition state was not likely to exist at higher levels of theory.41 Nonetheless, looking at the structure of the transition state TS1 in Fig. 5, the central C–C (C2–C3) bond distance (2.533 Å) is longer than the Si1–C4 distance (2.220 Å). The difference is even higher in the case of the newly discovered transition state TS2 (2.862 Å for C2–C3, and 2.163 Å for Si1–C4). This indicates that both the transition states are of the asynchronous type, where a C–C rupture precedes the Si–C bond rupture. The progress of the intrinsic reaction coordinate (IRC) of both the transition states unambiguously confirms this finding.
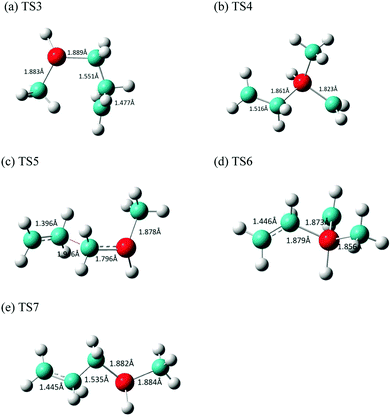 | ||
| Fig. 6 Optimized structures of the transition states (a) TS3, (b) TS4, (c) TS5, (d) TS6, and (e) TS7 involved in the stepwise [2+2] cycloreversion of MSCB. | ||
The transition states connecting the two diradicals, 1 and 2, to the final products of ethene and methylsilene are labeled as TS4 (321.2i cm−1) and TS5 (612.0i cm−1), respectively. Their imaginary frequencies correspond to those for the stretching of the central Si–C and C–C bond, respectively. The optimized structures for these two TS's as well as TS6 and TS7 for the formation of DMVS and AMS via diradicals 1 and 2, respectively, are shown in Fig. 6(b–e).
In Fig. 7, the energy-level diagram for the cycloreversion of MSCB-e, including both the stepwise and concerted routes, is shown. All enthalpies have been calculated at the CCSD(T)/6-311++G(3d,2p)//MP2/6-311++G(d,p) level of theory. It was previously shown that the stepwise [2+2] cycloreversion was favored over the concerted one for SCB41 and DSCB.27 The differences in the activation barriers between the concerted and the stepwise routes were determined to be 10.6 kcal mol−1 and 11.2 kcal mol−1 at 0 K for SCB and DSCB, respectively. In the case of MSCB, this difference does not exist. As shown in Fig. 7, the enthalpies of activation for the concerted route viaTS1 and TS2 are 62.9 and 64.0 kcal mol−1, respectively, and that for the stepwise route is 62.9 kcal mol−1. The major difference between the structure of MSCB and those of SCB and DSCB is the presence of the electron-donating methyl group on silicon in MSCB. The σ → π* donation originating from the methyl group lowers the energies of TS1 and TS2 to a comparable level with TS3 in the stepwise route. Therefore, we have shown that concerted and stepwise cycloreversion of MSCB is kinetically competitive due to the close energy values of their transition states as shown in Fig. 7.
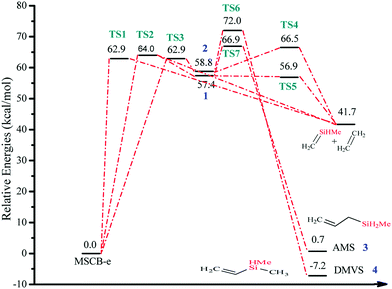 | ||
| Fig. 7 Energy-level diagram for the concerted and stepwise [2+2] cycloreversion of MSCB (Scheme 2). Energy values represent the relative enthalpies in kcal mol−1 at 0 K (ZPE corrections included) to that of MSCB-e. | ||
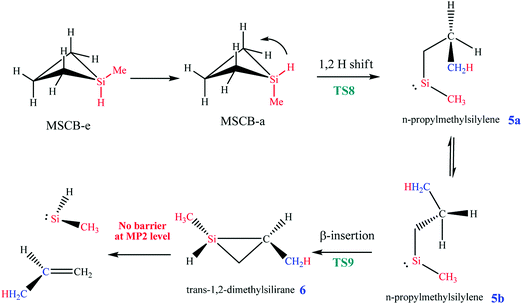
Here, MSCB-e first isomerizes to MSCB-a. The migration of a H atom from Si to C in MSCB-avia the transition state TS8 leads to the formation of n-propylmethylsilylene (5a), which has a total of eight conformers (not shown) that are close in energy. The IRC for the transition state TS8 showed a connection between the silylene 5a and the axial conformer (MSCB-a). The structure of TS8 is close to the ones reported for SCB41 and DSCB.27 Its high imaginary frequency (1248.4i cm−1) corresponds to H migration from Si to the adjacent C atom, as expected. In order to proceed into the next step, i.e., the insertion of silylene into a β-C–H bond to form trans-1,2-dimethylsilirane (6), 5a isomerizes into one of the eight conformers, labeled 5b, in Scheme 3. This isomerization places the hydrogen atom closer to the silicon to facilitate the β-insertion. The formed silirane 6 is a highly strained and unstable molecule, which decomposes easily into propene and methylsilylene. The transition state TS9 connecting silylene 5b to silirane 6 had an imaginary frequency, 719.0i cm−1, which corresponds to the migration of H from C to the adjacent Si. A similar type of isomerization between 5a and 5b was also observed in our theoretical study on DSCB.27 However, in the case of MSCB, the transition state of isomerization has not been located due to the fact that 5a and 5b are degenerate at the MP2/6-311++G(d,p) level of theory, and the isomerization occurs through a free rotation around the C–C bond. No transition states were located for the decomposition of silirane 6 into propene and methylsilylene. It was previously shown that such type of decomposition proceeded with no barrier at the MP2 level of theory.43,44 The two transition states for the ring opening, TS8 and TS9, can be found in Fig. 8, along with the optimized structures of the silylenes 5a, and 5b.
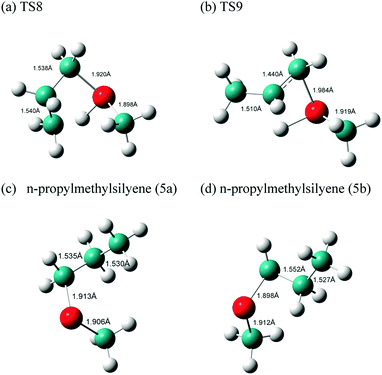 | ||
| Fig. 8 Optimized structures of the transition states (a) TS8 and (b) TS9 and the two silylenes (c) 5a and (d) 5b involved in the ring opening of MSCB. | ||
The energy-level diagram for the ring-opening reaction via 1,2-H shift at 0 K is shown in Fig. 9. The activation barrier for the ring opening of MSCB was determined to be 62.0 kcal mol−1.
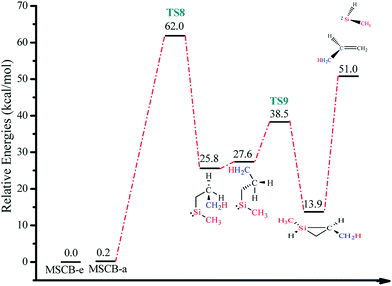 | ||
| Fig. 9 Energy-level diagram for the ring opening of MSCB via 1,2-H shift (Scheme 3). Energy values represent the relative enthalpies in kcal mol−1 at 0 K (ZPE correction included) to that of MSCB-e. | ||
3.5 Comparison between the experimental and theoretical studies
So far, we have determined the activation energies for two of three decomposition pathways of MSCB: ring opening (Ea,2 = 86.6 kJ mol−1) and ˙CH3 radical formation (Ea,3 = 106 kJ mol−1) from the kinetic analysis of gas-phase reactions in the HWCVD reactor at a total pressure of 10 Torr. In addition, we have previously determined the Ea values under collision-free conditions (5.0 × 10⁻⁶ Torr) for the primary decomposition of MSCB on the metal filament for the propene and methyl radical formation to be 68.7 kJ mol−1 and 46.7 kJ mol−1, respectively.16 The theoretical studies above have determined the activation energies for the three decomposition pathways in Scheme 1 to be 62.9 kcal mol−1 (i.e., 263 kJ mol−1) for the cycloreversion (R1), 62.0 kcal mol−1 (i.e., 259 kJ mol−1) for the ring opening (R2), and 86.2 kcal mol−1 (i.e., 361 kJ mol−1) for the ˙CH3 radical formation via exocyclic bond cleavage (R3). Fig. 10 shows the different Ea values for the three main decomposition pathways as obtained from our experimental and theoretical studies.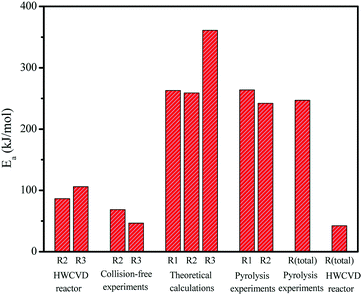 | ||
| Fig. 10 Activation energies determined from the experimental work in a HWCVD reactor and theoretical calculations from this work, along with a comparison with those obtained in previous HWCVD experiments under collision-free conditions and pyrolysis work.35,47 | ||
The Ea values obtained in this kinetic study using the reactor setup were much lower than those calculated from the theoretical studies. This clearly suggests that the reactions in the gas phase are not a major contributor to the determined activation energy. On the other hand, the Ea values obtained in this study are close to those under the collision-free conditions. Therefore, the heterogeneous reactions of MSCB on the hot tungsten filament are the rate-determining steps in the reactions occurring in the HWCVD reactor. However, it is noted that the activation energies obtained in the reactor setup are relatively higher than those obtained under a collision-free setup. Our previous study on the characterization of a W filament upon exposure to MSCB in the reactor showed that crystalline tungsten carbides, including both W2C and WC, were formed as an outer layer of the filament at the low temperatures of 1200–1400 °C.46 The change in the structure of W metal leads to increased Ea values as observed in the reactor. The comparison of the activation energy values also suggests that the formed tungsten carbides still catalyze the decomposition of MSCB, but they are not as good a catalyst as the W metal.
In a kinetic study of low-pressure pyrolysis of hydridosilacyclobutane (including SCB, MSCB, and DMSCB) in a stirred-flow reactor,47 Davidson et al. were able to determine the activation energy for the formation of ethene (via cycloreversion) and propene (via ring opening) to be 264 and 242 kJ mol−1, respectively. These values, also shown in Fig. 10, agree very well with the calculated values of 62.9 kcal mol−1 (i.e., 263 kJ mol−1) for ethene formation (R1) and 62.0 kcal mol−1 (i.e., 259 kJ mol−1) for propene formation (R2) from our theoretical study in this work. In another low-pressure pyrolysis of MSCB, Conlin and Kwak reported an activation energy of 59.1 kcal mol−1 (i.e., 247 kJ mol−1) for the total pyrolysis of MSCB.35 This value is close to the lowest barrier of the three pathways, i.e., the ring opening at 62.0 kcal mol−1 obtained from our theoretical calculations. This agrees with previous theoretical and experimental work on SCB41,47 and DSCB,27,42 which showed that ring opening is the most kinetically favored route of decomposition in terms of activation energy. It should be noted that the activation barrier of ring opening of MSCB is lower than that of cycloreversion merely by 0.9 kcal mol−1, making cycloreversion kinetically competitive with the ring opening of MSCB.
Finally, as shown in Table 1, this kinetic study also determined the rate constants for each of the three decomposition reactions and the overall decomposition of MSCB. Clearly, the rate constant of the overall decay of MSCB is much faster than those of the individual reactions, by at least one order of magnitude. As mentioned above, in addition to the decomposition of MSCB on the metal filaments to initialize the gas-phase reactions in the reactor, MSCB also reacts with the heated W filament to form tungsten carbides, leading to structural changes of the metal filaments.46 This is the main reason responsible for the fast decay of MSCB as determined from this work.
4. Conclusion
The gas-phase reaction kinetics of MSCB was studied in a HWCVD reactor under a practical pressure of 10 Torr and filament temperatures of 1000–1400 °C. The overall decomposition of MSCB was shown to follow first-order reaction kinetics, in agreement with previous pyrolysis studies on MSCB. However, the obtained activation energy (Ea) for the overall decomposition was much lower than the reported value for the pyrolysis of MSCB due to the existence of the tungsten filament in a HWCVD reactor. Furthermore, both experimental and theoretical studies of the decomposition kinetics were performed on the three individual pathways of MSCB, including the cycloreversion to form ethene and methylsilene (R1), ring opening to form propene and methylsilylene, (R2), and an exocyclic homolytic Si–CH3 bond rupture to form methyl radicals (R3). From the comprehensive theoretical study of the three decomposition pathways using ab initio calculations at the CCSD(T)/6-311++G(3d,2p)//MP2/6-311++G(d,p) level of theory, we were able to determine the Ea values of 62.9 kcal mol−1 (i.e., 263 kJ mol−1), 62.0 kcal mol−1 (i.e., 259 kJ mol−1), and 86.2 kcal mol−1 (i.e., 361 kJ mol−1) for the formation of ethene (R1), propene (R2), and ˙CH3 radicals (R3), respectively. The Ea values for the formation of propene and ˙CH3 radicals in a HWCVD reactor were determined to be 86.6 kJ mol−1 and 106 kJ mol−1, respectively, from the kinetic studies. These values are close to those obtained under a collision-free environment determined previously, but are much lower than the activation energies obtained from the theoretical calculations. From this, we have demonstrated that the heterogeneous reactions on the hot wire surface govern the gas-phase reaction kinetics in the HWCVD reactor. The W filament plays a major role in determining the reaction kinetics in a HWCVD reactor. The kinetic data provided in this work have shown the evident role of the tungsten filament in speeding up the reactions in the HWCVD reactor. More importantly, the data can contribute to the construction of a kinetic model of using MSCB as a precursor gas in an industrial HWCVD reactor.Conflicts of interest
There are no conflicts to declare.Acknowledgements
Financial support from the Natural Sciences and Engineering Research Council of Canada (NSERC) via the Discovery Grant, the Canadian Foundation for Innovation (CFI) via the New Opportunities Fund, and Western Canada Research Grid is gratefully acknowledged. The authors also thank Dr Arvi Rauk for his helpful discussions in the theoretical calculations performed in this work.References
- A. H. Mahan, J. Carapella, B. P. Nelson, R. S. Crandall and I. Balberg, J. Appl. Phys., 1991, 69, 6728–6730 CrossRef CAS.
- H. Matsumura, Appl. Phys. Lett., 1987, 51, 804–805 CrossRef CAS.
- A. M. Coclite, R. M. Howden, D. C. Borrelli, C. D. Petruczok, R. Yang, J. L. Yague, A. Ugur, N. Chen, S. Lee, W. J. Jo, A. D. Liu, X. X. Wang and K. K. Gleason, Adv. Mater., 2013, 25, 5392–5422 CrossRef CAS PubMed.
- K. Koyama, K. Ohdaira and H. Matsumura, Appl. Phys. Lett., 2010, 97, 082108 CrossRef.
- S. H. Lee, Y. H. Kim, R. Deshpande, P. A. Parilla, E. Whitney, D. T. Gillaspie, K. M. Jones, A. H. Mahan, S. B. Zhang and A. C. Dillon, Adv. Mater., 2008, 20, 3627–3632 CrossRef CAS.
- R. E. I. Schropp, Thin Solid Films, 2015, 595, 272–283 CrossRef CAS.
- A. K. Coker, Modeling of chemical kinetics and reactor design, Gulf Professional Pub., Boston, MA, 2001 Search PubMed.
- M. S. Lee and S. F. Bent, J. Phys. Chem. B, 1997, 101, 9195–9205 CrossRef CAS.
- T. Chen, Y. L. Huang, D. R. Yang, R. Carius and F. Finger, Thin Solid Films, 2011, 519, 4523–4526 CrossRef CAS.
- Y. J. Shi, Acc. Chem. Res., 2015, 48, 163–173 CrossRef CAS PubMed.
- R. Toukabri and Y. J. Shi, Phys. Chem. Chem. Phys., 2014, 16, 7896–7906 RSC.
- R. Toukabri and Y. J. Shi, J. Phys. Chem. A, 2014, 118, 3866–3874 CrossRef CAS PubMed.
- R. Toukabri, N. Alkadhi and Y. J. Shi, J. Phys. Chem. A, 2013, 117, 7697–7704 CrossRef CAS PubMed.
- I. Badran and Y. J. Shi, J. Phys. Chem. A, 2015, 119, 590–600 CrossRef CAS PubMed.
- L. Tong and Y. J. Shi, J. Mass Spectrom., 2010, 45, 215–222 CrossRef CAS PubMed.
- I. Badran, T. D. Forster, R. Roesler and Y. J. Shi, J. Phys. Chem. A, 2012, 116, 10054–10062 CrossRef CAS PubMed.
- Y. J. Shi, S. Consta, A. K. Das, B. Mallik, D. Lacey and R. H. Lipson, J. Chem. Phys., 2002, 116, 6990–6999 CrossRef CAS.
- T. J. Barton and N. Tillman, J. Am. Chem. Soc., 1987, 109, 6711–6716 CrossRef CAS.
- S. E. Denmark, B. D. Griedel, D. M. Coe and M. E. Schnute, J. Am. Chem. Soc., 1994, 116, 7026–7043 CrossRef CAS.
- I. Badran and Y. J. Shi, Thin Solid Films, 2015, 595, 239–243 CrossRef CAS.
- U. Schuhle, J. B. Pallix and C. H. Becker, J. Am. Chem. Soc., 1988, 110, 2323–2324 CrossRef CAS.
- Y. J. Shi, X. K. Hu, D. M. Mao, S. S. Dimov and R. H. Lipson, Anal. Chem., 1998, 70, 4534–4539 CrossRef CAS PubMed.
- S. H. Mousavipour and P. D. Pacey, J. Phys. Chem., 1996, 100, 3573–3579 CrossRef CAS.
- S. H. Mousavipour, V. Saheb and S. Ramezani, J. Phys. Chem. A, 2004, 108, 1946–1952 CrossRef CAS.
- M. J. Frisch, G. W. Trucks, H. B. Schlegel, G. E. Scuseria, M. A. Robb, J. R. Cheeseman, G. Scalmani, V. Barone, B. Mennucci, G. A. Petersson, H. Nakatsuji, M. Caricato, X. Li, H. P. Hratchian, A. F. Izmaylov, J. Bloino, G. Zheng, J. L. Sonnenberg, M. Hada, M. Ehara, K. Toyota, R. Fukuda, J. Hasegawa, M. Ishida, T. Nakajima, Y. Honda, O. Kitao, H. Nakai, T. Vreven, J. A. Montgomery, Jr., J. E. Peralta, F. Ogliaro, M. J. Bearpark, J. Heyd, E. Brothers, K. N. Kudin, V. N. Staroverov, T. Keith, R. Kobayashi, J. Normand, K. Raghavachari, A. Rendell, J. C. Burant, S. S. Iyengar, J. Tomasi, M. Cossi, N. Rega, J. M. Millam, M. Klene, J. E. Knox, J. B. Cross, V. Bakken, C. Adamo, J. Jaramillo, R. Gomperts, R. E. Stratmann, O. Yazyev, A. J. Austin, R. Cammi, C. Pomelli, J. W. Ochterski, R. L. Martin, K. Morokuma, V. G. Zakrzewski, G. A. Voth, P. Salvador, J. J. Dannenberg, S. Dapprich, A. D. Daniels, O. Farkas, J. B. Foresman, J. V. Ortiz, J. Cioslowski and D. J. Fox, Gaussian 09, revision E.01, Gaussian Inc., Wallingford CT, USA, 2015 Search PubMed.
- I. Badran, N. N. Nassar, N. N. Marei and A. Hassan, RSC Adv., 2016, 6, 54418–54430 RSC.
- I. Badran, A. Rauk and Y. J. Shi, J. Phys. Chem. A, 2012, 116, 11806–11816 CrossRef CAS PubMed.
- A. P. Scott and L. Radom, J. Phys. Chem., 1996, 100, 16502–16513 CrossRef CAS.
- Y. A. Mankelevich, A. T. Rakhimov and N. V. Suetin, Diamond Relat. Mater., 1996, 5, 888–894 CrossRef CAS.
- L. Schäfer, C. P. Klages, U. Meier and K. Kohse-Höinghaus, Appl. Phys. Lett., 1991, 58, 571–573 CrossRef.
- S. Redman, C. Chung, K. Rosser and M. N. R. Ashfold, Phys. Chem. Chem. Phys., 1999, 1, 1415–1424 RSC.
- K. H. Chen, M. C. Chuang, C. M. Penney and W. F. Banholzer, J. Appl. Phys., 1992, 71, 1485–1493 CrossRef CAS.
- J. A. Smith, E. Cameron, M. N. R. Ashfold, Y. A. Mankelevich and N. V. Suetin, Diamond Relat. Mater., 2001, 10, 358–363 CrossRef CAS.
- Y. A. Mankelevich, N. V. Suetin, J. A. Smith and M. N. R. Ashfold, Diamond Relat. Mater., 2002, 11, 567–572 CrossRef CAS.
- R. T. Conlin and Y. W. Kwak, J. Am. Chem. Soc., 1986, 108, 834–835 CrossRef CAS.
- L. E. Gusel'nikov, V. G. Avakyan and S. L. Gusel'nikov, Heteroat. Chem., 2007, 18, 704–720 CrossRef.
- Z. J. Cai and Y. J. Shi, J. Mol. Spectrosc., 2011, 267, 178–185 CrossRef CAS.
- A. Shiroudi and E. Zahedi, Phosphorus, Sulfur Silicon Relat. Elem., 2012, 187, 619–631 CrossRef CAS.
- L. E. Gusel'nikov, V. G. Avakyan and S. L. Gusel'nikov, J. Am. Chem. Soc., 2001, 124, 662–671 CrossRef.
- I. M. T. Davidson, S. Ijadi-Maghsoodi, T. J. Barton and N. Tillman, J. Chem. Soc., Chem. Commun., 1984, 7, 478–480 RSC.
- M. S. Gordon, T. J. Barton and H. Nakano, J. Am. Chem. Soc., 1997, 119, 11966–11973 CrossRef CAS.
- N. Auner, I. M. T. Davidson, S. Ijadi-Maghsoodi and T. F. Lawrence, Organometallics, 1986, 5, 431–435 CrossRef CAS.
- P. N. Skancke, J. Phys. Chem. A, 1997, 101, 5017–5021 CrossRef CAS.
- F. G. Anwari and S. Mark, Isr. J. Chem., 1983, 23, 129–132 CrossRef CAS.
- I. Badran, PhD thesis, University of Calgary, 2014.
- Y. J. Shi, I. Badran and S. Mulmi, Surf. Coat. Technol., 2017, 326, 103–110 CrossRef CAS.
- I. M. T. Davidson, A. Fenton, S. Ijadi-Mmaghsoodi, R. J. Scampton, N. Auner, J. Grobe, N. Tillman and T. J. Barton, Organometallics, 1984, 3, 1593–1595 CrossRef CAS.
Footnote |
| † Current address: Department of Chemistry, An-Najah National University, P. O. Box 7, Nablus, Palestine. |
| This journal is © the Owner Societies 2018 |

