SnO2 nanorods encapsulated within a 3D interconnected graphene network architecture as high-performance lithium-ion battery anodes
Hui
Xu
a,
Dan
Wang
a,
Wei
Zhang
a,
Jianfeng
Zhu
a,
Tong
Zhang
*b,
Xinli
Guo
a,
Yao
Zhang
a,
Zhengming
Sun
a and
Jian
Chen
 *a
*a
aJiangsu Key Laboratory of Advanced Metallic Materials, School of Materials Science and Engineering, Southeast University, Nanjing 211189, China. E-mail: j.chen@seu.edu.cn
bSchool of Electronic Science & Engineering, Southeast University, China. E-mail: tzhang@seu.edu.cn
First published on 1st November 2017
Abstract
SnO2 nanorods (NRs) have been demonstrated as one of the potential candidates for high-performance lithium-ion battery anodes due to their unique structural features, high theoretical capacity, natural abundance and low cost of fabrication. However, they still suffer from the problem that their direct exposure to the electrolyte leads to the instability of the SEI layer, causing low coulombic efficiency, high ionic resistance and low electronic conductivity. In this study, SnO2 NRs were synthesized by a hydrothermal method, and then spatially confined within graphene sheets by a facile freeze-drying process. The as-fabricated architecture exhibits a full encapsulation arrangement with graphene sheets interlaced into an interconnected macroporous network, serving not only as a robust framework with accessible space for the electrolyte but also a physical barrier layer to prevent the SnO2 NRs from direct exposure to the electrolyte. Moreover, the SnO2 NRs can function as pillars to prevent the graphene sheets from restacking while preserving the highly robust structure and efficient electron and ion transport channels. Benefiting from the admirable synergistic effect between SnO2 NRs and graphene, the assembled electrode shows excellent cycle performance (1179.2 mA h g−1 after 400 cycles at 1.0 A g−1) and rate capabilities (624.2 mA h g−1 at 8.0 A g−1; 458.4 mA h g−1 at 16.0 A g−1).
1. Introduction
To meet the ever-growing demand for portable electronics and large-scale energy storage devices, lithium-ion batteries (LIBs) with high energy density and power density have been the subject of intense research.1 A variety of emerging anode materials such as tin-based and silicon-based anodes as well as transition metal compounds have attracted enormous attention.2–6 Among them, SnO2 is regarded as one of the most promising anode materials for next generation LIBs due to its high theoretical capacity (782 mA h g−1), abundant resources, inexpensive preparation and environmental benignity.7,8 However, SnO2 suffers from not only the poor electrical conductivity but also severe pulverization caused by the large volume change during charge/discharge processes.9 Consequently, electrical disconnection between active materials and the electrode framework may occur due to cracking; meanwhile the solid electrolyte interface (SEI) layer is repeatedly formed on the fresh surface. The capacity of SnO2 anodes hence fades rapidly upon cycling.10The use of nanostructured SnO2 is a popular approach to partially solve the above issues; especially one-dimensional SnO2 nanorods (NRs) present a special geometry that can offer direct channels for efficient electron transport while sharing similar advantages to other nanostructures.11 For instance, Liu et al.12 synthesized SnO2 NR arrays on large-area flexible metallic substrates, delivering significantly improved electrochemical performance compared to SnO2 nanoparticles and yielding a high reversible capacity of 580 mA h g−1 after 100 cycles at 0.1C (1C = 782 mA g−1) and excellent rate capability (350 mA h g−1 at 5C). He et al.13 developed a facile strategy for integrating SnO2 NRs into a polypyrrole film, exhibiting good cycling stability (701 mA h g−1 after 300 cycles at 0.2 A g−1) and high rate capability (512 mA h g−1 at 3.0 A g−1).
Although the above-mentioned SnO2 NRs have shown improved electrochemical performance, their direct exposure to the electrolyte can lead to the instability of the SEI layer, causing low coulombic efficiency, high ionic resistance and low electronic conductivity.14 Therefore, capacity decay remains unavoidable when the electrodes are operated at a high rate and over a long-term cycle. In this regard, an electrolyte barrier layer should be engineered in the electrode structure. Recently, graphene has been considered as an ideal electrolyte barrier layer owing to its large surface area, strong adsorption capacity, excellent chemical stability, and good mechanical properties, as well as high electrical conductivity.15 Sun et al.16 developed a facile one-step hydrothermal procedure to prepare a SnO2 NRs/graphene composite. Compared with pure SnO2 NRs, the composite shows a high reversible specific capacity and improved cycling stability (710 mA h g−1 after 50 cycles at 0.1 A g−1). Zhang et al.17 reported a controllable synthesis of SnO2 NRs with a tunable length anchored onto graphene nanosheets, showing high lithium storage capability and good cycling performance. However, simple decoration of the SnO2 NRs on graphene sheets is not welcomed because the weak combination between SnO2 and graphene usually causes the detachment of SnO2 NRs from graphene sheets, resulting in capacity decay.18
In this study, we designed and fabricated a 3D interconnected graphene network (GN) architecture for encapsulating SnO2 NRs within graphene sheets by a facile freeze-drying process. The full encapsulation of SnO2 NRs into graphene can not only prevent them from direct exposure to the electrolyte and detachment from graphene sheets, but also accommodate the large volume change of the SnO2 NRs during charge/discharge processes and enhance the electronic conductivity of the electrode. Meanwhile, the pillar effect of SnO2 NRs prevents the graphene sheets from restacking while preserving the highly robust structure and efficient electron/ion transport channels. As a result of the synergistic interplay between the interconnected GN and the well-encapsulated SnO2 NRs, the composite shows a significant improvement in cycle performance (1179.2 mA h g−1 after 400 cycles at 1.0 A g−1) and rate capabilities (624.2 mA h g−1 at 8.0 A g−1; 458.4 mA h g−1 at 16.0 A g−1).
2. Experimental
2.1. Synthesis of SnO2 NRs
The SnO2 NRs were synthesized by a facile hydrothermal method. In brief, 0.6 g of SnCl4·5H2O was added to a mixed solvent of ethanol (30 mL) and water (30 mL) with stirring to allow for complete dissolution. Then NaOH was added to control the pH value of the solution around 10. The solution was transferred to a 100 mL polyphenylene (PPL) autoclave, then sealed and heated at 220 °C, 240 °C, and 260 °C for 24 h, respectively. The precipitates were centrifuged, washed thoroughly with ethanol and then dried at 80 °C for 12 h under vacuum. The resultant products were named SnO2-220, SnO2-240 and SnO2-260 according to the reaction temperatures.2.2. Synthesis of SnO2 NRs@GN composites
Graphene oxide (GO) was synthesized by a modified Hummers method.19 The SnO2 NRs@GN composites were prepared by a freeze-drying method with subsequent calcination. Typically, a predetermined amount of SnO2-240 was added to a mixed solvent of ethanol (4 mL) and water (6 mL), and ultrasonically treated for 1 h. Then, 17.5 mg of sodium carboxymethyl cellulose and 25 mg of poly(vinyl alcohol) were added to the mixed solvent in sequence. After 10 min of stirring, 50 mL of GO suspension (2 mg mL−1) was poured into the above solution and kept at 50 °C under stirring for 12 h. The suspension was placed in a cylindrical mold and fully frozen by using liquid nitrogen, followed by being taken out from the mold and dried thoroughly at −50 °C. The as-obtained monoliths were calcined at 550 °C in an Ar atmosphere for 2 h. The resultant products were named SnO2@GN-1, SnO2@GN-2 and SnO2@GN-3 according to the weight ratio of SnO2-240 to GO controlled as 1![[thin space (1/6-em)]](https://www.rsc.org/images/entities/char_2009.gif) :
:![[thin space (1/6-em)]](https://www.rsc.org/images/entities/char_2009.gif) 1, 1
1, 1![[thin space (1/6-em)]](https://www.rsc.org/images/entities/char_2009.gif) :
:![[thin space (1/6-em)]](https://www.rsc.org/images/entities/char_2009.gif) 2, and 1
2, and 1![[thin space (1/6-em)]](https://www.rsc.org/images/entities/char_2009.gif) :
:![[thin space (1/6-em)]](https://www.rsc.org/images/entities/char_2009.gif) 3 in the precursor suspensions, respectively.
3 in the precursor suspensions, respectively.
2.3. Materials characterization
The as-obtained samples were initially characterized by X-ray diffraction (XRD) using an X-ray diffraction analyzer with Cu-Kα radiation (D8-Discover, Bruker). The morphology of the samples was examined using a field emission scanning electron microscope (FESEM, Sirion, FEI) and transmission electron microscope (TEM, Tecnai F20, FEI). Raman analysis was performed using a Renishaw Invia (Thermo Fisher) with a laser wavelength of 532 nm. Thermogravimetric analysis (TGA) was performed using an STA449 F3 thermal analyzer with a heating rate of 10 °C min−1 over the range 90–800 °C in an air atmosphere.2.4. Electrochemical measurements
The electrochemical performance of the samples was evaluated using a CR2032-type coin cell. The working electrodes were fabricated by mixing the active materials with polyvinylidene difluoride (PVDF) and super P in a weight ratio of 80![[thin space (1/6-em)]](https://www.rsc.org/images/entities/char_2009.gif) :
:![[thin space (1/6-em)]](https://www.rsc.org/images/entities/char_2009.gif) 10
10![[thin space (1/6-em)]](https://www.rsc.org/images/entities/char_2009.gif) :
:![[thin space (1/6-em)]](https://www.rsc.org/images/entities/char_2009.gif) 10. Then, an appropriate amount of N-methylpyrrolidone (NMP) solvent was slowly added to the mixture to produce a slurry. The uniform slurry was coated onto a copper foil and dried at 120 °C for 24 h under vacuum. These electrodes were punched into the form of 12 mm diameter disks and assembled into half cells in an Ar-filled glovebox. The mass loading of each electrode was calculated to be ∼1.5 mg (∼1.2 mg for active materials) by weighing the mass discrepancy of the electrode and copper foil. Lithium foils were used as the counter electrodes, and the Celgard 2400 films were used as the separators. The electrolyte employed was 1.0 M LiPF6 in 1
10. Then, an appropriate amount of N-methylpyrrolidone (NMP) solvent was slowly added to the mixture to produce a slurry. The uniform slurry was coated onto a copper foil and dried at 120 °C for 24 h under vacuum. These electrodes were punched into the form of 12 mm diameter disks and assembled into half cells in an Ar-filled glovebox. The mass loading of each electrode was calculated to be ∼1.5 mg (∼1.2 mg for active materials) by weighing the mass discrepancy of the electrode and copper foil. Lithium foils were used as the counter electrodes, and the Celgard 2400 films were used as the separators. The electrolyte employed was 1.0 M LiPF6 in 1![[thin space (1/6-em)]](https://www.rsc.org/images/entities/char_2009.gif) :
:![[thin space (1/6-em)]](https://www.rsc.org/images/entities/char_2009.gif) 1 w/w ethylene carbonate (EC) and diethyl carbonate (DEC) with 2 wt% vinylene carbonate. The galvanostatic charge/discharge measurements were conducted using a LAND battery test system in the voltage range of 0.01 to 3.0 V (vs. Li/Li+) at different current densities. Cyclic voltammetry (CV) and electrochemical impedance spectroscopy (EIS) measurements were performed on a CHI660e electrochemical workstation. The EIS data were collected before cycles, and the weights and thicknesses of the tested electrodes are similar.
1 w/w ethylene carbonate (EC) and diethyl carbonate (DEC) with 2 wt% vinylene carbonate. The galvanostatic charge/discharge measurements were conducted using a LAND battery test system in the voltage range of 0.01 to 3.0 V (vs. Li/Li+) at different current densities. Cyclic voltammetry (CV) and electrochemical impedance spectroscopy (EIS) measurements were performed on a CHI660e electrochemical workstation. The EIS data were collected before cycles, and the weights and thicknesses of the tested electrodes are similar.
3. Results and discussion
3.1. Characterization and electrochemical performance of SnO2 NRs
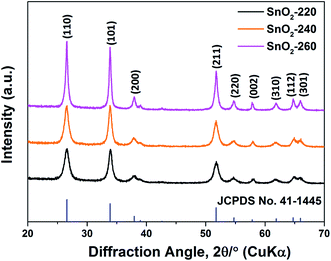
The SnO2 NRs (SnO2-220, SnO2-240 and SnO2-260) were synthesized by a hydrothermal method at different reaction temperatures, and their XRD patterns are shown in Fig. 1. Clearly, all diffraction peaks correspond to the (110), (101), (200), (211), (220), (002), (310), (112) and (301) planes of tetragonal SnO2 (JCPDS no. 41-1445),20 indicating high purity and crystallization in the samples. Moreover, it is found that the diffraction peaks from SnO2-220 to SnO2-260 become stronger and sharper, suggesting that the grain size becomes larger with the increase of reaction temperature.21 On the basis of the Scherrer equation, the average grain sizes of SnO2-220, SnO2-240 and SnO2-260 are evaluated to be 11.9, 15.7 and 49.2 nm, respectively.The TEM images of SnO2-220, SnO2-240 and SnO2-260 are shown in Fig. 2. The three samples exhibit a similar rod-like morphology but obvious difference in size and uniformity. With the increase of reaction temperature from 220 to 260 °C, the length of the SnO2 NRs obviously increases while the diameter change is slight. Among them, the SnO2-240 exhibits the best size uniformity with a length of 20–25 nm and a diameter of ∼7 nm, corresponding to the aspect ratio of 2.9–3.6, as observed in Fig. 2c and d. By contrast, the SnO2-220 has a smaller size with a length of 5–15 nm and a diameter of ∼5 nm (the aspect ratio is 1.0–3.0, Fig. 2a and b), while the SnO2-260 consists of not only larger size NRs with a length of 20–100 nm and a diameter of ∼9 nm (the aspect ratio is 2.2–11.1), but also some ultrafine nanopowders (<1 nm) that aggregate around the NRs (Fig. 2e and f). The observed and calculated d-spacings from the HRTEM images are ∼0.33 nm for all samples (the insets in Fig. 2b, d and f), corresponding to the d-spacing of the (110) planes of SnO2, suggesting well-crystallized SnO2 NRs in the samples.22 Note that the exposure of (110) planes and the preferred growth direction along [001] are the results of minimizing surface energy.23,24 The theoretical calculations25,26 revealed that in the order of increasing energy the surfaces follow the sequence (110) < (100) < (101) < (001). In addition, the HRTEM results show that the size of SnO2 NRs increases with the increase in hydrothermal temperature, indicating that higher reaction temperature accelerates the growth process and promotes the formation of longer 1D structures.
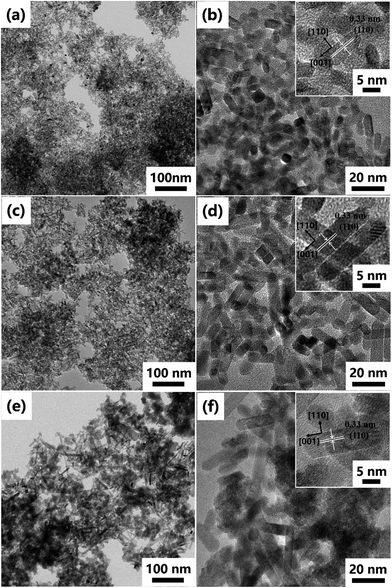 | ||
| Fig. 2 TEM images of (a and b) SnO2-220, (c and d) SnO2-240 and (e and f) SnO2-260. The insets in (b), (d) and (f) show the HRTEM images of relevant samples. | ||
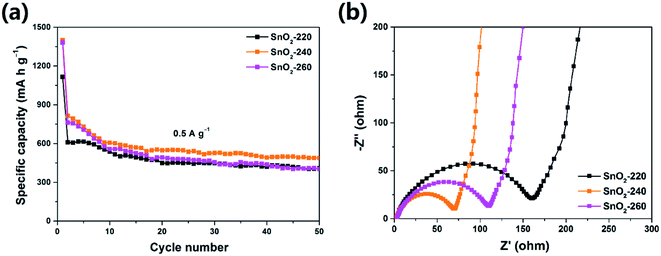
It is well known that the morphology of electrode materials has profound effects on their electrochemical performance. Fig. 3a shows the cycle profiles of the three samples at a current density of 0.5 A g−1. It is found that the SnO2-240 exhibits the best cycle performance and retains a discharge capacity up to 488.5 mA h g−1 after 50 cycles, which is much higher than that of SnO2-220 (408.5 mA h g−1) and SnO2-260 (402.6 mA h g−1). To evaluate the kinetics of electrochemical reactions on the electrode, electrochemical impedance spectroscopy (EIS) was carried out in the frequency range of 100 kHz to 0.01 Hz. As shown in Fig. 3b, the Nyquist plots of all the samples possess the same features with a semicircle in the high frequency region and a line in the low frequency region, corresponding to charge-transfer resistance and the diffusion of lithium ions in the electrodes, respectively.27 It can be seen that the SnO2-240 has a smaller semicircle diameter than the SnO2-220 and SnO2-260, suggesting a smaller charge-transfer resistance in SnO2-240.28 This may be because the SnO2-240 features a better size uniformity which may provide faster lithium ion transfer along the length direction.29 However, it should be noted that the capacities of these pure SnO2 NRs decrease gradually upon cycling, which can be attributed to the large volume change of SnO2 during charge/discharge processes, leading to electrode structure degradation and instability of the SEI layer.
3.2. Characterization and electrochemical performance of SnO2 NRs@GN composites
In order to improve the electrochemical performance of the SnO2 NRs, the 3D interconnected GN architecture is engineered to fully encapsulate the SnO2 NRs by a facile freeze-drying method. The SEM images of the as-fabricated SnO2 NRs@GN composites (SnO2@GN-1, SnO2@GN-2 and SnO2@GN-3) are shown in Fig. 4a–c, showing that the graphene sheets interlace into interconnected macroporous networks. The high magnification SEM image of SnO2@GN-2 (Fig. 4b) reveals that the SnO2 NRs are fully encapsulated within graphene sheets. By contrast, the composite with a lower SnO2 loading ratio (SnO2@GN-1) shows an inadequate SnO2 NR encapsulation amount (Fig. 4a), while the composite with a higher SnO2 loading ratio (SnO2@GN-3) exposes a part of the SnO2 NRs outside the graphene sheets due to the excessive SnO2 amount in the composite (Fig. 4c). The TEM image of the SnO2@GN-2 shows that the SnO2 NRs are closely wrapped by graphene sheets (Fig. 4d), which not only is beneficial to the electronic transportation but also accommodates the large volume change of the SnO2 NRs during charge/discharge processes, as well as prevents the aggregation of the SnO2 NRs.30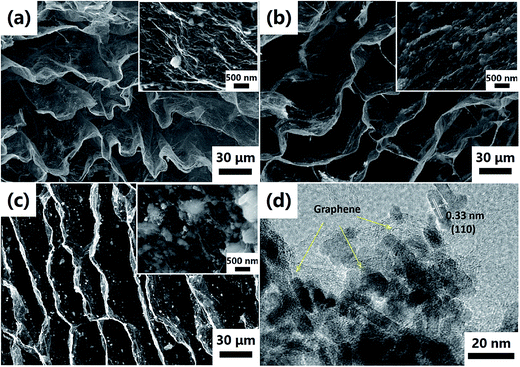 | ||
| Fig. 4 (a–c) SEM images of SnO2@GN-1, SnO2@GN-2 and SnO2@GN-3, respectively, (d) TEM image of SnO2@GN-2. The insets in (a), (b) and (c) exhibit the HRSEM images of relevant samples. | ||
Fig. 5a exhibits the XRD patterns of the SnO2 NRs@GN composites. All diffraction peaks correspond to those of pure SnO2-240 NRs (Fig. 1), implying that the crystal structure of SnO2 NRs remains intact after hybridization with graphene. Note that the characteristic stacking peak of graphene at around 26° may be overlapped with the (110) peak of SnO2 in the composites. Raman spectra of all three samples show two broad bands at around 1345 and 1585 cm−1 (Fig. 5b). The D band at around 1345 cm−1 is induced by defects or disorder while the G band at around 1585 cm−1 corresponds to the sp2-type ordered graphitic carbon.31 The intensity ratio of D and G bands (Id/Ig) is related to the extent of disorder degree and average size of the sp2 domains.32 It is found that the ratio of Id/Ig increases from 0.92 for SnO2@GN-1 to 0.94 for SnO2@GN-2 and 0.97 for SnO2@GN-3, suggesting the increase of defects and disordered structures with the increase of the SnO2 loading ratio in the composites. Fig. 5c shows the TGA curves of SnO2@GN-1, SnO2@GN-2 and SnO2@GN-3. The weight fractions of SnO2 NRs in the composites were calculated to be about 68.1% for SnO2@GN-1, 76.2% for SnO2@GN-2 and 81.7% for SnO2@GN-3 according to the TGA results.
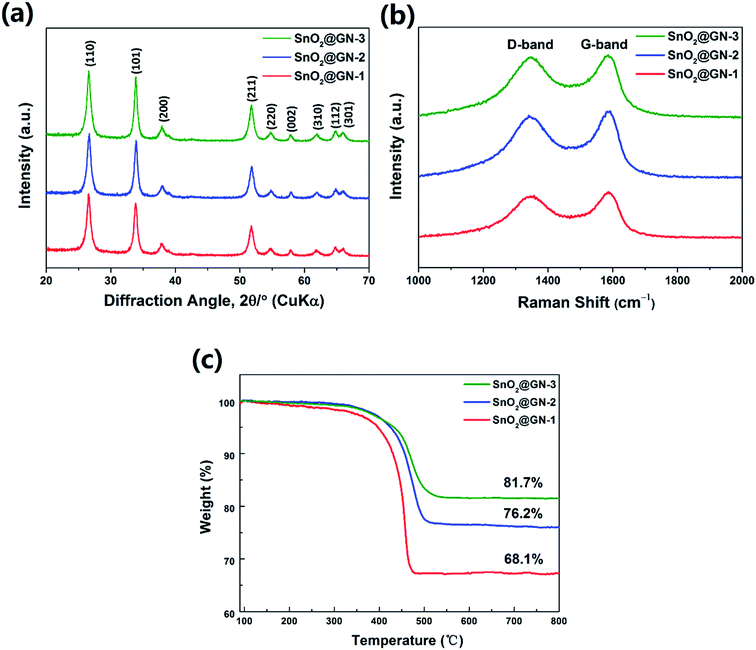 | ||
| Fig. 5 (a) XRD patterns, (b) Raman spectra and (c) TGA curves of SnO2@GN-1, SnO2@GN-2 and SnO2@GN-3. | ||
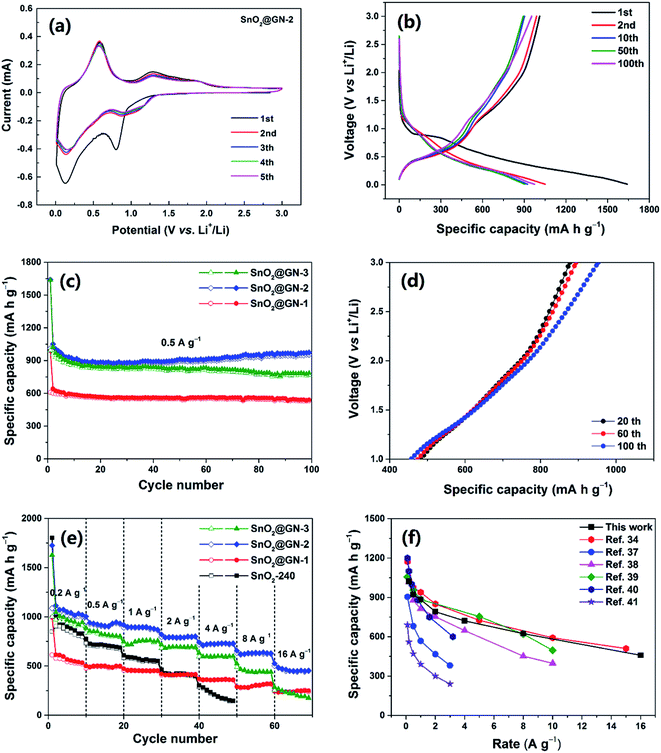
To demonstrate the potential application of the SnO2 NRs@GN composites as LIB anode materials, we consider the SnO2@GN-2 as a representative to first investigate the electrochemical behaviors through CV measurements at a scan rate of 0.2 mV s−1 in the potential range of 0.01–3.0 V (vs. Li/Li+), as shown in Fig. 6a. In the first cycle, the cathodic peak at ∼0.80 V corresponds to the initial reduction of SnO2 to Sn (SnO2 + 4Li+ + 4e− → Sn + 2Li2O) and the formation of the SEI layer.33 Two anodic peaks at ∼1.30 and 1.90 V are attributed to the reverse process from Sn to SnO2. Another strong cathodic peak at ∼0.12 V is assigned to the alloying process (Sn + 4.4Li+ + 4.4e− → Li4.4Sn), while the corresponding anodic peak at ∼0.58 V corresponds to the dealloying process.34 In the subsequent cycles, the peak potential and intensity remain similar, suggesting good reversibility and reproducibility for the SnO2@GN-2 electrode.
The typical galvanostatic charge/discharge curves of SnO2@GN-2 at a current density of 0.5 A g−1 are shown in Fig. 6b. In accordance with the CV results in Fig. 6a, two voltage plateaus are observed during the first discharge process. The plateau at ∼0.8 V is attributed to the reduction of SnO2 to Sn, accompanied by the decomposition of the electrolyte to form a SEI layer, and the following slope plateau at 0.5 to 0.01 V is attributed to the formation of the LixSn.35 These plateaus are still observable in the subsequent cycles, suggesting the stable electrochemical process during cycles. The first discharge and charge capacities are 1640.8 and 1010.6 mA h g−1, yielding a coulombic efficiency (CE) of 61.6%. The initial large capacity loss is attributed to the irreversible conversion reaction and the formation of the SEI layer as well as the Li+ insertion into the defects in graphene.36 However, the CE of SnO2@GN-2 increases to 94.1% in the 2nd cycle, 98.8% in the 10th cycle and then remains ∼99% in the subsequent cycles. By contrast, the SnO2-240 delivers an initial CE of 45.2% which is much lower than that of SnO2@GN-2. The improved CE of SnO2@GN-2 is attributed to the existence of the graphene sheath in the composite, avoiding direct exposure of the SnO2 NRs to the electrolyte and thus facilitating the formation of a stable SEI layer.
Fig. 6c exhibits the cycle profiles of the composites at a current density of 0.5 A g−1. It is found that the capacities of all samples decline more slowly than those of pure SnO2 NRs (Fig. 3a), especially the SnO2@GN-2 even shows a gradually increasing capacity since the 20th cycle, and a capacity of 953.0 mA h g−1 is retained after 100 cycles, much higher than that of the SnO2@GN-1 (531.6 mA h g−1) and SnO2@GN-3 (768.6 mA h g−1), as well as the theoretical values of SnO2 (782 mA h g−1). The additional capacity is often attributed to the initial only partially reversible conversion reaction that becomes progressively more reversible with increasing cycle number.18 To clarify this point, the galvanostatic charge curves of the SnO2@GN-2 electrode between 1.0 and 3.0 V (vs. Li/Li+), corresponding to the potential range of the reverse conversion process (Sn + 2Li2O → SnO2 + 4Li+ + 4e−), are shown in Fig. 6d. The capacity contribution from this reverse conversion process can be calculated according to the difference between the intercepts at 3.0 and 1.0 V. It is clear that the difference between the intercepts becomes larger upon cycling, and the capacities of 395.3, 420.3 and 478.9 mA h g−1 are achieved in the 20th, 60th, and 100th charge processes, respectively, demonstrating that the conversion reaction becomes more reversible with cycles.
Fig. 6e shows the rate capability of the composites and pure SnO2-240 NRs. Compared with other samples, the SnO2@GN-2 exhibits the best rate capability, even at the high rates of 8.0 A g−1 and 16.0 A g−1, delivering ultrahigh average reversible capacities of 624.2 mA h g−1 and 458.4 mA h g−1, respectively. In contrast, the SnO2@GN-1 and SnO2@GN-3 show lower reversible capacities of 241.5 mA h g−1 and 219.5 mA h g−1 at 16.0 A g−1, respectively, while the reversible capacity of the pure SnO2-240 NRs decreases dramatically with the increase of current density to as low as 142.1 mA h g−1 at only 4.0 A g−1. The remarkable rate capability of SnO2@GN-2 can be attributed to the encapsulation arrangement with the interconnected GN which can provide fast electron and lithium ion transport pathways through the overall electrode, significantly enhancing electrical conductivity and lithium insertion/extraction kinetics. To be noted, the rate capability of SnO2@GN-2 is compared with those of other recently reported SnO2-based anodes in Fig. 6f, including SnO2/graphene aerogels,34 SnO2/graphene microspheres,37 graphene/SnO2/polyaniline composites,38 carbon-coated flower-like SnO2 spheres,39 boron-doped C/SnO2/graphene nanosheets,40 and graphene-wrapped SnO2 quantum-dot clusters.41 It is clear that the present electrode possesses ultrahigh capacities and remarkable rate capability at various rates.
The long-term cycle performance of the SnO2@GN-2 at a high current density of 1.0 A g−1 was further investigated, as shown in Fig. 7. It is found that the specific capacity also declines first and then increases gradually to as high as 1179.2 mA h g−1 after 400 cycles, and the capacity retention ratio reaches up to 167% (based on the first charge capacity). The corresponding CE is held close to 99% after the initial several cycles.
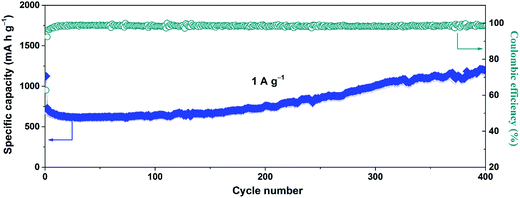 | ||
| Fig. 7 Long-term cycle performance of SnO2@GN-2 at 1.0 A g−1 and the corresponding coulombic efficiency. | ||
As mentioned above, the increasing capacity of SnO2@GN-2 is mainly attributed to partially reversible conversion of Sn to SnO2. It is well known that the lithiation of SnO2 involves both the conversion reaction (SnO2 + 4Li+ + 4e− ↔ Sn + 2Li2O) and the alloying reaction (Sn + 4.4Li+ + 4.4e− ↔ Li4.4Sn).42 Theoretically, as much as total 8.4 Li+ ions can be utilized during the first discharge process. Unfortunately, approximately 4 Li+ ions became inactivated in the initial several cycles owing to the irreversible conversion reaction. This will lead to capacity decay and low CE in the initial several cycles, which is in good agreement with our results. However, in this study, it is important to note that the CE is significantly improved, and the capacity also gradually increases upon cycling, suggesting that the conversion reaction becomes reversible. That is to say, these inserted Li+ ions can be returned adequately in the subsequent cycles, thus achieving the high CE.
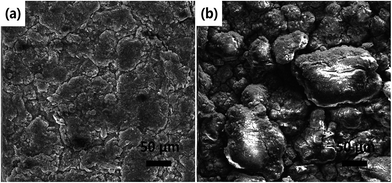
To substantiate the correlation between the structural features and the cycling stability of the electrode materials, the morphology of SnO2@GN-2 and SnO2-240 electrodes after 100 cycles was examined. As shown in Fig. 8, the SnO2@GN-2 electrode exhibits a close-packed surface morphology with tiny cracks while the SnO2-240 electrode shows serious collapse and large cracks. These results indicate that the encapsulation of SnO2 NRs into graphene is an effective strategy to keep the structural and electrical integrity of the electrode.
In light of the above analyses, we believe that the ultrahigh capacity, and extraordinary cycle and rate performance of the SnO2@GN-2 are related to its unique structural features, such as full encapsulation arrangement, highly oriented macropores, interconnected conductive network, and electrolyte barrier layer, as well as the pillar effect of SnO2 NRs in between the graphene sheets. The synergistic coupling of these features not only effectively accommodates the large volume change of SnO2 NRs during charge/discharge processes, but also provides fast electron and lithium ion transport pathways through the overall electrode, thus achieving fast and robust lithium storage.
4. Conclusions
We fabricated a 3D interconnected GN architecture where SnO2 NRs were fully encapsulated within graphene sheets by a facile freeze-drying strategy. The as-built electrode shows extraordinary cycle performance (1179.2 mA h g−1 after 400 cycles at 1.0 A g−1) and remarkable rate capabilities (624.2 mA h g−1 at 8.0 A g−1; 458.4 mA h g−1 at 16.0 A g−1). The unprecedentedly favorable performance is attributed to the following factors: (1) the 3D interconnected GN architecture provides continuous conductive paths and extensive diffusion channels for electron and lithium ion transport, significantly enhancing the electrode reaction kinetics; (2) the elastic graphene accommodates the large volume change of SnO2 NRs during charge/discharge processes, keeping the cycling stability of the electrode; (3) the full encapsulation of SnO2 NRs in graphene sheets enables the SEI layer to be formed around the outer surface instead of on the SnO2 NRs, ensuring the SEI stability; (4) the SnO2 NRs function as pillars to prevent the graphene sheets from restacking while preserving the highly robust structure. It is believed that the novel SnO2@GN-2 composite can be a promising new anode material for high energy density and power density LIBs.Conflicts of interest
There are no conflicts to declare.Acknowledgements
The authors gratefully acknowledge the financial support from the MOST (grant number: 2017YFA0205800), NSFC (grant number: 11472080 and 51731004), NSF of Jiangsu Province (grant number: BK20141336), Jiangsu Key Laboratory for Advanced Metallic Materials (grant number: BM2007204) and Fundamental Research Funds for the Central Universities.References
- V. Etacheri, R. Marom, R. Elazari, G. Salitra and D. Aurbach, Energy Environ. Sci., 2011, 4, 3243 CAS.
- V. Aravindan, Y. Lee and S. Madhavi, Adv. Energy Mater., 2015, 5, 1402225 CrossRef.
- B. Li, R. Qi, J. Zai, F. Du, C. Xue, Y. Jin, C. Jin, Z. Ma and X. Qian, Small, 2016, 12, 5281–5287 CrossRef CAS PubMed.
- W. Luo, Y. Wang, S. Chou, Y. Xu, W. Li, B. Kong, S. X. Dou, H. K. Liu and J. Yang, Nano Energy, 2016, 27, 255–264 CrossRef CAS.
- X. Li, J. Zai, S. Xiang, Y. Liu, X. He, Z. Xu, K. Wang, Z. Ma and X. Qian, Adv. Energy Mater., 2016, 6, 1601056 CrossRef.
- B. Li, Z. Xiao, J. Zai, M. Chen, H. Wang, X. Liu, G. Li and X. Qian, Mater. Today Energy, 2017, 5, 299–304 CrossRef.
- C. Miao, M. Liu, Y. He, X. Qin, L. Tang, B. Huang, R. Li, B. Li and F. Kang, Energy Stor. Mater., 2016, 3, 98–105 CrossRef.
- B. Li, X. Li, J. Zai and X. Qian, Nano-Micro Lett., 2016, 8, 174–181 CrossRef.
- Y. Deng, C. Fang and G. Chen, J. Power Sources, 2016, 304, 81–101 CrossRef CAS.
- M. Zhang, T. Wang and G. Cao, Int. Mater. Rev., 2015, 60, 330–352 CrossRef CAS.
- D. Kim, I. Hwang, S. J. Kwon, H. Kang, K. Park, Y. Choi, K. Choi and J. Park, Nano Lett., 2007, 7, 3041–3045 CrossRef CAS PubMed.
- J. Liu, Y. Li, X. Huang, R. Ding, Y. Hu, J. Jiang and L. Liao, J. Mater. Chem., 2009, 19, 1859 RSC.
- L. Zhang, K. Zhao, W. Xu, Y. Dong, R. Xia, F. Liu, L. He, Q. Wei, M. Yan and L. Mai, Phys. Chem. Chem. Phys., 2015, 17, 7619 RSC.
- N. Liu, H. Wu, M. T. McDowell, Y. Yao, C. Wang and Y. Cui, Nano Lett., 2012, 12, 3315–3321 CrossRef CAS PubMed.
- L. Ji, P. Meduri, V. Agubra, X. Xiao and M. Alcoutlabi, Adv. Energy Mater., 2016, 6, 1502159 CrossRef.
- C. Xu, J. Sun and L. Gao, J. Mater. Chem., 2012, 22, 975–979 RSC.
- R. Gao, H. Zhang, S. Yuan, L. Shi, M. Wu and Z. Jiao, RSC Adv., 2016, 6, 4116–4127 RSC.
- H. Cong, S. Xin and S. Yu, Nano Energy, 2015, 13, 482–490 CrossRef CAS.
- D. C. Marcano, D. V. Kosynkin, J. M. Berlin, A. Sinitskii, Z. Sun, A. Slesarev, L. B. Alemany, W. Lu and J. M. Tour, ACS Nano, 2010, 4, 4806–4814 CrossRef CAS PubMed.
- S. Nam, S. J. Yang, S. Lee, J. Kim, J. Kang, J. Y. Oh, C. R. Park, T. Moon, K. T. Lee and B. Park, Carbon, 2015, 85, 289–298 CrossRef CAS.
- G. Wu, Z. Li, W. Wu and M. Wu, J. Alloys Compd., 2014, 615, 582–587 CrossRef CAS.
- M. Zhang, Z. Sun, T. Zhang, D. Sui, Y. Ma and Y. Chen, Carbon, 2016, 102, 32–38 CrossRef CAS.
- U. Pal, M. Pal and R. S. Zeferino, J. Nanopart. Res., 2012, 14, 969 CrossRef.
- A. A. Firooz, A. R. Mahjoub and A. A. Khodadadi, Mater. Lett., 2008, 62, 1789–1792 CrossRef CAS.
- B. Slater, C. R. A. Catlow, D. H. Gay, D. E. Williams and V. Dusastre, J. Phys. Chem. B, 1999, 103, 10644–10650 CrossRef CAS.
- E. R. Leite, T. R. Giraldi, F. M. Pontes, E. Longo, A. Beltrán and J. Andrés, Appl. Phys. Lett., 2003, 83, 1566 CrossRef CAS.
- W. Ai, W. Zhou, Z. Du, C. Sun, J. Yang, Y. Chen, Z. Sun, S. Feng, J. Zhao, X. Dong, W. Huang and T. Yu, Adv. Funct. Mater., 2017, 27, 1603603 CrossRef.
- H. Xu, M. Zeng, J. Li and X. Tong, RSC Adv., 2015, 5, 91493–91499 RSC.
- M. Park, Y. Kang, G. Wang, S. Dou and H. Liu, Adv. Funct. Mater., 2008, 18, 455–461 CrossRef CAS.
- H. Xu, J. Chen, D. Wang, Z. Sun, P. Zhang, Y. Zhang and X. Guo, Carbon, 2017, 124, 565–575 CrossRef CAS.
- Y. Wang, Z. X. Huang, Y. Shi, J. I. Wong, M. Ding and H. Y. Yang, Sci. Rep., 2015, 5, 9164 CrossRef PubMed.
- L. Liu, M. An, P. Yang and J. Zhang, Sci. Rep., 2015, 5, 9055 CrossRef CAS PubMed.
- Y. Zhao, C. Wei, S. Sun, L. P. Wang and Z. J. Xu, Adv. Sci., 2015, 2, 1500097 CrossRef PubMed.
- Z. Li, J. Ding, H. Wang, K. Cui, T. Stephenson, D. Karpuzov and D. Mitlin, Nano Energy, 2015, 15, 369–378 CrossRef CAS.
- R. Shen, Y. Hong, J. J. Stankovich, Z. Wang, S. Dai and X. Jin, J. Mater. Chem. A, 2015, 3, 17635–17643 CAS.
- W. Li, D. Yoon, J. Hwang, W. Chang and J. Kim, J. Power Sources, 2015, 293, 1024–1031 CrossRef CAS.
- S. H. Choi, J. Lee and Y. C. Kang, Nano Res., 2015, 8, 1584–1594 CrossRef CAS.
- H. Liu, B. H. Liu and Z. P. Li, Solid State Ionics, 2016, 294, 6–14 CrossRef CAS.
- A. Kim, J. S. Kim, C. Hudaya, D. Xiao, D. Byun, L. Gu, X. Wei, Y. Yao, R. Yu and J. K. Lee, Carbon, 2015, 94, 539–547 CrossRef CAS.
- Y. Liu, P. Liu, D. Wu, Y. Huang, Y. Tang, Y. Su, F. Zhang and X. Feng, Chem.–Eur. J., 2015, 21, 5617–5622 CrossRef CAS PubMed.
- C. Zhu, S. Zhu, K. Zhang, Z. Hui, H. Pan, Z. Chen, Y. Li, D. Zhang and D. Wang, Sci. Rep., 2016, 6, 25829 CrossRef CAS PubMed.
- L. Liu, F. Xie, J. Lyu, T. Zhao, T. Li and B. G. Choi, J. Power Sources, 2016, 321, 11–35 CrossRef CAS.
| This journal is © The Royal Society of Chemistry 2018 |

