
 Open Access Article
 This Open Access Article is licensed under a
 Creative Commons Attribution 3.0 Unported Licence
Cell imaging of dopamine receptor using agonist labeling iridium(III) complex†
Kasipandi
Vellaisamy‡
a,
Guodong
Li‡
b,
Chung-Nga
Ko‡
a,
Hai-Jing
Zhong
b,
Sarwat
Fatima
c,
Hiu-Yee
Kwan
c,
Chun-Yuen
Wong
 d,
Wai-Jing
Kwong
*a,
Weihong
Tan
*ef,
Chung-Hang
Leung
*b and
Dik-Lung
Ma
*a
d,
Wai-Jing
Kwong
*a,
Weihong
Tan
*ef,
Chung-Hang
Leung
*b and
Dik-Lung
Ma
*a
aDepartment of Chemistry, Hong Kong Baptist University, Kowloon Tong, Hong Kong, China. E-mail: edmondma@hkbu.edu.hk; dkwong@hkbu.edu.hk
bState Key Laboratory of Quality Research in Chinese Medicine, Institute of Chinese Medical Sciences, University of Macau, Macau, China. E-mail: duncanleung@umac.mo
cSchool of Chinese Medicine, Hong Kong Baptist University, Kowloon Tong, Hong Kong, China
dDepartment of Biology and Chemistry, City University of Hong Kong, Kowloon Tong, Hong Kong, China
eDepartment of Chemistry, Department of Physiology and Functional Genomics, Center for Research at the Bio/Nano Interface, Shands Cancer Center, UF Genetics Institute, McKnight Brain Institute, University of Florida, Gainesville, USA. E-mail: tan@chem.ufl.edu
fMolecular Sciences and Biomedicine Laboratory, State Key Laboratory for Chemo/Biosensing and Chemometrics, College of Chemistry and Chemical Engineering, College of Biology, Hunan University, Changsha, China
First published on 19th December 2017
Abstract
Dopamine receptor expression is correlated with certain types of cancers, including lung, breast and colon cancers. In this study, we report luminescent iridium(III) complexes (11–14) as intracellular dopamine receptor (D1R/D2R) cell imaging agents. Complexes 11 and 13, which are conjugated with a dopamine receptor agonist, showed superior cell imaging characteristics, high stability and low cytotoxicity (>100 μM) in A549 lung cancer cells. siRNA knockdown and dopamine competitive assays indicated that complexes 11 and 13 could selectively bind to dopamine receptors (D1R/D2R) in A549 cells. Fluorescence lifetime microscopy demonstrated that complex 13 has a longer luminescence lifetime at the wavelength of 560–650 nm than DAPI and other chromophores in biological fluids. The long luminescence lifetime of complex 13 not only provides an opportunity for efficient dopamine receptor tracking in biological media, but also enables the temporal separation of the probe signal from the intense background signal by fluorescence lifetime microscopy for efficient analysis. Complex 13 also shows high photostability, which could allow it to be employed for long-term cellular imaging. Furthermore, complex 13 could selectively track the internalization process of dopamine receptors (D1R/D2R) in living cells. To the best of our knowledge, complex 13 is the first metal-based compound that has been used to monitor intracellular dopamine receptors in living cells.
Introduction
Lung cancer is a leading cause of death in both developed and developing countries.1 Non-small cell lung cancer (NSCLC) is the most common subtype of lung cancer, with a 5 year survival rate less than 15%.2 Angiogenesis, mediated by vascular endothelial growth factor (VEGF) and the VEGF receptor (VEGFR), is important for cancer cell proliferation.3 Recently, Basu and coworkers have reported that a dopamine 2 receptor (D2R) agonist is able to inhibit angiogenesis.4 Studies with a D2R-knockout mouse model have indicated the molecular mechanism through which D2R/VEGFR-2 crosstalk can mediate the phosphorylation of VEGFR-2. Dopamine receptors also serve as good targets for breast and colon cancers.5Early-stage identification of cancer is a high priority in research.5,6 Therefore, the development of methods for the detection of cancer biomarkers in living systems has attracted tremendous interest.7–9 Studies have shown that dopamine receptor (D1R/D2R) expression is higher in NCI-H69 NSCLC cells.10 Previously, the expression of the dopamine (D1/D2) receptor in these cells has been monitored using an iodosulpride isotope probe11 which is subjected to biases caused by the incubation of isotope. Fluorescent probes12–14 and biotin derivatives15 of dopamine agonists have also been developed as probes of D1R and D2R, whereas nitrobenzoxadiazole (NBD) and fluorescein-coupled dopamine agonists have been applied in the fluorescent labelling of D1R and D2R sites in monkey pituitary gland. However, these probes are generally limited by their short luminescence lifetimes (1–10 ns) and the phenomenon of self-quenching, photobleaching and fluorescence resonance energy transfer (FRET). Although radiolabelled probes for dopamine receptors include S-labeled cRNA probes and [123I] N3-NAP have been extensively reported,16–21 great caution is required when handling these radioactive materials. To the best of our knowledge, metal complex probes capable of identifying dopamine receptors (D1R and D2R) in living cells have not yet been developed. In particular, the long luminescence lifetime, large Stokes shift, high luminescence quantum yield and high photostability properties of iridium(III) complexes render them an excellent alternative agent for dopamine tracking.30,31
In this study, four cyclometalated iridium(III) complexes 11–14 with general structure [Ir(N–C)2(N–N)](PF6) (where N–N = 3-(3,4-dihydroxyphenylagonistsagonists)-N-(1,10-phenanthrolin-5-yl) propanamide (6) or 4-(2-(1,10-phenanthroline-5-carboxamido)ethyl)-1,2-phenylene diacetate (9) and N–C = 2-phenylpyridine (ppy), 2-(2,4-difluorophenyl)pyridine (dfppy), or 2-phenylquinoline (pq)) were designed and synthesised (Scheme 1). As ligands 6 and 9 are derived from dopamine agonists, we hypothesized that the conjugated complexes would be able to effectively recognize dopamine receptors (D2R/D1R). Notably, complexes 11 and 13, showed superior cell imaging characteristics, high stability and low cytotoxicity (>100 μM) in A549 lung cancer cells. siRNA knockdown and dopamine competitive assays indicated that complexes 11 and 13 could selectively bind to dopamine receptors (D1R/D2R) in A549 cells. Furthermore, complex 13 possesses useful photophysical properties including long luminescence lifetimes, high photostability and high luminescence quantum yield. Since most of the background fluorescence in cell medium has a luminescence lifetime of less than 3 ns, the relatively longer luminescence lifetime for complex 13 should enable the temporal separation of the probe signal from the intense background signal by fluorescence lifetime microscopy. To the best of our knowledge, this is the first application of iridium(III) complexes for imaging D2R/D1R within living cells.
 | ||
| Scheme 1 Iridium(III) dopamine complexes as D1R and D2R probes. | ||
Results and discussions
Synthesis of N^N ligands 6 and 9
We envisaged that conjugating dopamine agonists, such as dopamine or 3-(3,4-dihydroxyphenyl)propanoic acid (1),22 to an iridium(III) scaffold could generate effective probes for dopamine receptors (D1R and D2R). In our designed strategy, the dopamine agonists were conjugated to N^N ligands 6 and 9.To synthesize ligand 6, compound 1 was first converted to the corresponding methyl ester (2) in acidic conditions using MeOH as solvent (Scheme S1†).23–25 Compound 2 was protected as the tetrahydropyranyl ethers (THP) using pyridinium p-toluenesulfonate (PPTS) in dry DCM to generate compound 3 in 62% yield.26 Subsequently, the THP-protected methyl ester (3) was selectively hydrolyzed using LiOH to furnish the corresponding THP-protected acid (4) after acidic workup. Compound 4 was then coupled with 1,10-phenanthrolin-5-amine using standard 1-ethyl-3-(3-dimethylaminopropyl)carbodiimide (EDCI) coupling to generate compound 5. Finally, THP deprotection with a catalytic amount of PPTS in EtOH produced ligand 6 with a yield of 94%. Ligand 6 was characterized by NMR spectroscopy and HRMS (Fig. S1 and S2†).
Ligand 9 was generated in 62% yield from an acetylated dopamine derivative (8) and 1,10-phenanthroline-5-carboxylic acid (7) using EDCI coupling (Scheme S2†). Ligand 9 was characterized by NMR spectroscopy and HRMS (Fig. S9 and S10†).
Iridium(III) complexes synthesis
Complexes 11–14 were synthesised in good yields (85–91%) by reacting two equivalents of N^N ligands (6 or 9) and the corresponding cyclometalated iridium(III) dimers in CH2Cl2/CH3OH (1![[thin space (1/6-em)]](https://www.rsc.org/images/entities/char_2009.gif) :1, v/v), followed by chloride anion exchange with NH4PF6. Complexes 11–14 were purified by silica gel column chromatography and characterized by 1H, 13C NMR spectroscopy and MALDI-HRMS. The photophysical properties of complexes 11–14, including their luminescence quantum yields, emission properties and UV-vis absorption properties were measured in ACN and are reported in Table S1.† Excitation of 13 (10 μM) at 334 nm produced a maximum emission at 558 nm which is assigned to the metal-to-ligand charge-transfer (MLCT) state and is typical for iridium(III) complexes. Complex 13 also displays large Stokes shift of 215 nm, which is considerably larger than those generally displayed by organic molecules and can efficiently prevent self-quenching. UV-vis absorption spectra of complexes 11–14 are presented in Fig. S13.† Complex 13 exhibited an intense absorption at 255 and 280 nm and a moderate peak at 331 and 446 nm in CH2Cl2. The bands are assigned to the promotion of electrons based on the ligand-centered (π–π*) transition and the metal-to-ligand charge transfer (MLCT) transition respectively. Furthermore, complexes 13 and 14 were both stable in a DMSO-d6 and D2O mixture (9:1) at 25 °C for seven days, as revealed by NMR spectroscopy, indicating that the acetyl groups of 14 are sufficiently stable to hydrolysis under ambient conditions (Fig. S14 and S15†). Among the four complexes, complex 13 showed the highest luminescence quantum yield of 0.245 and a long luminescence lifetime of 4.61 μs. Complexes 11 and 14 also showed long luminescence lifetimes of 4.36 and 4.65 μs respectively. In contrast, complex 12 was non-emissive. The long luminescence lifetimes exhibited by iridium(III) complexes 11, 13 and 14 could enable their emission to be distinguished from background fluorescence by the use of time-resolved emission spectroscopy (TRES).
:1, v/v), followed by chloride anion exchange with NH4PF6. Complexes 11–14 were purified by silica gel column chromatography and characterized by 1H, 13C NMR spectroscopy and MALDI-HRMS. The photophysical properties of complexes 11–14, including their luminescence quantum yields, emission properties and UV-vis absorption properties were measured in ACN and are reported in Table S1.† Excitation of 13 (10 μM) at 334 nm produced a maximum emission at 558 nm which is assigned to the metal-to-ligand charge-transfer (MLCT) state and is typical for iridium(III) complexes. Complex 13 also displays large Stokes shift of 215 nm, which is considerably larger than those generally displayed by organic molecules and can efficiently prevent self-quenching. UV-vis absorption spectra of complexes 11–14 are presented in Fig. S13.† Complex 13 exhibited an intense absorption at 255 and 280 nm and a moderate peak at 331 and 446 nm in CH2Cl2. The bands are assigned to the promotion of electrons based on the ligand-centered (π–π*) transition and the metal-to-ligand charge transfer (MLCT) transition respectively. Furthermore, complexes 13 and 14 were both stable in a DMSO-d6 and D2O mixture (9:1) at 25 °C for seven days, as revealed by NMR spectroscopy, indicating that the acetyl groups of 14 are sufficiently stable to hydrolysis under ambient conditions (Fig. S14 and S15†). Among the four complexes, complex 13 showed the highest luminescence quantum yield of 0.245 and a long luminescence lifetime of 4.61 μs. Complexes 11 and 14 also showed long luminescence lifetimes of 4.36 and 4.65 μs respectively. In contrast, complex 12 was non-emissive. The long luminescence lifetimes exhibited by iridium(III) complexes 11, 13 and 14 could enable their emission to be distinguished from background fluorescence by the use of time-resolved emission spectroscopy (TRES).
To validate this hypothesis, coumarin 460 (Cm-460) or thioflavin S (THS) was employed as model matrix interferents. In contrast to the iridium(III) complexes, organic fluorophores typically show nanosecond luminescence lifetimes. When the luminescence spectra were recorded directly after the excitation pulse without any delay (λexc = 355 nm), Cm-460 exhibited a strong emission peak at 455 nm while THS exhibited a moderate peak at 540 nm. Therefore, the peak of complex 13 was partially obscured by the trailing edge and the overlapping emission peaks of Cm-460 and THS, respectively (Fig. 1a and c). In contrast, when the luminescence spectra were recorded with a delay of 333 ns after the excitation pulse, the short-lived fluorescence of Cm-460 and THS were eliminated, and the emission of complex 13 became more evident (Fig. 1b and d).
 | ||
| Fig. 1 Time-resolved fluorescence emission spectra of complex 13 in PBS buffer (pH = 7.0, 25 °C) in the presence of Cm-460 at (a) delay = 0 ns and (b) delay = 333 ns or with THS at (c) delay = 0 ns and (d) delay = 333 ns. The peak of complex 13 was partially obscured by the emission peaks of the fluorescent media when delay = 0 ns, while the peak of complex 13 became more evident when delay = 333 ns. | ||
Cytotoxicity and cell staining in A549 cells
In consideration of the promising luminescent behaviour shown by transition-metal complexes, the cytotoxicity of complexes 11–14 was measured in A549 cells, a human NSCLC cell line with dopamine receptor expression, using the MTT (3-(4,5-dimethylthiazol-2-yl)-2,5-diphenyltetrazolium bromide) assay. The results revealed that complexes 11–13 exhibited IC50 values above 100 μM, whereas complex 14 showed an IC50 value of 70.79 μM (Fig. S16†). This indicates that all of complexes are relatively nontoxic to cells, making them suitable for cell staining experiments.We next investigated the application of the iridium(III) complexes for cell staining. A549 cells were incubated with complexes 11–14 (30 μM) for 1 h and then washed with phosphate buffer. Luminescence imaging using a confocal laser scanning microscope with excitation at 488 nm revealed that complexes 11, 13 and 14 showed strong luminescence in A549 cells (Fig. 2), with luminescence intensity increasing with complex concentration (Fig. S18–S20†). In contrast, minimal luminescence was observed with complex 12, even when the concentration of the complex was increased to 60 μM (Fig. S17†). We presume that complexes 11, 13 and 14 could interact strongly with the dopamine receptor (D1R/D2R) via their dopamine agonist moieties, thereby leading to an enhanced luminescence of the cell.
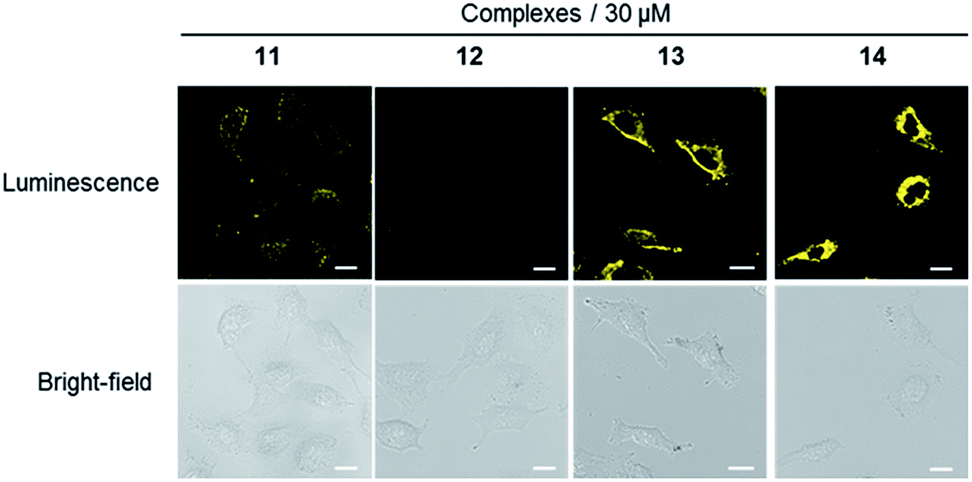 | ||
| Fig. 2 Luminescence and bright-field images of A549 cells stained with 30 μM of complexes 11–14 for 1 h. Scale bar = 15 μm. | ||
Validation of dopamine receptor binding in A549 cells
In order to verify that the complexes were interacting with dopamine receptors (D1R/D2R) in cells, siRNA knockdown experiments were performed with D1R/D2R siRNA in A549.27–29 As shown by Western blotting experiments, the levels of both D1R (Fig. 3a) and D2R (Fig. 3b) were reduced significantly in the presence of D1R/D2R siRNA, with a greater reduction for D2R. Next, complexes 11 and 13 were introduced into D1R/D2R knockdown cells. As depicted in Fig. 3c, the luminescence of complexes 11 and 13 was reduced significantly, indicating that the emission enhancement of the complexes required the presence of dopamine receptors in living cells. On the other hand, the luminescence intensity of complex 14 was relatively unaffected in the presence of D1R/D2R siRNA (Fig. S21†). This suggests that complex 14 may show nonspecific binding to molecules other than dopamine receptors in the intracellular environment. | ||
| Fig. 3 (a) The relative amount of D1R in A549 cells before or after D1R/D2R siRNA stimulation. (b) The relative amount of D2R in A549 cells before or after D1R/D2R siRNA stimulation. (c) Luminescence and bright-field images of A549 cells with D1R/D2R knockdown using siRNA. A549 cells were stained with or without complexes 11 and 13 (30 μM) for 1 h. Scale bar = 15 μm. | ||
To provide further evidence that complexes 11 and 13 interacted with dopamine receptors (D1R/D2R) in living cells, we preincubated A549 cells with an excess of dopamine (1 mM) for 1 h, before staining with complexes 11 and 13 (30 μM) for 1 h. Interestingly, the luminescence intensity of complexes 11 and 13 was decreased in the presence of dopamine (Fig. 4), suggesting that the presence of dopamine blocks the interaction between complexes and dopamine receptors (D1R/D2R) in living cells, presumably via competitive binding to dopamine receptors. Overall, complex 13 showed the highest luminescence enhancement in the cell imaging experiments, indicating that it could serve as a useful scaffold for developing probes for dopamine receptors in living cells.
 | ||
| Fig. 4 Luminescence and bright-field images of A549 cells. A549 cells were pretreated with or without dopamine (1 mM) for 1 h, followed by staining with complexes 11 and 13 (30 μM) for 1 h. Scale bar = 15 μm. | ||
Photostability of 13in cellulo
Considering that high photostability is very important for the practical application of a cellular probe for bioimaging, a photobleaching assay was performed with iridium(III) complex 13 in paraformaldehyde-fixed A549 cells. 4′,6-Diamidino-2-phenylindole (DAPI), an organic and commercial dye for staining nuclei in cells, was used as a benchmark for photostability. After continuous excitation at 405 nm for 700 s, the mean luminescence intensity of complex 13 (550–650 nm, region 2) only decreased by 4.9%. Whereas the luminescence of DAPI (430–480 nm, region 1) decreased by 39.6% (Fig. 5). This result demonstrates that 13 exhibits higher photostability compared to DAPI, indicating that 13 could be employed as a potential bioimaging luminescent probe for continuous tracking studies over a long period of time. | ||
| Fig. 5 Comparison of DAPI and 13 for resistance to photobleaching. (a) Confocal luminescence images of fixed A549 cells stained with DAPI and 13 under continuous irradiation at 405 nm with different laser scan times (0, 350, 700 s). Scale bar = 30 μm. (b) The relative mean luminescence intensity of DAPI and 13 collected from region 1 (green, 430 to 480 nm) and 2 (red, 550 to 650 nm). | ||
Complex 13 could selectively monitor the internalization of dopamine receptors in cellulo
The internalization of dopamine receptor is important for maintaining homeostatic control in the cell. We therefore explored the application of complex 13 to track the internalization of dopamine receptors (D1R/D2R) in lung cancer cells. The intracellular luminescence intensities of A549 cells treated with complex 13 (30 μM) for different times (0, 10, 30, 60 and 180 min) were monitored by using fluorescent microscopy. The results showed that luminescence of the cells increased over time and was predominantly localized in the cell boundaries within 60 min (Fig. 6). However, at 180 min, the luminescence of cell boundaries was significantly reduced while that of the cytoplasm was enhanced in a punctuated pattern (Fig. 6), indicating that complex 13 may be an agonist of dopamine receptors and has the potential to monitor the internalization of D1/D2-receptors in A549 cells. This result was also confirmed by assessing the luminescence in D1R/D2R knockdown A549 cells after 180 min incubation, which showed a decrease in the luminescence of the cytoplasm as expected (Fig. S22†). Collectively, these results suggest that complex 13 could not only target dopamine receptors (D1R/D2R), but also monitor the internalization of dopamine receptors (D1R/D2R) in living cells. | ||
| Fig. 6 A549 cells were stained by complex 13 for 0, 10, 30, 60 and 180 min. The white arrow indicates the punctuated pattern. Scale bar = 15 μm. | ||
Lifetime imaging
Considering that the long luminescence lifetime of transition metal complexes could overcome issues of an endogenous fluorescent background signal, 13-stained A549 cells were visualized with fluorescence lifetime imaging microscopy (FLIM) to demonstrate the merits of 13 in bioimaging. Most of the background fluorescence has a luminescence lifetime of less than 3 ns, which is in contrast to the long luminescence lifetimes of iridium(III) complexes. This large difference enables the temporal separation of the probe fluorescence signal from the intense background signal in cell media. As shown in Fig. 7a, a long luminescence lifetime about 22 ns of complex 13 in cell boundaries and the cytoplasm (blue) was detected by using a Leica TCS SP5 confocal laser scanning microscope system in A549 cells after 1 h incubation. An MP laser with two-photon excitation light of 800 nm was used for excitation. The FLIM images consisted of 512 × 512 pixels were scanned with a scan speed of 400 Hz. In contrast, DAPI only had a short luminescence lifetime in the cell nucleus (orange) in which its signal decay in 2.1 ns after the pulsed excitation (Fig. 7b). To validate the potential of 13 in bioimaging, FLIM imaging of A549 cells co-incubated with 13 and DAPI was also performed. A short excitation pulse with 80 MHz repetition rate excites all chromophores in the cell that absorb at the excitation wavelength, including complex 13 and DAPI in the cell medium. As observed from Fig. 7c, complex 13 showed a longer apparent lifetime than DAPI in A549 cells (scale range from 0 ns (red) to 24 ns (blue)), and displayed a longer fluorescence intensity within cell boundaries and the cytoplasm than that of DAPI in the cell nucleus (orange). The FLIM results indicate that 13 has a longer apparent lifetime within the cell than DAPI, suggesting that 13 is suitable for the long-lived luminescence imaging even in the presence of an endogenous fluorescence background signal. | ||
| Fig. 7 Fluorescence lifetime confocal images of A549 cells treated with (a) complex 13, (b) DAPI and (c) complex 13 + DAPI. The excitation light of 800 nm from the MP laser (80 MHz pulse repetition rate) was focused onto the sample with a 40× objective lens for two-photon excitation. The luminescence signals were collected with the range of 550–650 nm. | ||
Experimental
Synthesis of 3,4-dihydroxyphenylacetic acid methyl ester (2)1
A solution of 1 g (0.0054 mol) of 3,4-dihydroxyphenylacetic acid (1) in 50 mL of MeOH containing 1 mL of concentrated sulphuric acid (H2SO4) was refluxed overnight. The completion of reaction was monitored by TLC. After completion, the MeOH was evaporated, and the residue was dissolved in 50 mL of EtOAc. The ethyl acetate layer was washed with dilute NaHCO3, water, and brine, followed by drying with Na2SO4. The organic layer was evaporated to give 1.2 g of the ester 2 (97%) that was used in the next step without further purification.Synthesis of 3,4-bis-(tetrahydropyranyloxy)phenylacetic acid methyl ester (3)
A solution of 1 g (5.1 mmol) of 2 and 120 mg (0.102 mmol) of pyridinium p-tosylate in 30 mL of DCM was treated dropwise with 4.5 mL (5.1 mmol) of THP in 5 mL of DCM. The mixture became homogeneous after about 1 h, and the reaction was essentially complete. When the TLC indicated the absence of starting material, the reaction mixture was washed twice with water, dried (Na2SO4), and evaporated to give 1.8 g of 3 (98%) as a mixture of diastereoisomers, which were used in the next step without further purification.Synthesis of 3,4-bis-(tetrahydropyranyloxy)phenylacetic acid (4)
Compound 3 (1 g, 2.74 mmol) was dissolved in 20 mL of THF/water (1:1) mixture at 0 °C, followed by the addition of LiOH (3.2 mmol), and allowed to react for 1 h. When the TLC indicated the absence of starting material, the pH of the reaction mixture was adjusted to 4–5 using 5% HCl, extracted with ethyl acetate, and evaporated to give 0.9 g of 4 (98%) as a mixture of diastereoisomers, which were used in the next step without further purification.
Synthesis of 3-(3,4-dihydroxyphenyl)-N-(1,10-phenanthrolin-5-yl)propanamide (6)
5-Amino-1,10-phenanthroline (0.5 g, 2.5 mmol, 1 eq.) was dissolved in distilled DCM (50 mL) at 0 °C. Compound 4 (0.8 g, 2.5 mmol, 1 eq.) was added, followed by EDCI (0.95 g, 5 mmol, 2 eq.) and, finally, 4-dimethylaminopyridine (DMAP) (0.3 g, 2.3 mmol, 1 eq.). After complete addition of reagents, the reaction mixture was stirred at 0 °C for a further 1 h and allowed to complete for 24 h. Finally, the solvent was removed under reduced pressure, and the red colour residue was dissolved in EtOAc. The organic layer was washed with NaHCO3 (saturated) solution and dried over Na2SO4. The organic layer was evaporated and purified by column chromatography to get compound 5 (0.9 g, 75%). Compound 5 was dissolved (0.50 g, 0.94 mmol) in EtOH (10 mL), and PPTS was added (4 mg, 0.002 mmol). The resulting mixture was stirred at 55 °C for 6 h. After removal of EtOH under vacuum, the residue was washed with EtOAc and ether to give a pure white solid compound 6 (0.32 g, 94%). 1H NMR (400 MHz, DMSO) δ 9.12 (dd, J = 4.2, 1.5 Hz, 1H), 9.05 (dd, J = 4.3, 1.7 Hz, 1H), 8.46 (dd, J = 8.2, 1.7 Hz, 1H), 8.34 (dd, J = 8.4, 1.6 Hz, 1H), 8.11 (s, 1H), 7.76 (m, 2H), 6.67 (m, 2H), 6.53 (d, J = 8.0 Hz, 1H), 2.83 (d, J = 6.3 Hz, 2H), 2.77 (d, J = 5.9 Hz, 2H). 13C NMR (101 MHz, DMSO) δ 171.71, 149.75, 149.36, 145.76, 145.22, 137.42, 135.75, 131.77, 129.94, 127.47, 124.78, 123.51, 122.74, 120.36, 118.87, 115.94, 115.53, 37.98, 30.56. HRMS: calcd for C21H17N3O3: 359.3780 found [M + 1]+: 360.1609.Synthesis of 4-(2-(1,10-phenanthroline-5-carboxamido)ethyl)-1,2-phenylene diacetate (9)
4-(2-Aminoethyl)-1,2-phenylene diacetate (0.7 g, 3.12 mmol, 1 eq.) was dissolved in distilled DCM (30 mL) at 0 °C. Compound 7 (1.28 g, 4.68 mmol, 1.5 eq.) was added, followed by 1-ethyl-3-(3-dimethylaminopropyl)carbodiimide (EDCI) (0.95 g, 5 mmol, 2 eq.), HOBt (0.42 g, 3.12 mmol, 1 eq.), and, finally, Et3N (0.63 g, 6.3 mmol, 2 eq.). After complete addition of reagents, the reaction mixture was stirred at 0 °C for a further 1 h and allowed to complete for 24 h. Completion of reaction was monitored by TLC using MeOH/DCM (10:90). The solvent was removed under reduced pressure, and the red colour residue was dissolved in EtOAc. The organic layer was washed with NaHCO3 (saturated) solution and dried over Na2SO4. The organic layer was evaporated and purified by column chromatography to get compound 9 (0.5 g, 62%). 1H NMR (400 MHz, CDCl3) δ 9.01 (d, J = 3.0 Hz, 2H), 8.49 (dd, J = 8.4, 1.5 Hz, 1H), 8.08 (dd, J = 8.1, 1.4 Hz, 1H), 7.57 (s, 1H), 7.50 (ddd, J = 10.3, 8.3, 4.3 Hz, 2H), 7.20 (s, 1H), 7.12 (m, 3H), 6.75 (s, 1H), 3.81 (dd, J = 12.7, 6.4 Hz, 2H), 3.03 (t, J = 6.6 Hz, 2H), 2.25 (s, 3H), 2.22 (s, 3H). 13C NMR (101 MHz, CDCl3) δ 168.45, 168.40, 168.03, 151.25, 150.35, 142.13, 140.77, 137.77, 136.76, 134.41, 132.87, 127.03, 126.93, 125.72, 125.57, 124.10, 123.69, 123.49, 123.42, 40.86, 34.84, 20.75, 20.71. HRMS: calcd for C25H21N3O5Na: 466.1373 found [M + Na]+: 466.1352.
Materials and cell lines
All chemicals were purchased from Sigma-Aldrich and were used as received. Lipofectamine™ 3000 reagent was purchased from Invitrogen (Carlsbad, CA, USA). Fetal bovine serum (FBS) and Dulbecco's Modified Eagle's Medium (DMEM) were purchased from Gibco BRL (Gaithersburg, MD, USA).Cell viability assay
A549 cells were seeded at the density of 5000 cells per well in 96 well plates and incubated for 12 h. Complexes dissolved in DMSO were added to cells at indicated concentrations for 48 h, respectively. Then 10 μL of 5 mg mL−1 MTT (3-(4,5-dimethylthiazol-2-yl)-2,5-diphenyltetrazolium bromide) reagent were added to each well. After 4 h incubation in the dark, 100 μL of DMSO were added to each well, and the intensity of absorbance was determined by a SpectraMax M5 microplate reader at a wavelength of 570 nm.Cell imaging
A549 cells were seeded into a glass-bottomed dish (35 mm dish with 20 mm well). After 24 h, the cells were incubated with complexes for indicated time periods or concentrations and then washed with phosphate-buffered saline three times. The luminescence imaging of complexes in cells was carried out by a Leica TCS SP8 confocal laser scanning microscope system. The excitation wavelength was 488 nm.Immunoblotting
A549 cells were harvested in lysis buffer after knockdown treatment, and the protein concentration was determined by using the BCA assay. Total proteins were separated on SDS-polyacrylamide gel electrophoresis and then transferred onto polyvinylidene difluoride membranes (Millipore). After 1 h incubation with blocking buffer at room temperature, membranes were incubated with the primary antibodies at 4 °C overnight and the secondary antibodies for 1 h incubation at room temperature. The protein bands were then stained by ECL Western Blotting Detection Reagent (GE Healthcare) and visualized using the ChemiDoc™ MP Imaging System.Dopamine D1/D2 receptor knockdown assay
A549 cells were seeded in 6 well plates at about 80% confluence in DMEM for 12 h. Lipofectamine™ 3000 reagent and siRNA were gently mixed in FBS-free DMEM medium. After 15 min incubation at room temperature, 500 μL of siRNA-lipid complex were directly added to cells in 1.5 mL DMEM culture medium. Then, A549 cells were incubated at 37 °C in a CO2 incubator for 48 h before use.Photobleaching assay and FLIM imaging
A549 cells were seeded into a confocal glass-bottomed dish (35 mm dish with 20 mm well) and incubated at 37 °C for 12 h. Subsequently, complex 13 (30 μM) was added and the wells were further incubated for 1 h. Before cell imaging, cells were pre-fixed with 4% paraformaldehyde for 15 min, followed by washing three times with phosphate-buffered saline. DAPI staining solution was added and the wells were incubated for 3 min. After washing in phosphate-buffered saline, fluorescence imaging was carried out with continuous excitation (λ = 405 nm) for 700 s using a Leica TCS SP8 confocal laser scanning microscope. For FLIM imaging, complex 13 (60 μM) was added and the wells were incubated for 1 h. The cells were pre-fixed with 4% paraformaldehyde for 15 min, followed by washing three times with phosphate-buffered saline. DAPI staining solution or buffer was added and the wells were further incubated for 3 min, followed by imaging using a Leica TCS SP5 confocal laser scanning microscope with a 40× objective lens. An MP laser with 800 nm two-photon excitation wavelength and 80 MHz repetition rate were used for excitation. The luminescence signals were collected in the range of 550–650 nm. Photoluminescence lifetime images with 512 × 512 pixels were acquired with scan speed of 400 Hz. The images were recorded after an excitation pulse without any time delay. Finally, the FLIM data were analyzed using a pixel-based fitting software (SPCImage, Becker & Hickl). An incomplete decay model in SPCImage software was employed for the calculation of lifetime for complex 13.Conclusions
Four iridium(III) complexes (11–14) bearing dopamine or 3-(3,4-dihydroxyphenyl)propanoic acid as dopamine agonists were synthesized. Among the synthesized complexes, complexes 11 and 13 displayed superior photophysical characteristics and high stability in living cells. Moreover, D1R/D2R siRNA knockdown and dopamine competition experiments suggested that complexes 11 and 13 could selectively bind to dopamine receptors (D1R/D2R) in living cells. Finally, the photostable complex 13 could also be used to monitor the internalization of dopamine receptors (D1R/D2R) in living cells, and its application for long-lived luminescence imaging even in the presence of endogenous fluorescence background signal was also demonstrated using FLIM. We envisage that these complexes could serve as useful scaffolds for the development of luminescent dopamine receptors cell imaging probes.Conflicts of interest
There are no conflicts to declare.Acknowledgements
This work is supported by Hong Kong Baptist University (FRG2/15-16/002), the Health and Medical Research Fund (HMRF/14130522 and HMRF/14150561), the Research Grants Council (HKBU/12301115, HKBU/204612, HKBU/201913 and CityU/11228316), the National Natural Science Foundation of China (21575121, 21628502 and 21775131), the Guangdong Province Natural Science Foundation (2015A030313816), Innovation and Technology Fund (ITS/260/16FX), the Hong Kong Baptist University Century Club Sponsorship Scheme 2017, the Interdisciplinary Research Matching Scheme (RC-IRMS/15-16/03), the Science and Technology Development Fund, Macao SAR (077/2016/A2), and the University of Macau (MYRG2015-00137-ICMS-QRCM, MYRG2016-00151-ICMS-QRCM, MRG044/LCH/2015/ICMS).Notes and references
- A. Jemal, F. Bray, M. M. Center, J. Ferlay, E. Ward and D. Forman, Ca-Cancer J. Clin., 2011, 61, 69–90 CrossRef PubMed.
- K. Cetin, D. S. Ettinger, Y.-j. Hei and C. D. O'Malley, Clin. Epidemiol., 2011, 3, 13 Search PubMed.
- S. Basu, C. Sarkar, D. Chakroborty, J. Nagy, R. B. Mitra, P. S. Dasgupta and D. Mukhopadhyay, Cancer Res., 2004, 64, 5551–5555 CrossRef CAS PubMed.
- L. H. Hoeppner, Y. Wang, A. Sharma, N. Javeed, V. P. Van Keulen, E. Wang, P. Yang, A. C. Roden, T. Peikert and J. R. Molina, Mol. Oncol., 2015, 9, 270–281 CrossRef CAS PubMed.
- J. Sheng, J. Gan and Z. Huang, Med. Res. Rev., 2013, 33, 1119–1173 CrossRef CAS PubMed.
- X.-B. Zhang, Z. Wang, H. Xing, Y. Xiang and Y. Lu, Anal. Chem., 2010, 82, 5005–5011 CrossRef CAS PubMed.
- S. K. Arya and S. Bhansali, Chem. Rev., 2011, 111, 6783–6809 CrossRef CAS PubMed.
- D. Feng, Y. Song, W. Shi, X. Li and H. Ma, Anal. Chem., 2013, 85, 6530–6535 CrossRef CAS PubMed.
- Z. Li, X. Gao, W. Shi, X. Li and H. Ma, Chem. Commun., 2013, 49, 5859–5861 RSC.
- D. Ferone, M. Arvigo, C. Semino, P. Jaquet, A. Saveanu, J. E. Taylor, J.-P. Moreau, M. D. Culler, M. Albertelli and F. Minuto, Am. J. Physiol.: Endocrinol. Metab., 2005, 289, E1044–E1050 CrossRef CAS PubMed.
- S. E. Senogles, Anti-Cancer Drugs, 2007, 18, 801–807 CrossRef CAS PubMed.
- F. J. Monsma, A. C. Barton, H. C. Kang, D. L. Brassard, R. P. Haugland and D. R. Sibley, J. Neurochem., 1989, 52, 1641 CrossRef CAS PubMed.
- S. L. Vincent, Y. Khan and F. M. Benes, Synapse, 1995, 19, 112 CrossRef CAS PubMed.
- V. Bakthavachalam, N. Baindur, B. K. Madras and J. L. Neumeyer, J. Med. Chem., 1991, 34, 3235–3241 CrossRef CAS PubMed.
- B. K. Madras, D. Canfield, C. Pfaelzer, F. Vittimberga, M. Difiglia, N. Aronin, V. Bakthavachalam, N. Baindur and J. L. Neumeyer, Mol. Pharmacol., 1990, 37, 833–839 CAS.
- M. A. Ariano, F. J. Monsma, A. C. Barton, H. C. Kang, R. P. Haugland and D. R. Sibley, Proc. Natl. Acad. Sci. U. S. A., 1989, 86, 8570–8574 CrossRef CAS.
- C. Le Moine and B. Bloch, J. Comp. Neurol., 1995, 355, 418–426 CrossRef CAS PubMed.
- N. Amlaiky and M. G. Caron, J. Biol. Chem., 1985, 260, 1983–1986 CAS.
- M. M. Kong, A. Hasbi, M. Mattocks, T. Fan, B. F. O'Dowd and S. R. George, Mol. Pharmacol., 2007, 72, 1157–1170 CrossRef CAS PubMed.
- M. Hakim, Y. Y. Broza, O. Barash, N. Peled, M. Phillips, A. Amann and H. Haick, Chem. Rev., 2012, 112, 5949–5966 CrossRef CAS PubMed.
- A. B. Chinen, C. M. Guan, J. R. Ferrer, S. N. Barnaby, T. J. Merkel and C. A. Mirkin, Chem. Rev., 2015, 115, 10530–10574 CrossRef CAS PubMed.
- M. Y. S. Kalani, N. Vaidehi, S. E. Hall, R. J. Trabanino, P. L. Freddolino, M. A. Kalani, W. B. Floriano, V. W. T. Kam and W. A. Goddard, Proc. Natl. Acad. Sci. U. S. A., 2004, 101, 3815–3820 CrossRef PubMed.
- J. Narayanan, Y. Hayakawa, J. Fan and K. L. Kirk, Bioorg. Chem., 2003, 31, 191–197 CrossRef CAS PubMed.
- N. M. Gueddouda, M. R. Hurtado, S. Moreau, L. Ronga, R. N. Das, S. Savrimoutou, S. Rubio, A. Marchand, O. Mendoza, M. Marchivie, L. Elmi, A. Chansavang, V. Desplat, V. Gabelica, A. Bourdoncle, J.-L. Mergny and J. Guillon, ChemMedChem, 2017, 12, 146 CrossRef CAS PubMed.
- A. Bedrat, L. Lacroix and J.-L. Mergny, Nucleic Acids Res., 2016, 44, 1746–1759 CrossRef PubMed.
- M. Miyashita, A. Yoshikoshi and P. A. Grieco, J. Org. Chem., 1977, 42, 3772–3774 CrossRef CAS.
- J.-j. Xu, S.-y. Wang, Y. Chen, G.-p. Chen, Z.-q. Li, X.-y. Shao, L. Li, W. Lu and T.-y. Zhou, Acta Pharmacol. Sin., 2014, 35, 889–898 CrossRef CAS PubMed.
- M. Moreno-Smith, C. Lu, M. M. Shahzad, G. N. A. Pena, J. K. Allen, R. L. Stone, L. S. Mangala, H. D. Han, H. S. Kim and D. Farley, Clin. Cancer Res., 2011, 17, 3649–3659 CrossRef CAS PubMed.
- J. Gan, J. Sheng and Z. Huang, Sci. China: Chem., 2011, 54, 3–23 CrossRef CAS.
- C. Liu, C. Yang, L. Lu, W. Wang, W. Tan, C.-H. Leung and D.-L. Ma, Chem. Commun., 2017, 53, 2822 RSC.
- L.-J. Liu, W. Wang, S.-Y. Huang, Y. Hong, G. Li, S. Lin, J. Tian, Z. Cai, H.-M. D. Wang and D.-L. Ma, Chem. Sci., 2017, 8, 4756 RSC.
Footnotes |
| † Electronic supplementary information (ESI) available. See DOI: 10.1039/c7sc04798c |
| ‡ These authors contributed equally to this work. |
| This journal is © The Royal Society of Chemistry 2018 |