
Synthesis of α-glycosidase hybrid nano-flowers and their application for enriching and screening α-glycosidase inhibitors
Kang
Qian†
 b,
Han
Wang†
a,
Jieming
Liu
a,
Shuting
Gao
b,
Weiting
Liu
b,
Xi
Wan
b,
Yuanyuan
Zhang
b,
Qing-Shan
Liu
*c and
Xiao-Ying
Yin
*a
b,
Han
Wang†
a,
Jieming
Liu
a,
Shuting
Gao
b,
Weiting
Liu
b,
Xi
Wan
b,
Yuanyuan
Zhang
b,
Qing-Shan
Liu
*c and
Xiao-Ying
Yin
*a
aCollege of Chemistry and Chemical Engineering, Shanghai University of Engineering Science, Shanghai, 201620, China. E-mail: ncyxoy@163.com; Tel: +86-021-67791220
bCollege of Pharmacy, Jiangxi University of Traditional Chinese Medicine, Nanchang, 330004, China
cChina Key Lab of Ministry of Education, National Research Center for Chinese Minority Medicine, Minzu University of China, Beijing, 100081, China
First published on 24th November 2017
Abstract
To rapidly and accurately screen compounds present in traditional Chinese herbal medicines for α-glycosidase inhibitors, we synthesized a novel nano-affinity material to enable the targeted screening and enrichment of α-glycosidase inhibitors. This nano-affinity material was synthesized by self-assembly involving α-glycosidase and Cu2+. A systematic analysis revealed the flower-like structure of this nano-material, with a diameter of 7.564 μm. The highest enzyme activity was 214.03% compared to free enzymes. This novel material was used to screen and enrich α-glycosidase inhibitors from Chinese rhubarb. Ten compounds were detected. Of these, L-epicatechin and anthraquinone displayed inhibitory activity. This novel nano-hybrid affinity material allows the rapid screening and separation of active components in complex systems.
1. Introduction
The lead compound is the first link in new drug research and occupies an important strategic position in the search for novel compounds. Lead compounds can be selected from those used in traditional Chinese medicine (TCM), which is an important source of innovative drugs.1–3 Pharmacological screening methods for TCM include animal models and cell models.4 These methods are not suitable for the screening of active components in complex systems that are found in small amounts because of their high cost, low efficiency, long experimental period, and high rate of false positives. Therefore, the efficient detection and separation of microactive components in complex systems is urgently needed to establish a targeted screening method.At present, the main methods to screen targeted drugs used in Chinese medicine for their active ingredients are biological affinity chromatography,5–7 immobilized enzyme technology,8 G-quadruplex recognition, and NMR.9 Immobilized enzyme technology is the most widely used for enzyme inhibitor screening. Commonly used immobilized enzyme carriers include chitosan, silica, monoliths, and nanomaterials consisting of nanoparticles,10 nanodisks,11 nanorods,12 nanotubes,13 nanowires,14 and nanocapsules,15 and each carrier has its own unique characteristics. Additional new nanomaterials are currently being explored to enhance the activity and stability of target proteins.
Protein hybrid nano-flowers (PHNFs) are used in immobilized enzyme technology, in which the target protein and metal ions are combined into new affinity nanomaterials that can undergo self-assembly to achieve target-specific screening. Nano-flowers have been a robust area of research in the field of nanomaterials in recent years. They are mainly used in the fields of biocatalysis, biosensing, drug delivery, and cell imaging.16–19 Protein hybrid nano-flowers have a higher specific surface area and active function because of their unique topography and complex structure. Because of their natural three-dimensional conformation and activity, they possess superior properties compared to those of low-dimensional materials. Protein hybrid nano-flowers greatly increase the activity and stability of enzymes, and successfully overcome the low reproducibility of protein sensitivity to the environment and the complexity of the purification process.20,21 For example, Lin et al. synthesized Cu2+–horseradish peroxidase (HRP) hybrid nano-flowers and demonstrated that 506% enhancement of enzymatic activity in the hybrid nano-flowers could be achieved compared with free HRP in solution.22 Esra et al. synthesized Fe2+–HRP hybrid nano-flowers and demonstrated an Fe2+–HRP hybrid nano-flower catalytic activity of 512% compared to free HRP.23
For diabetic drug research, we chose α-glucosidase as an important screening target because of its anti-diabetic effect.24 To screen materials for affinity in diabetic drug research, α-glycosidase hybrid nano-flowers can be used. The active ingredients of α-glucosidase inhibitors can be screened from Chinese rhubarb (Rheum officinale) and analyzed using ultra-high-performance liquid chromatography–quadrupole time-of-flight mass spectrometry (UHPLC-QTOF-MS). This experiment established a new model for the rapid screening of active components and even traced active components in complex systems, and preliminarily elucidated the inhibitory activity of α-glucosidase in the Chinese herbal medicine pharmacopeia.
2. Experimental
2.1. Instruments and reagents
Ultra-performance liquid chromatography quadrupole time of flight mass spectrometry (UPLC-QTOF-MS) was done using a Triple TOF5600+ apparatus (Allen-Bradley, Milwaukee, WI, USA). Transmission electron microscopy (TEM) and scanning electron microscopy (SEM) were performed using a TECNAL G2 and a Quanta 200F microscope, respectively (FEI, Hillsboro, OR, USA). The high-speed refrigerated centrifuge used was a Himac CF 15RX (Hitachi Koki, Tojyo, Japan). Fourier transform infrared spectrometry was done using an EQUIDUIOX-55 device (Bruker, Karlsruhe, Germany). Other equipment included a UV-5500 ultraviolet spectrophotometer (Shanghai Yuan Analysis Instrument Co., Ltd, Shanghai, China), a Milli-Q ultrapure water treatment system (Millipore, Billerica, MA, USA) and a One in a million scale (METTLER TOLEDO, Zurich, Switzerland).Alpha (α)-glucosidase (100![[thin space (1/6-em)]](https://www.rsc.org/images/entities/char_2009.gif) 000 U g−1) was purchased from Shanghai Yuanye Biological Co., Ltd (Shanghai, China). Rhubarb was purchased (batch numbers 160501 and 160801) from Jiang Xi Zhihetang Chinese Medicine Yinpian Co., Ltd (Jiangxi, China). Analytical grade Coomassie brilliant blue G-250 was purchased from Wuhan Moore Biological Technology Co. (Wuhan, China). Nitrophenol was acquired from Shanghai Biological Technology Co. (Shanghai, China). 4-Nitrobenzene-a-D-pyran glucopyranoside (PNPG) was purchased from Shanghai Original Biological Co. (Shanghai, China). Other chemicals and solvents were of analytical or high performance liquid chromatography grade.
000 U g−1) was purchased from Shanghai Yuanye Biological Co., Ltd (Shanghai, China). Rhubarb was purchased (batch numbers 160501 and 160801) from Jiang Xi Zhihetang Chinese Medicine Yinpian Co., Ltd (Jiangxi, China). Analytical grade Coomassie brilliant blue G-250 was purchased from Wuhan Moore Biological Technology Co. (Wuhan, China). Nitrophenol was acquired from Shanghai Biological Technology Co. (Shanghai, China). 4-Nitrobenzene-a-D-pyran glucopyranoside (PNPG) was purchased from Shanghai Original Biological Co. (Shanghai, China). Other chemicals and solvents were of analytical or high performance liquid chromatography grade.
2.2. Solutions
PBS comprised NaCl (18 g), KCl (0.2 g), Na2HPO4 (1.44 g) and KH2PO4 (0.24 g) in 800 mL distilled water. The pH was adjusted to 7.4 using HCl solution and distilled water was added to produce a final volume of 1 L. Sodium carbonate solution contained Na2CO3 (5.3 g) in 100 mL Mill-Q water (0.5 mol L−1). Coomassie brilliant blue R-250 contained coomassie (100 mg) in 50 mL of 90% ethanol and 100 mL of 85% PBS. The volume was made up to 1 L with distilled water and the solution was filtered.2.3. Synthesis of α-glycosidase hybrid nano-flowers (α-GHNFs)
α-Glycosidase (3 mg) was dissolved in 6 mL of PBS in a 10 mL centrifuge tube. Forty microliters of CuSO4 solution was added (120 mM) and homogenized by vortexing. The solution was left for 72 h at room temperature (25 °C). Any particulate matter was collected by centrifugation at 10000 rpm for 10 min. The supernatant was removed and PBS was added for ultrasonic washing. The centrifugation and ultrasonic washing steps were repeated several times until the supernatant in the Coomassie solution became the same blue color. The sediment was collected by centrifugation and vacuum dried at 25 °C for 48 h.
2.4. Characterization of α-GHNFs
The α-GHNFs were weighed and diluted to a concentration of 0.1–1 mg mL−1. Several drops were added to a slide. After drying, the sample was sprayed with gold and examined using a SEM. Another volume of the suspension was dispensed on a carbon-coated 100 mesh copper grid, dried and examined by TEM. α-Glycosidase, α-GHNFs and Cu3(PO4)2·3H2O were analyzed by Fourier transform infrared (FTIR) spectroscopy. The immobilization yield of the α-GHNFs is 19.99%.2.5. Synthesis conditions and properties of the α-GHNFs
:30, v/v) and ultrasonically extracted for 30 min. The mixture was centrifuged at 7000 rpm for 10 min and the supernatant was collected. One milliliter of the collected liquid was added to a 5 mL capacity volumetric flask. Two milliliters of the diluent and 1 mL of the suspension of the immobilized enzyme (0.5 mg) were added and the suspension was incubated for 30 min at 40 °C. Following centrifugation, the supernatant was examined using UPLC-QTOF-MS. Separation and detection of the components was performed using liquid chromatography-mass spectrometry using a UPLC system (Shimadzu, Tokyo, Japan) coupled with an AB5600 series tandem MS instrument (Allen-Bradley). A Zorbax RRHD Eclipse Plus C18 column (2.1 × 100 mm, 1.8 μm; Agilent, Santa Clara, CA, USA) was used for chromatographic separation. For gradient elution with the mobile phase, solvent A was 0.1% formic acid solution in water and solvent B was acetonitrile. The gradient was programmed as follows: 0 min 5% B, 4 min 20% B, 15 min 35% B, 25 min 95% B, 27 min 95% B and finally 35 min 5% B. The flow rate was 0.3 mL min−1. The column temperature was 40 °C and the injection volume was 5 μL. The mass spectrometric full-scan data were acquired in the negative ion mode from 100 to 1000 Da with a 0.9 s scan time. The electrospray ionization (ESI) conditions were: gas 1, nitrogen (60 PSI); gas 2, nitrogen (60 PSI); curtain gas (50 PSI); ion spray voltage, −4000 V; collision energy, −40 eV; fragmenter, −100 V and ion source temperature, 500 °C.
3. Results and discussion
Organic inorganic hybrid nano-flowers are synthesized using self-assembly of a combination of oxygen nitrogen or sulfur in organic macromolecules with metal ions.24 The protein induces the nucleation of the salt crystals, which serves as the ‘glue’ to bind the petals of the nanocrystals together.TEM and SEM were used to characterize the morphology of the α-GHNFs (Fig. 1). The α-GHNFs had a regular flower shape with a uniform size (7.546 μm in diameter). In addition, the surface area, pore volume and average pore diameter were measured using the BET method and the corresponding values were 35.0 m2 g−1, 0.061 cm3 g−1 and 7.07 nm, indicating the porous structure and the high surface-to-volume ratio of the hybrid nano-flowers.
 | ||
| Fig. 1 SEM and TEM images of α-GHNFs ((a) and (b) are the SEM images of α-GHN, and (c) is the TEM image). | ||
The chemical structure of the α-GHNFs was analyzed by FTIR spectroscopy (Fig. 2). In the infrared spectra (a) and (c), the peaks at 989.27–996.59 cm−1 are the symmetric stretching vibrations of PO43−, the peaks at 558.88–558.98 cm−1 are the weak symmetric stretching vibration absorption peaks indicative of phosphoric acid, and the peaks at 3220.39–3363.86 cm−1 are characteristic absorption peaks of crystal water. They demonstrate the existence of Cu3(PO4)2·3H2O. In the infrared spectra (b) and (c) the peaks at 1147.93–1428.43 cm−1 are the characteristic absorption peaks of the C–H bending vibrations from sugar. The peak at 3247.29 cm−1 is the O–H stretching vibration that indicates hydrogen bonding. The peaks at 1626.21–1647.46 cm−1 are the sugar hydration vibration peaks and the peaks at 1044.23–1103.09 cm−1 are sugar rings on the uronic acid glycosidic bond C–O stretching vibrations. The peak at 614.93–627.56 cm−1 is the symmetric stretching vibration of C–S. They demonstrate the existence of α-glycosidase. In the infrared spectrum, the α-GHNFs comprised Cu3(PO4)2·3H2O and α-glycosidase. There is no new absorption peak or displacement in the infrared spectrum (c). This indicates that the structure of α-glycosidase and Cu3(PO4)2·3H2O is basically unchanged. This indicates that it is immobilized through self-assembly.
 | ||
| Fig. 2 FTIR spectra of Cu3(PO4)2·3H2O, α-glycosidase and α-GHNFs (figure a is the FTIR spectra of the Cu3(PO4)2·3H2O, figure b is the FTIR spectra of the α-glycosidase, and figure c is the FTIR spectra of the α-GHNFs). | ||
The enzyme concentration is an important parameter in the formation process of nano-flowers. The concentration of the enzyme affects the morphology of the hybrid nano-flowers. We studied the effect of the α-glycosidase concentration on the nano-flower morphology. As the α-glycosidase concentration increased from 0.01 to 0.5 mg mL−1, the nano-flowers began to take shape (Fig. 3). At the maximum concentration, a uniform pattern was evident. As the α-glycosidase concentration was increased from 0.5 to 0.7 mg mL−1, the morphology became non-uniform. Therefore, 0.5 mg mL−1 was determined to be the optimum enzyme concentration.
 | ||
| Fig. 3 Relationship between the α-glycosidase concentration and the α-GHNF morphology (note: a, b, c, d, e, f and g represent the enzyme concentrations of 0.01, 0.03, 0.05, 0.1, 0.3, 0.5 and 0.7 mg mL−1 respectively). | ||
We investigated the effects of low (4 °C) and normal (25 °C) temperature on the synthesis of α-GHNFs, and chose 4 °C as the low temperature and 25 °C as the normal temperature. The α-GHNFs were plump and uniform in size and shape at both temperatures (Fig. 4). Therefore, temperature had little effect on the synthesis of the α-GHNFs. To minimize the effect of temperature on enzyme activity, we chose 4 °C as the reaction temperature.
 | ||
| Fig. 4 SEM of α-GHNFs at 4 °C (h) and 25 °C (i) (note: figure h and i are the SEM images of α-GHNFs under the reaction conditions of 4 °C and 25 °C temperature respectively). | ||
Concerning pH, the activity of α-GHNFs containing the same amount of enzyme was higher than the activity of α-glycosidase. The largest enzyme activity is 214.03% over the free enzyme, and the pH stability was greater compared to the free enzyme (Fig. 5). This might reflect the influence of Cu2+ on the enzyme's space configuration, which increased the enzyme activity. The optimal pH of the α-GHNFs was 3.5.
 | ||
| Fig. 5 Influence of pH on the enzymatic activity. | ||
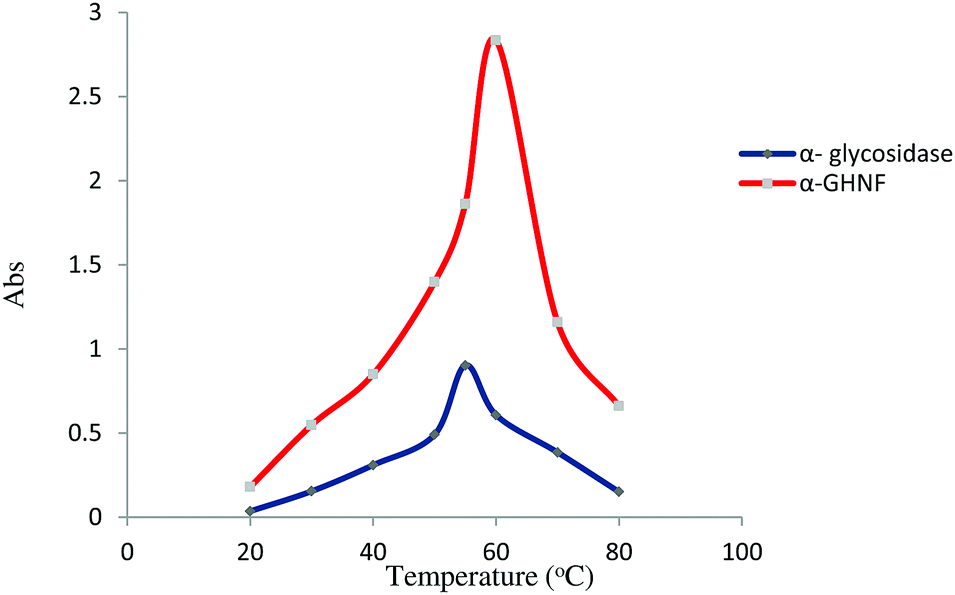
The reaction temperature is an important parameter of enzyme activity. We set a series of temperatures as a scope of investigation. The optimal temperature of the α-GHNFs and α-glycosidase was 60 °C and 55 °C, respectively (Fig. 6). The temperature tolerance of the α-GHNFs was higher than that of α-glycosidase.
 | ||
| Fig. 6 Influence of the temperature on the activity of α-GHNFs and α-glycosidase. | ||
To explore the degree of tolerance of α-GHNFs to organic reagents, we set a series of different volume fractions of the organic reagent. The range of tolerance of the α-GHNFs to organic reagent was 0 to 80%. As the concentration of the organic reagent increased, the enzyme activity decreased (Fig. 7).
 | ||
| Fig. 7 Influence of methanol on the activity of α-GHNFs. | ||
The loading ratio is an important index for the evaluation of immobilized materials.25 Based on the experimental results and analysis, the solid loading ratio of the α-GHNFs was calculated as 19.99%.
The enzyme activity of the α-GHNFs was measured by detecting the concentration of p-nitrophenol produced by the reaction of α-glycosidase with PNPG. In the standard curve plot, the concentration of p-nitrophenol was the abscissa and the absorbance value was the ordinate (Fig. 8). Using a regression equation of absorbency of y = 0.0202x + 0.0285 for p-nitrophenol, the correlation coefficient was estimated to be 0.9967, which indicated good linearity. The concentration of p-nitrophenol could be quantified from 0 to 65 μmol mL−1. The detection method of α-GHNF dynamics was the same as for the free enzyme. The largest enzyme activity of the α-GHNFs is 214.03% over the free enzyme (Table 1).
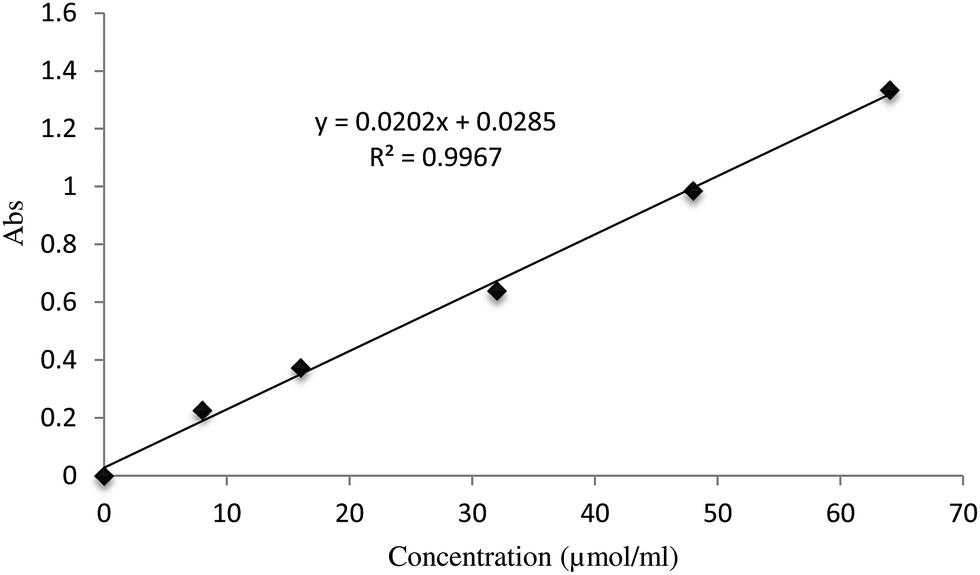 | ||
| Fig. 8 Standard curve of p-nitrophenol. | ||
| Item | α-Glycosidase | α-Glycosidase hybrid nano-flowers |
|---|---|---|
| Abs | 0.309 | 1.226 |
| Enzyme activity/U | 27.698 | 59.282 |
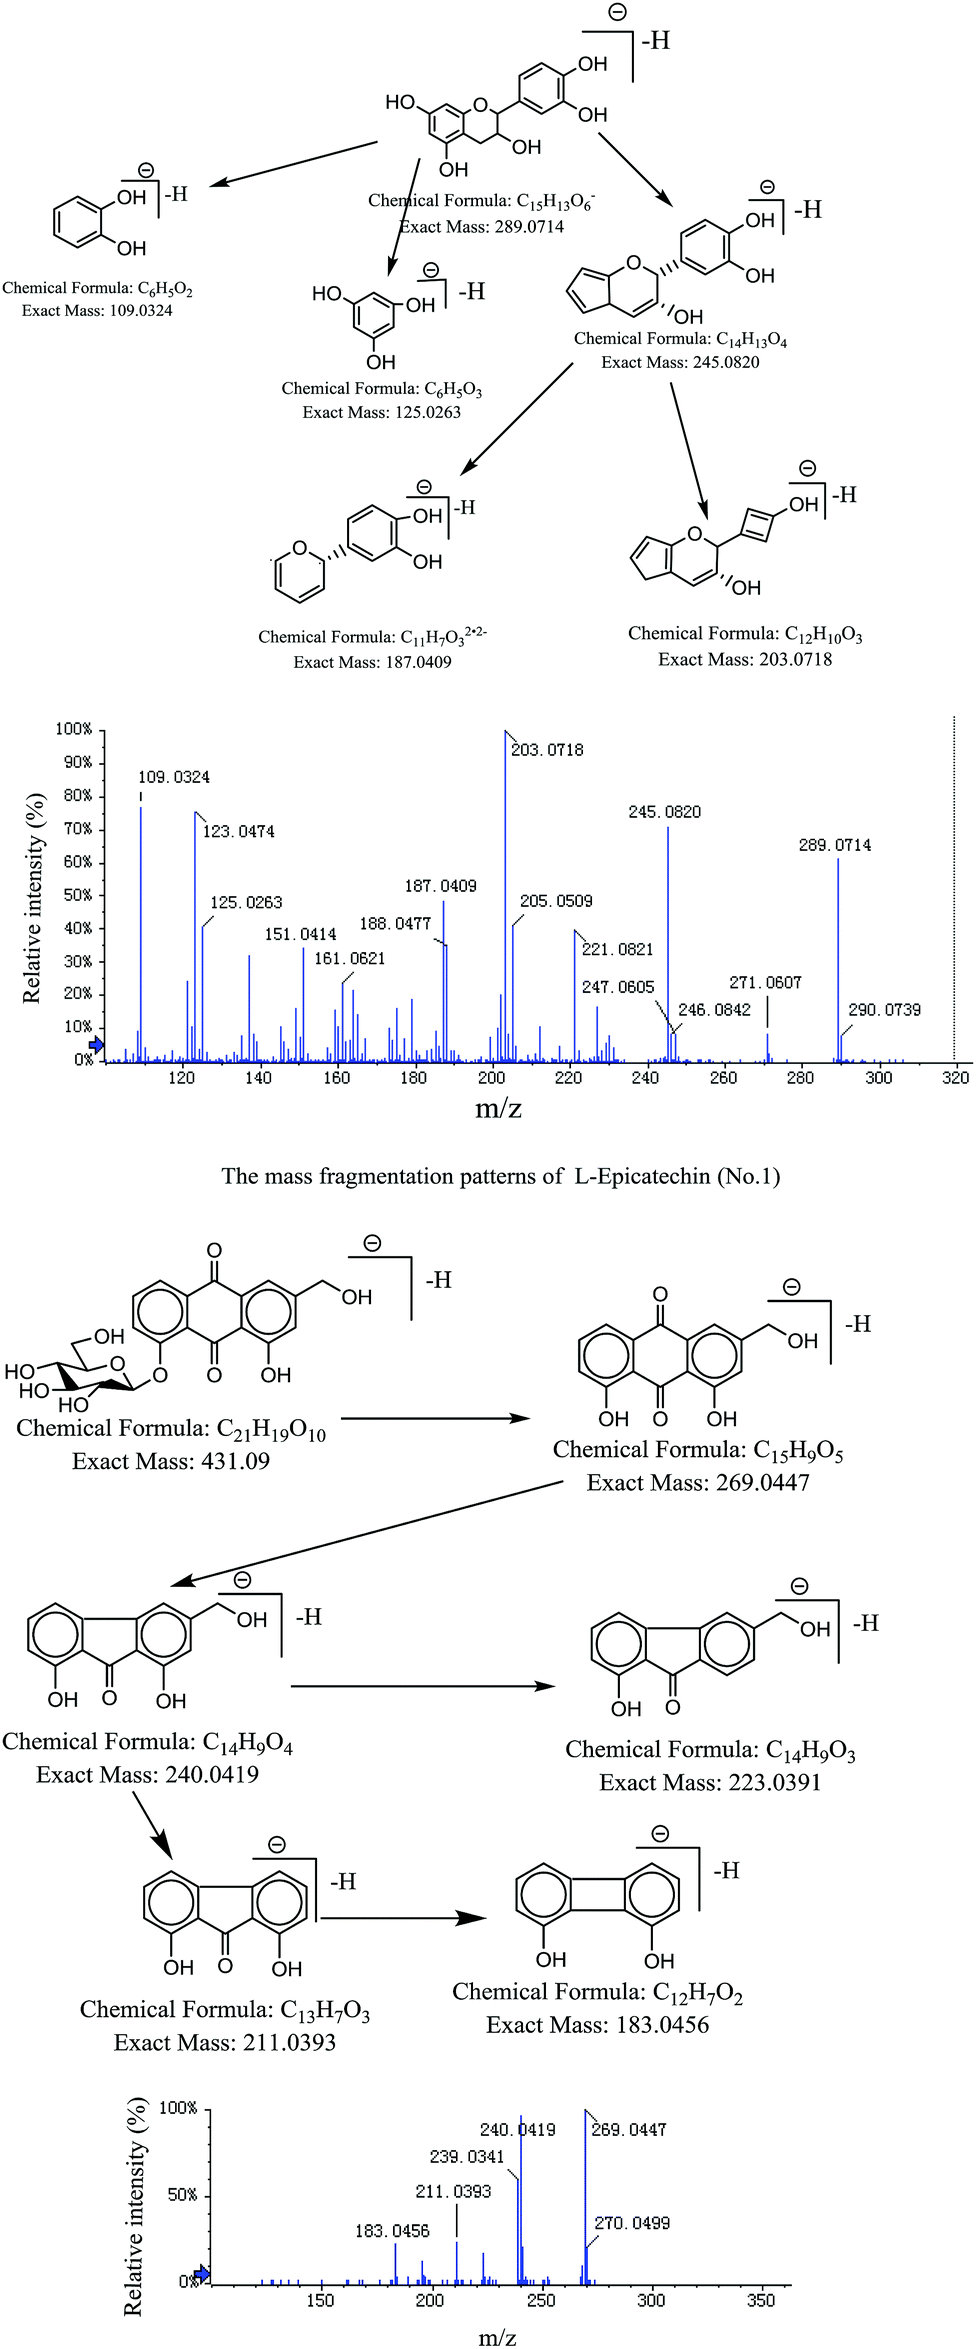
α-GHNFs were incubated with rhubarb extract for 30 min. UPLC-QTOF-MS was done before and after incubation. The total ion chromatograms of the absorbed components in the rhubarb are shown in Fig. 9, where the molecular ion peaks are marked 1 to 11. QTOF-MS data of fragments of the components absorbed are presented in Table 2. L-Epicatechin displayed the greatest adsorption, indicative of strong binding with α-glycosidase. This is consistent with literature descriptions of α-glycosidase inhibition activity of L-epicatechin and anthraquinones have inhibitory effects.
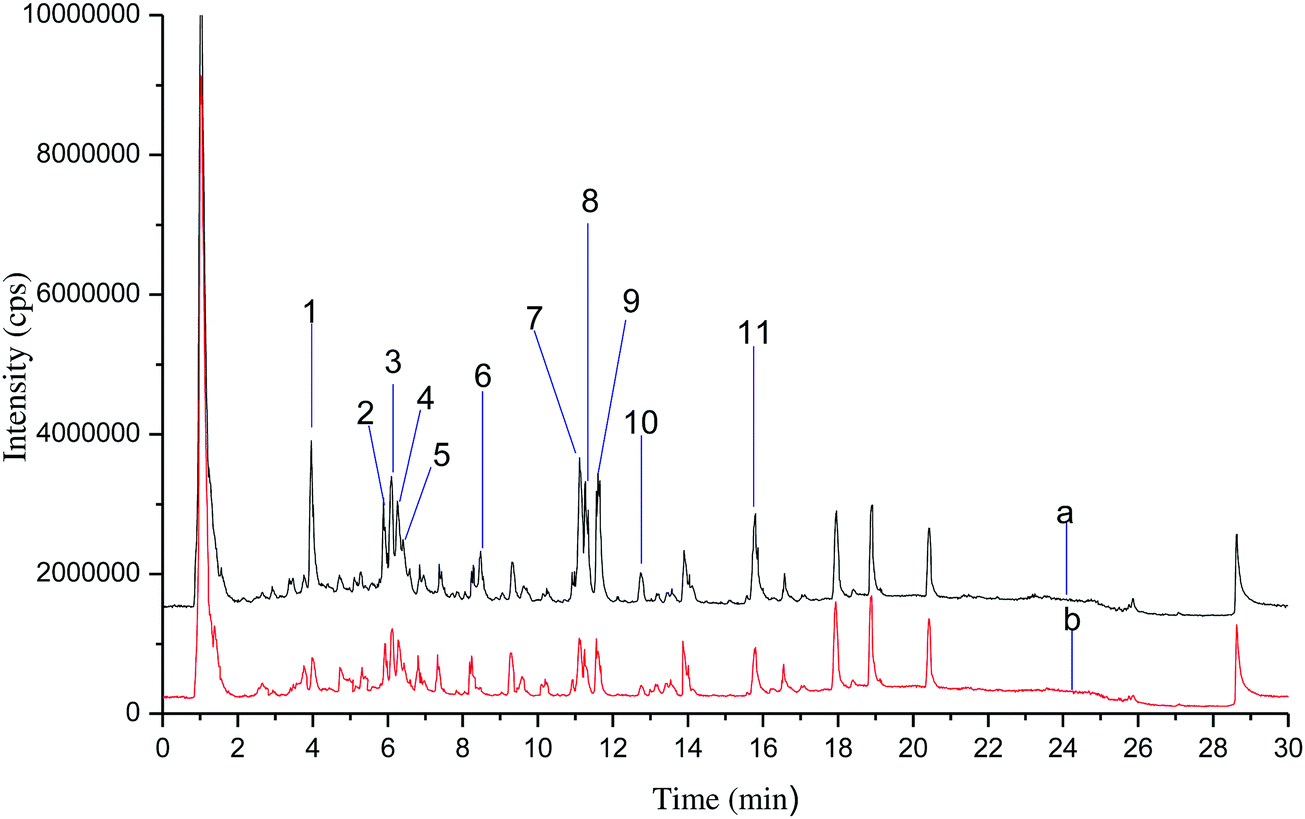 | ||
| Fig. 9 Total ion chromatograms of the absorbed components in rhubarb (curve a is the total ion chromatogram of rhubarb, curve b is the total ion chromatogram of rhubarb absorbed by α-GHNFs, and 1–11 are compounds absorbed by α-GHNFs). | ||
| No. | Name | [M–H]− | Product ion(s) (m/z) | |||
|---|---|---|---|---|---|---|
| Retention time (min) | Extraction mass (Da) | Error (ppm) | Formula | |||
| 1 | L-Epicatechin | 3.962 | 289.0718 | −0.6 | C15H14O6 | 245.0822, 221.0820, 205.0509, 203.0715, 187.0408, 151.0417, 137.0266 |
| 2 | Aloe-emodin-8-O-β-D-glucopyranoside | 5.896 | 432.0984 | −2.9 | C21H20O10 | 269.0446, 268.0385, 240.0423, 241.0472, 183.0456 |
| 3 | Rhein-8-β-D-glucopyranoside | 6.095 | 444.0719 | −2.8 | C21H18O11 | 283.0236, 239.0344, 211.0408, 183.0451 |
| 4–5 | 6-O-Cinnamamoyglucose |
6.271
6.415 |
309.0975 |
−3.0
−4.5 |
C15H18O7 |
189.0405, 147.0467, 161.0455
103.0584, 113.0608 |
| 6 | 2-O-Cinnamoyl-1-O-galloy-β-D-glucose | 8.469 | 461.1085 | −3.5 | C22H22O11 |
313.0564, 271.0461, 211.0252
169.0154 |
| 7 | Emodin-1-O-beta-D-glucopyranoside | 11.120 | 431.0955 | −3.2 | C21H20O10 |
431.0955, 269.0448, 268.0370
253.0493, 239.0352 |
| 8 | Emodin-8-O-beta-D-glucopyranoside | 11.284 | 431.0952 | −3.2 | C21H20O10 | 147.0471, 269.0453, 225.0557 |
| 9 | Frangulin A | 11.610 | 415.1035 | −2.5 | C21H20O9 |
416.1107, 269.0459, 241.0510
225.0566, 182.0399 |
| 10 | Emodin-1-O-(6-carboxyacetyl)-β-D-glupyranoside | 12.762 | 517.0988 | −2.8 | C24H22O13 |
518.1060, 473.1066, 431.0965
269.0450, 225.0562 |
| 11 | Chrysophanic acid | 15.784 | 253.0506 | −0.1 | C15H10O4 |
253.0506, 225.0529, 211.0363
183.0414 |
We identified 10 components. Compound 1 was L-epicatechin. The precursor ion at m/z 289.0718 [M–H]− gave one prominent fragment ion at m/z 245.0822 [M–H–COOH]− and subsequent fragmentation patterns showed ions at m/z 203.0715 and 187.0408, a fragmentation pathway consistent with L-epicatechin. The mass fragmentation behaviors of compounds 2, 3, 7, 8, 9, 10 and 11 were similar. Taking rhein-8-glucoside as an example, the [M–H]− precursor ion at m/z 431.0984, gave one prominent fragment ion at m/z 283.0236 [M–H–glucoside]−. Subsequent fragmentation patterns showed ions at m/z 211.0408 [M–H–glucoside–CO]− and 183.0451 [M–H–glucoside–CO–CO]−. This was the fragmentation behavior of anthraquinone compounds. The mass fragmentation behaviors of compounds 4, 5 and 6 were similar. Compounds 4 and 5 were identified as 6-O-cinnamoyglucose. The precursor ion was at m/z 309.0975 [M–H]−. Subsequent fragmentation patterns showed ions at m/z 147.0467 [M–H–glucoside]−, the [M–H–C8H7O1]− precursor ion at m/z 189.0405, and the [M–H–C5H8O5]− precursor ion at m/z 161.0455. The cracking rules of these compounds are presented in Fig. 10. These compounds are corroborated with the reference substance.
 | ||
| Fig. 10 Cracking rules of the compounds of L-epicatechin and Aloe-eModin-8-O-β-D-glucopyranoside. | ||
L-Epicatechin has an inhibitory effect on α-glycosidase in these compounds,26 but the inhibitory effects of 6-O-cinnamamoyglucose and 2-O-cinnamoyl-1-O-galloy-β-D-glucose are not clear. The remaining seven anthraquinone compounds may have inhibitory effects.27–29
4. Conclusions
A new screening method for compounds having α-glycosidase inhibitory activity has been developed and optimized in this work. The method is based on the specific affinity of α-GHNFs for the inhibitors, which helps to selectively screen them from mixtures. α-GHNFs can effectively increase the enzyme activity. Furthermore, they are stable, simple to prepare, capable of being used repeatedly and easy to use for industrial-scale applications. These desirable features of nano-flowers can significantly improve the efficiency for α-glycosidase inhibitor identification and separation by specific affinity in complex mixtures. This study provides a novel approach for separating and analyzing active components present in traditional Chinese medicines.Conflicts of interest
There are no conflicts to declare.Acknowledgements
This work was supported by the National Natural Science Foundation of China (Grant No. 81660652), the Graduate Innovative Special Foundation of Jiangxi Province (Grant No. YC2016-S357), the Natural Science Foundation of Jiangxi Province (Grant No. 20161BAB205222), and the Modern Technology and Industrial Development Collaborative Innovation Center Foundation of Jiangxi Traditional Medicine (Grant No. JXXT201403019).References
- G. M. Cragg and D. J. Newman, Biochim. Biophys. Acta, Gen. Subj., 2013, 1830, 3670–3695 CrossRef CAS PubMed.
- J. W.-H. Li and J. C. Vederas, Science, 2009, 325, 161–165 CrossRef PubMed.
- L. J. Nisbet and M. Moore, Curr. Opin. Biotechnol., 1997, 8, 708–712 CrossRef CAS PubMed.
- X. Huang, L. Kong, X. Li, X. Chen, M. Guo and H. Zou, J. Chromatogr. B: Anal. Technol. Biomed. Life Sci., 2004, 812, 71–84 CrossRef CAS.
- H. Zhang, C. Hu, C. Liu, H. Li, J. Wang, K. Yuan, J. Tang and G. Xu, J. Pharm. Biomed. Anal., 2007, 43, 151–157 CrossRef CAS PubMed.
- X. Su, L. Kong, X. Lei, L. Hu, M. Ye and H. Zou, Mini-Rev. Med. Chem., 2007, 7, 87–98 CrossRef CAS PubMed.
- H. Wang, H. Zou, J. Ni, L. Kong, S. Gao and B. Guo, J. Chromatogr. A, 2000, 870, 501–510 CrossRef CAS PubMed.
- R. Tian, S. Xu, X. Lei, W. Jin, M. Ye and H. Zou, TrAC, Trends Anal. Chem., 2005, 24, 810–825 CrossRef CAS.
- Q. Zhou, L. Li, J. Xiang, Y. Tang, H. Zhang, S. Yang, Q. Li, Q. Yang and G. Xu, Angew. Chem., Int. Ed., 2008, 47, 5590–5592 CrossRef CAS PubMed.
- Y. Zhang and S.-J. Park, Carbon, 2017, 122, 287–297 CrossRef CAS.
- A. Pattammattel, I. K. Deshapriya, R. Chowdhury and C. V. Kumar, Langmuir, 2013, 29, 2971–2981 CrossRef CAS PubMed.
- Y. Zhang and S.-J. Park, J. Catal., 2017, 355, 1–10 CrossRef CAS.
- K. Besteman, J.-O. Lee, F. G. Wiertz, H. A. Heering and C. Dekker, Nano Lett., 2003, 3, 727–730 CrossRef CAS.
- T. T. T. Le, P. D. Tran, X. T. Pham, D. H. Tong and M. C. Dang, Adv. Nat. Sci.: Nanosci. Nanotechnol., 2010, 1, 035004 CrossRef.
- R. Wang, B. Xia, B.-J. Li, S.-L. Peng, L.-S. Ding and S. Zhang, Int. J. Pharm., 2008, 364, 102–107 CrossRef CAS PubMed.
- B. S. Batule, K. S. Park, M. I. Kim and H. G. Park, Int. J. Nanomed., 2015, 10, 137 Search PubMed.
- S. W. Lee, S. A. Cheon, M. I. Kim and T. J. Park, J. Nanobiotechnol., 2015, 13, 54 CrossRef PubMed.
- R. Hu, X. Zhang, Z. Zhao, G. Zhu, T. Chen, T. Fu and W. Tan, Angew. Chem., 2014, 126, 5931–5936 CrossRef.
- Q. Li, Y. Jiang, R. Han, X. Zhong, S. Liu, Z. Y. Li, Y. Sha and D. Xu, Small, 2013, 9, 927–932 CrossRef CAS PubMed.
- A. Datta and L. Pham, Knowledge, information and economic policymaking in Vietnam, ODI Report (May), 2013 Search PubMed.
- L.-B. Wang, Y.-C. Wang, R. He, A. Zhuang, X. Wang, J. Zeng and J. Hou, J. Am. Chem. Soc., 2013, 135, 1272–1275 CrossRef CAS PubMed.
- Z. Lin, Y. Xiao, Y. Yin, W. Hu, W. Liu and H. Yang, RSC Adv., 2014, 4, 13888–13891 RSC.
- I. Ocsoy, E. Dogru and S. Usta, Enzyme Microb. Technol., 2015, 75, 25–29 CrossRef PubMed.
- M. S. Lee and C. B. Sohn, Biol. Pharm. Bull., 2008, 31, 2154–2157 CAS.
- Z.-G. Wang, L.-S. Wan, Z.-M. Liu, X.-J. Huang and Z.-K. Xu, J. Mol. Catal. B: Enzym., 2009, 56, 189–195 CrossRef CAS.
- H. Fouotsa, A. M. Lannang, C. D. Mbazoa, S. Rasheed, B. P. Marasini, Z. Ali, K. P. Devkota, A. E. Kengfack, F. Shaheen and M. I. Choudhary, Phytochem. Lett., 2012, 5, 236–239 CrossRef CAS.
- F. Van Os, Pharmacology, 1976, 14, 18–29 CrossRef PubMed.
- G. Zengin, M. Locatelli, R. Ceylan and A. Aktumsek, J. Enzyme Inhib. Med. Chem., 2016, 31, 754–759 CrossRef CAS PubMed.
- A. Arvindekar, T. More, P. V. Payghan, K. Laddha, N. Ghoshal and A. Arvindekar, Food Funct., 2015, 6, 2693–2700 CAS.
Footnote |
| † Kang Qian and Han Wang are co-first authors. Institutions of the work are ranked in no particular order. |
| This journal is © The Royal Society of Chemistry and the Centre National de la Recherche Scientifique 2018 |