The excellent dye-photosensitized degradation performance over hierarchical BiOCl nanostructures fabricated via a facile microwave-hydrothermal process
Renyue
Liu
a,
Zhen
Wu
a,
Jian
Tian
a,
Changlin
Yu
 *ab,
Shaoyu
Li
a,
Kai
Yang
ac,
Xingqiang
Liu
d and
Minchao
Liu
*b
aSchool of Metallurgy and Chemical Engineering, Jiangxi University of Science and Technology, Ganzhou 341000, Jiangxi, China. E-mail: yuchanglinjx@163.com
bSchool of Chemistry and Environmental Engineering, Wuyi University, Jiangmen 529020, Guangdong, China. E-mail: wyuchemlmc@126.com
cState Key Laboratory of Photocatalysis on Energy and Environment, Fuzhou University, Fuzhou, 350002, China
dDepartment of Environmental Science and Engineering, Tan Kah Kee College Xiamen University, Zhangzhou, 363105, China
First published on 16th November 2017
Abstract
Via a facile microwave-hydrothermal process, a series of BiOCl crystals with different morphologies was synthesized using hexadecyltrimethylammonium chloride (HTAC) as the chlorine source and structure directing agent by precisely controlling the synthesizing temperatures (100–180 °C). The results show that a high temperature is favorable for the formation of 2D disk-like BiOCl nanosheets and a low temperature benefits the formation of 3D porous flower-ball-like BiOCl aggregations. At the same time, the thickness of the 2D nanosheet building units in 3D hierarchical BiOCl flowers gradually decreased with a decrease of temperature. Compared to disk-like BiOCl, the 3D hierarchical BiOCl structures have distinct advantages, e.g. a large surface area and rich porous structure, which allows their strong adsorption for reaction substrate molecules. Moreover, the photoelectrochemical test results further revealed that 3D hierarchical BiOCl crystals possess much smaller electron transfer impedance and larger photocurrent response values than disk-like BiOCl units due to the continuous and intense electron injection from excited Rhodamine B, which is favorable for the continuous generation of superoxide radicals (˙O2−). Thus, BiOCl with a 3D hierarchical structure exhibited a superior dye-sensitized degradation activity for single Rhodamine B and mixed dyes (Rhodamine B and methyl orange) under visible light illumination. These results are expected to provide new insights for the rapid fabrication of 3D hierarchical BiOX materials without using any organic solvent. Moreover, the mechanism for the effect of the microstructure of BiOCl on the dye-photosensitized reaction process was illuminated.
1. Introduction
The solar-light-driven photocatalytic technique has been deemed to be a promising strategy for environmental remediation and protection, particularly for the deep removal of hazardous organic pollutants from wastewater.1–10 The key to push the photocatalysis to a large-scale application is the design and fabrication of an efficient photocatalyst. Bismuth oxyhalide (BiOX, X = Cl, Br, I) is an important semiconductor with adjustable light absorption. The detailed crystal structure information for BiOCl was firstly and systematically researched by Bannister and Sillén.11 The crystal model of BiOCl is a stacked layered [Cl–Bi–O–Bi–Cl] structure composed of alternately arranged Cl− ions and [Bi2O2]2+ layers. BiOCl powders are commonly used in the cosmetic and coating industries due to its low toxicity and distinct pearlescent luster. Other potential applications in medicine,12 gas sensor,13 photoelectric devices,14 catalysis,15etc., were also reported. More recently, BiOCl has attracted intense attention in the photocatalytic field due to its structural advantage as a photocatalyst in which the electrostatic field is exists in the layered BiOCl crystal. The built-in electric field in the BiOCl crystal can contribute to the efficient separation of photogenerated electrons and holes.For the first time, Zhang et al.16 found that BiOCl showed a higher degradation activity for methyl orange (MO) than P25 under UV light, which led to a broad and systematic study on BiOX (X = Cl, Br, I) with a Sillén layered structure.17 However, the large band gap of the bulk BiOCl semiconductor (∼3.5 eV) largely hinders its full utilization for whole solar light. Then numerous investigations were devoted to modify BiOCl to improve its visible light photocatalytic activity. The main technologies include narrow band-gap semiconductor coupling, noble metal nanoparticle (NP) loading, nonmetal doping, defect introduction, and solid solution engineering.18,19 Most of the above methods are subject to strict requirements for material properties and synthetic conditions. Therefore, developing a simple, low energy consumption and environment-friendly technology to promote the absorption capacity of BiOCl for visible light is highly desirable.
On the other hand, other attention has focused on promoting the visible light activity of photocatalysts via a dye sensitization route. In a dye-sensitized photocatalysis process, the electrons in the excited state dye (dye*) can transfer to the conduction band of the photocatalyst and the transferred electrons can be effectively captured by adsorbed O2, then producing a series of reactive oxygen species (ROSs) (e.g. H2O2, ˙O2−/HOO˙, and, ˙OH), leading to the final removal of the pollutants.20,21 It is noted that the degradation efficiency is closely related to the adsorption capacity of dye by the photocatalyst and the redox potential position of the semiconductor and adsorbed dye*. Chang et al.22 found that BiOCl exhibited the best degradation efficiency for Rhodamine B (RhB) among three dye molecules (MO, methylene blue (MB), and RhB). Their theoretical calculation showed that RhB with the most positive LUMO energy was conducive to the electron transfer from the excited RhB (RhB*) to the conduction band of BiOCl, which favors the photocatalytic reaction process from the view of the reaction thermodynamics. Meanwhile, their experimental results demonstrated that both dissolved and adsorbed O2 were favorable to improve the dye degradation rate. Also, the visible light photocatalytic behavior of BiOCl strongly depended on its microstructure. Zhang et al.23 reported that BiOCl nanosheets with exposed {001} facets possessed a higher direct degradation activity for MO and {010} facets showed a higher indirect degradation activity. The reasons for the variation in photocatalytic activity with different exposed crystal planes were analyzed from the view of molecular oxygen activation. BiOCl with exposed {001} facets possesses some advantages, e.g. high surface energy, high mobility and a special surface atomic structure. Xie et al.24 successfully synthesized atom-size two-dimensional BiOCl nanosheets with almost fully exposed active {001} facets by a hydrothermal method with PVP as the additive. Compared with nanodisks, the ultrathin nanosheets showed a small band gap and unique three vacancy complex defects, thus displaying an excellent adsorption performance and photocatalytic degradation activity under solar light irradiation. Other theoretical studies and experimental results show that the exposed {001} surface of BiOCl nanosheets possesses a high density of oxygen atoms and this unique surface state could favor promoting its adsorption capacity for cationic dyes (such as RhB and MB) and the mobility of carriers, thus effectively improving the visible light degradation activity.25,26 Moreover, the three-dimensional hierarchical structures possess other unique properties, including large surface area, abundant pore structure and a unique optical absorption property, which could increase the surface active sites and improve the mass transfer efficiency of reaction solution. For example, a mesoporous BiOCl photocatalyst assembled by ultrathin nanosheets with exposed {001} crystal facets was obtained via a solvothermal method. This hierarchical BiOCl exhibited a strong adsorption ability for cationic dyes and good reusability, and its visible photosensitized degradation activity toward RhB is 144 times that of P25.27 Another BiOCl microsphere composed of two-dimensional nanosheets with exposed {001} surfaces (thickness of about 20 nm, diameter of 20–600 nm) was synthesized via a solvothermal method by controlling the volume ratio of ethanol and ethylene glycol and these BiOCls showed an excellent photosensitized degradation activity for RhB.28 However, it is still not easy to prepare BiOCl crystals with a hierarchical structure at the large-scale in the absence of organic solvent conditions. In addition, more understanding about the detailed process and reaction mechanism for dye-photosensitization over BiOCl is still needed.29,30
With the aim to explore and develop a simple and rapid, economical and environmentally friendly technology for the controllable synthesis of hierarchical BiOCl, in this work we first report a simple and rapid microwave hydrothermal treatment route without organic solvent for the preparation of BiOCls with adjustable morphologies via the control of reaction temperatures (100 °C < T< 180 °C). It is interesting to find that the overall morphology of BiOCl transforms from a disc stack to a three-dimensional flower ball with a decrease of temperature. The hierarchical BiOCl structures self-assembled by nanosheets with exposed {001} surface possess a large surface area and abundant pore structure. Moreover, the present work also revealed the effect of the microstructure of BiOCl on the dye-photosensitized degradation performance. These as-synthesized hierarchical BiOCl crystals can be effectively photosensitized by RhB and exhibited an excellent visible light photosensitized degradation ability for pure RhB and the mixed dyes of RhB and MO. Meanwhile, the general process and mechanism of the dye-photosensitized degradation reaction over the hierarchical BiOCl are also discussed in detail.
2. Experimental
2.1. Photocatalyst fabrication
All chemicals used in this study were analytical pure without further purification. Typically, both Bi(NO3)3·5H2O (2.426 g) and hexadecyl-trimethylammonium chloride (HTAC, 1.600 g) were added into 30 mL of deionized (DI) water. After magnetic stirring for 20 min, these two solutions were mixed and further magnetically stirred for 1 h. Then, the mixed solution was transferred into a 100 mL Teflon-lined PEEK autoclave and subsequently heated in a microwave heater instrument (Laboratory microwave oven, XH-800G, frequency of 2.45 GHz and a maximum output of 500 W) at different temperatures (100 °C, 120 °C, 140 °C, 160 °C, 180 °C) for 10 min, followed by cooling to room temperature naturally. The resulting white precipitates were separated and successively washed with hot DI water and absolute alcohol until the filtrate was free of foam and then dried in an oven at 100 °C for 12 h. The collected samples were denoted as BiOCl-100, BiOCl-120, BiOCl-140, BiOCl-160 and BiOCl-180, respectively.2.2. Photocatalyst characterization
The X-ray diffraction (XRD) patterns were obtained on a Rigaku Ultima IV X-ray diffractometer using a Cu-Kα X-ray source (λ = 0.15418 nm) at a scan rate of 0.05° s−1. The accelerating voltage and the applied current were 40 kV and 30 mA, respectively. The microstructures of the samples were determined by a Hitachi-S4800 field emission scanning electron microscope (FESEM) at a high voltage of 15 kV. The high-resolution transmission electron microscopy (HRTEM) and high angle annular dark field scanning selected area transmission electron microscopy (HAADF-STEM) were obtained on a JEOL-2100F field emission electron microscope with an accelerating voltage of 200 kV. The N2 adsorption and desorption isotherms were performed at 77 K on an ASAP2020 automatic analyzer (Micromeritics USA). The samples were outgassed for 1 h under vacuum at 90 °C prior to adsorption. The Fourier transformation infrared (FT-IR) spectra were recorded on a Nitolet 5700 in the range 4000–400 cm−1. Optical absorption properties of the samples were analyzed by ultraviolet-visible diffuse reflectance spectroscopy (UV-vis DRS) using a UV-2550 (Shimadzu) UV-vis spectrophotometer and referenced to BaSO4.The photoelectrochemical test was carried out on a CHI 660E electrochemical workstation using a standard three-electrode configuration with a working electrode, a platinum wire counter electrode, and an Ag/AgCl reference electrode. The working electrode was immersed in a 0.1 M Na2SO4 electrolyte solution during the test. The working electrode was prepared as following: all conductive glass (ITO) substrates were ultrasonically cleaned for 5 min in a mixed solution of acetone and ethanol. The sample (20 mg) was ultrasonically dispersed in 200 μL of absolute ethanol for 1 h, and then 100 μL of the as-prepared suspension slurry was coated on the surface of ITO to form a film with an area of 1 cm2. Finally, the exposed part of the ITO was separated by epoxy resin. All the optical electrodes were immobilized by heating at 80 °C for 2 h before the photoelectrochemical test. The test of the transient photocurrent response with time was conducted through an alternated test of opening and closing a light with a bias voltage of 0 V, and a 300 W xenon lamp (Perfect) was used as the light source. Electrochemical impedance spectroscopy (EIS) in AC polarization was performed under the open circuit potential. A sinusoidal AC perturbation of 10 mV was applied to the electrode over the frequency range of 0.01–105 Hz after a quiet of 10 min.
2.3. Photocatalytic activity measurements
Typical rhodamine B (RhB) and methyl orange (MO) dyes were used as the simulated pollutants. The photocatalytic degradation of pollutant in an aqueous solution was conducted in an open quartz tube (inner diameter of 3.3 cm and length of 14.5 cm) under the visible-light irradiation of a 350 W xenon lamp with a 420 nm cut off filter, and the suspension was constantly stirred to ensure an adequate oxygen intake. All the experiments were carried out at room temperature by external recirculating cooling water. The typical experimental steps are as follows: Prior to light irradiation, 0.03 g of photocatalyst were dispersed in 50 mL of aqueous solution of dye (pure RhB: volume of 50 mL and concentration of 0.02 g L−1; mixed dyes of RhB and MO: mixed 25 mL of RhB (0.02 g L−1) and 25 mL of MO (0.02 g L−1); pure MO: volume of 50 mL and concentration of 0.01 g L−1) and then stirred for 40 min in the dark to reach adsorption/desorption equilibrium. At given time intervals, 3 mL of the suspensions was sampled and centrifuged at a rate of 8000 rpm for 5 min. The supernatant was analyzed by a UV-vis spectrophotometer (UV-2550) at 553 nm to monitor the variations of the absorbance for RhB and at 463 nm for MO.3. Results and discussion
3.1. Crystallographic structure
The crystallographic structure and phase purity of the samples were analyzed by XRD. Fig. 1 presents the XRD patterns of as-prepared samples. All the distinct diffraction peaks are indexed to the tetragonal phase of BiOCl (JCPDS No. 06-0249, space group of P4/nmm, lattice constants of a = b = 3.891 Å and c = 7.369 Å). No other diffraction peaks of impurities were detected. Interestingly, the (001), (002) and (003) diffraction peaks of BiOCl become broad and weak with a decrease in temperature, which suggests that the products had a higher exposure percentage of {001} facets at low temperature.31 Moreover, as shown in Table 1, the diffraction intensity ratios of (110)/(001) and (110)/(102) increase with ta decrease of temperature, which implies that the products tend to form thin sheet-like units grow along the {110} facets (perpendicular to the [001] direction).32,33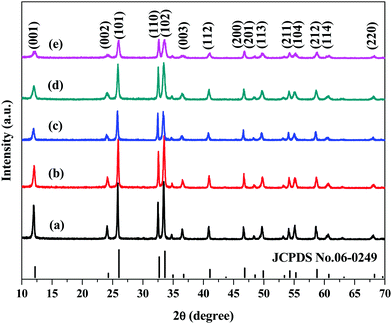 | ||
| Fig. 1 XRD patterns of the samples obtained at different temperatures via a microwave hydrothermal process: (a) BiOCl-180, (b) BiOCl-160, (c) BiOCl-140, (d) BiOCl-120, (e) BiOCl-100. | ||
| Samples | Synthesis temperature/°C | Ratio of (110)/(001) | Ratio of (110)/(102) |
|---|---|---|---|
| BiOCl-180 | 180 | 1.092 | 0.628 |
| BiOCl-160 | 160 | 2.135 | 0.781 |
| BiOCl-140 | 140 | 2.162 | 0.898 |
| BiOCl-120 | 120 | 2.761 | 0.927 |
| BiOCl-100 | 100 | 4.245 | 1.087 |
| JCPDS No. 06-0249 | — | 1.875 | 0.77 |
3.2. Morphology and microstructure
The morphology of typical samples is shown in the SEM images presented in Fig. 2. All of the images show that the samples of BiOCl prepared at different temperatures are composed of disc-like or sheet-like building blocks. Under high temperature conditions (a typical sample is shown in Fig. 2(a)), the sample prepared at 180 °C is composed of closely stacked thick disks, and the inset shows a single disk with a size of about 83 nm. Interestingly, with a decrease of temperature, from the inset presented in Fig. 2(b), we can see that the thickness of the BiOCl disk synthesized at 140 °C decreased to 67 nm. With further reduction of the temperature, as illustrated in Fig. 2(c), the sample prepared at 100 °C emerges as a flower-ball-like structure, and no obvious disk-like particles was found. The inset image shows that the flower-like microspheres were assembled by nanosheets with a thickness of about 50 nm.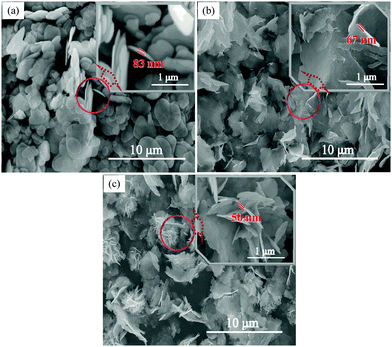 | ||
| Fig. 2 SEM images of typical samples obtained at different temperatures: (a) 180 °C, (b) 140 °C, (c) 100 °C. | ||
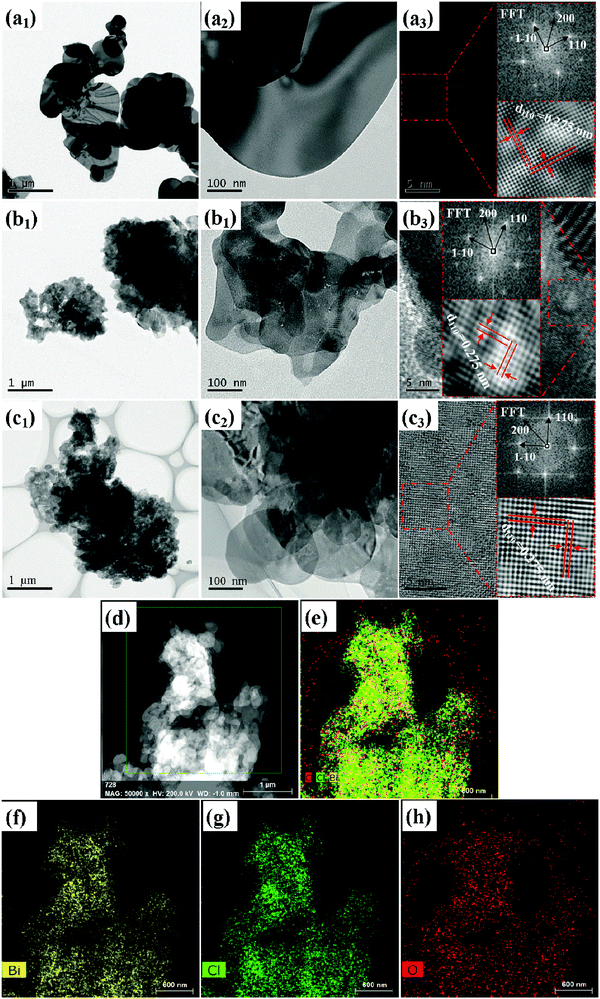
To further reveal the microstructure of the samples, the TEM and HRTEM images of typical samples are shown in Fig. 3. The TEM images of BiOCl-180, BiOCl-140 and BiOCl-100 are presented in Fig. 3(a1, a2), (b1, b2) and (c1, c2), respectively. Fig. 3(a1 and a2) show that the overall morphology of the BiOCl-180 sample is assembled by closely stacked thick disks. Fig. 3(a3) shows the HRTEM lattice images of crystal planes magnified from a corresponding single disk in Fig. 3(a2). The equal horizontal and vertical lattice fringe spacing of 0.275 nm matches well with the {110} plane of tetragonal BiOCl, which indicates that the dominantly exposed planes of BiOCl lamellas are {001} crystal planes.34,35 The FFT result of the inset in the Fig. 3(a3) also confirms the exposure of the {001} plane of BiOCl-180, and the result of a bright periodic diffraction point in the FFT image indicates that the sample exhibited a single crystal structure.23Fig. 3(b1 and b2) show that the overall morphology of the BiOCl-140 sample is formed by cross-linked crimped nanosheets. Fig. 3(b3) shows the HRTEM lattice images of crystal planes magnified from a corresponding single nanosheet in Fig. 3(b2). The equal horizontal and vertical lattice fringes spacing of 0.275 nm and the FFT result confirm the exposure of the {001} plane of BiOCl-140. Fig. 3(c1 and c2) show that the overall stacked sphere morphology of the BiOCl-100 sample is formed by nanosheet-like building block units. Fig. 3(c3) shows the HRTEM lattice images of crystal planes magnified from a corresponding single nanosheet in Fig. 3(c2). Lattice spacing measurement and FFT results confirm the exposure of the {001} plane of BiOCl-100, and the emergence of a single diffraction ring in the FFT image indicated that the sample exhibited a polycrystalline structure but with the {001} plane dominantly exposed. The results of TEM and HRTEM show that the BiOCl thick lamellar monocrystalline structure with the exposed {001} plane tends to be formed under a high temperature, while the BiOCl sphere structure assembled by the nanosheet with an exposed {001} plane tends to be formed under a low temperature.
In addition, the distribution images of the elements in the selected area of the BiOCl-100 sample were obtained by the characterization of STEM and HAADF-STEM. The selected area is shown in Fig. 3(d), and the distribution images of the elements are presented in Fig. 3(e)–(h). Fig. 3(e) shows that all of the elements have a good dispersion in the area. From the single elemental mapping (Fig. 3(f)–(h)), it is found that the elements of Bi and O are distributed sparsely on the surface, and Cl is closely distributed inside. This shows that the distribution densities on the surface of the Bi and O elements are higher than that of Cl, which could be attributed to abundant Bi and O atoms on the exposure of the {001} surface.36
3.3. Texture properties
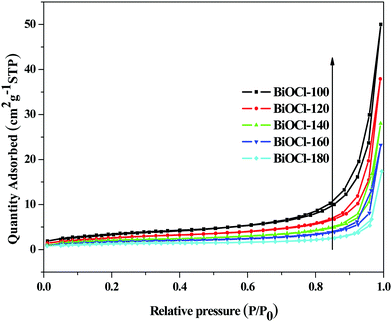
The specific surface area and pore structure of the samples were determined by a N2 adsorption and desorption test. Fig. 4 presents the N2 adsorption–desorption isotherms for the as-obtained samples. According to the classification of Brunauer–Deming–Deming–Teller (BDDT) in IUPAC, the isotherms of all the as-obtained samples except BiOCl-180 (type-II) can be categorized as type-IV. There is no any limiting adsorption at high relative pressures (P/P0), indicating that all the hysteresis loops of the samples belong to H3 or H4 with a characteristic of slit-shaped pores.37 It is known that hysteresis is related to the capillary condensation in mesoporous structures, and the shape of the hysteresis loop varies for different materials. The adsorption process is intimately associated with the solid's morphology, and consequently to the corresponding pore shape.38 In general, the observed hysteresis of H4 is associated with wedge-shape pores caused by stacked discs and the hysteresis of H3 is associated with slit-shaped pores caused by the aggregates of thin slices of particles.39,40 As shown in Fig. 4, the adsorption capacity at high relative pressures (P/P0) of the samples depends on microwave hydrothermal synthesis temperature. The sample prepared at low temperatures showed larger adsorption capacities at high relative pressures, demonstrating the transformation of the hysteresis loops from H4 to H3. These results further confirm that the microstructure transformation from two-dimensional to three-dimensional of the products relies on the synthesis temperature, which is consistent with the results of SEM analysis. As the results in Table 2 show, the specific surface areas are calculated from the linear part of the BET plot (P/P0 = 0.05–0.3). The BiOCl-100 has a maximum specific surface of 12.56 m2 g−1, which is about 4 times that of BiOCl-180. The large specific surface area is attributed to the formation of a three-dimensional porous flower-ball structure. It is well known that a photocatalyst with a large surface area and abundant pore structure is advantageous for improving the adsorption of the reactants and enhancing the capture of light.| Sample | Surface area (m2 g−1) |
|---|---|
| BiOCl-180 | 4.62 |
| BiOCl-160 | 5.95 |
| BiOCl-140 | 7.22 |
| BiOCl-120 | 9.51 |
| BiOCl-100 | 12.56 |
3.4. The possible formation process for the products
As we know, micelles are the self-assembled objects which exist in thermodynamic equilibrium with monomers in the bulk above a critical concentration. Their fundamental properties are directly linked with fundamental thermodynamic parameters e.g. concentration, temperature and pressure. Moreover, temperature has a crucial influence on the micellar structure and it also influences the critical micelle concentration. It is reported that the critical micelle concentration (CMC) of cationic surfactants increases with increasing temperature. At the same time, the micellar structure is strongly related to the concentration of surfactants.41,42 In general, spherical micelles are dominant in a cationic solution.43,44 In this synthesis process, a significant variation in the size and shape of BiOCl nanostructures may be due to the micelle agglomeration behavior depending on the temperature. According to the present experimental results, a possible micelle-dependent-temperature model was proposed to account for the formation process of BiOCl products with different morphologies under different microwave hydrothermal temperatures. As shown in Fig. 5, under microwave irradiation the increase in temperature (to 180 °C) leads to an increase in the solubility of HTAC and hence a decrease in the hydrophobicity of the surfactant molecules. At the same time, the fast Brownian motion of molecules could cause an adverse effect for the micellization, which may decrease the number of monomers in the micelles. A large number of dissolved HTAC molecules act as Cl− sources and react with the surrounding BiO+ ions to form the BiOCl crystal nucleus.42 In the subsequent growth process, the BiOCl crystal nucleus could preferentially grow along the C axis of the dominant direction ([001] direction) into thick plates, and further slightly overlap each other due to the presence of very small amounts of HTAC micelles. With a decrease of temperature (to 140 °C), the orderly molecular thermal motion and the weak molecular activity could promote the formation of more stable HTAC micelles, and the cationic hexadecyltrimethylammonium chloride could steadily attach on the negatively charged {001} surface of the BiOCl crystal by an electrostatic adsorption action, thus effectively restraining the growth of BiOCl building units along the [001] direction, and eventually forming nanopetals with a small thickness; on the other hand, when the temperature reduction is large enough (to 100 °C) to cause the CMC value to drop sharply so that it is significantly lower than the concentration of HTAC in the precursor solution, these excess HTAC molecules could aggregate with each other to form spherical micelles, which could induce the nanopetals with smaller thickness to assemble with each other into the flower-like BiOCl nanostructure through the electrostatic and weak intermolecular interaction between HTAC molecules and the nanopetals.42,45,46 It should be also noticed that our current understanding for the formation of BiOCl flower-like nanostructures is quite limited, since the relationship between micelle behavior and temperature is very complex, and further investigation is in progress. Our results show that low microwave-hydrothermal temperature is conducive for the formation of a flower-ball-like BiOCl hierarchically assembled by lamellar units with the assistance of the HTAC.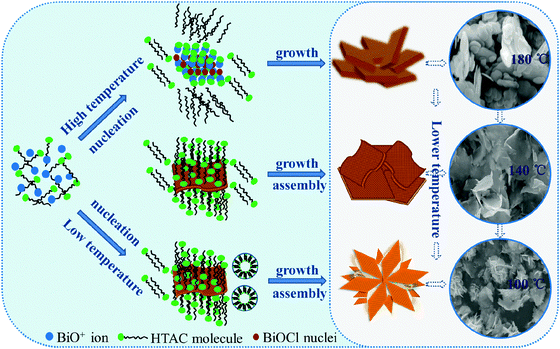 | ||
| Fig. 5 Illustration of the possible formation process of hierarchical BiOCl nanostructures with HTAC assistance under different temperature. | ||
3.5. Surface property
The FT-IR spectra of the as-prepared samples and pure KBr are presented in Fig. 6. There are strong characteristic absorption peaks at 3500, 3142, 1620, 1400 and 528 cm−1 in the BiOCl samples (Fig. 6(a)–(e)). The characteristic absorption peak at 3142 cm−1 and 1400 cm−1 are attributed to pure KBr (Fig. 6(f)). The characteristic absorption peak at 528 cm−1 is assigned to valent symmetrical A2u-type vibrations of the Bi–O bond.47,48 There are no other peaks in the finger-print region, which indicates the samples are pure BiOCl. The absorption bands at 3500 cm−1 and 1620 cm−1 were attributed to the O–H stretching vibration peak and the bending vibration peak of adsorbed water, respectively. Interestingly, the intensity of the absorption peaks at 3500 cm−1 and 1620 cm−1 was enhanced with a decrease of temperature, indicating that BiOCl exhibit more abundant surface hydroxyl and adsorbed water over the samples prepared under a low temperature, and abundant surface hydroxyl could promote the photocatalytic reaction process in the liquid phase.49,50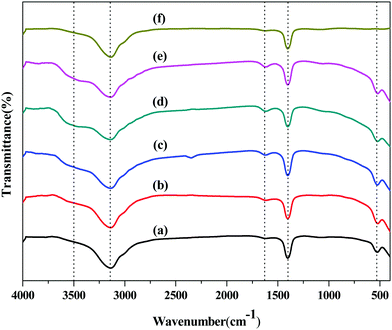 | ||
| Fig. 6 FT-IR spectra of different samples: (a) BiOCl-180, (b) BiOCl-160, (c) BiOCl-140, (d) BiOCl-120, (e) BiOCl-100, (f) Pure KBr. | ||
3.6. Optical absorption
The theoretical simulated energy band structure of BiOCl is shown in Fig. 7(a). The highest valence band and the lowest conduction band of BiOCl crystals are located at different K-point in the Brillouin zone, indicating that BiOCl is an indirect band gap semiconductor. The carriers in indirect semiconductors are not easy to recombine, which favors the separation and utilization of electron–hole pairs. The optical absorption properties of the as-prepared BiOCl samples were obtained by UV-vis DRS (Fig. 7(b)). The optical absorption band edge of a semiconductor solid powder can be obtained from the Kubelka–Munk function of αhv = A(hv − Eg)n/2, where α, v, Eg, and A are the absorption coefficient, light frequency, band gap energy, and a constant, respectively.51 The value of n depends on the characteristics of the semiconductor transition (n = 1, direct transition; n = 4, indirect transition). Herein, taking n = 4, we can see from the illustration that the square root of the absorption coefficient is linear with energy, demonstrating that the as-prepared sample is an indirect band gap semiconductor. According to the transformation function of Kubelka–Munk, the Eg of all samples are determined (in the inset of Fig. 7(b)) from the plot of (F(R)·hv)1/2versus hv. The Eg of the as-prepared samples (3.22–3.27 eV) are slightly lower than that of bulk BiOCl (∼3.5 eV) due to the different size and microstructure.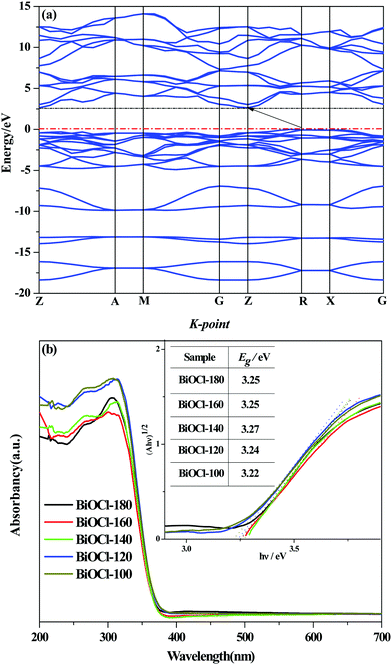 | ||
| Fig. 7 (a) Band structure of BiOCl, (b) UV-vis diffuse reflectance spectra of as-synthesized samples. | ||
3.7. Visible photocatalytic activity and photoelectrochemical analysis
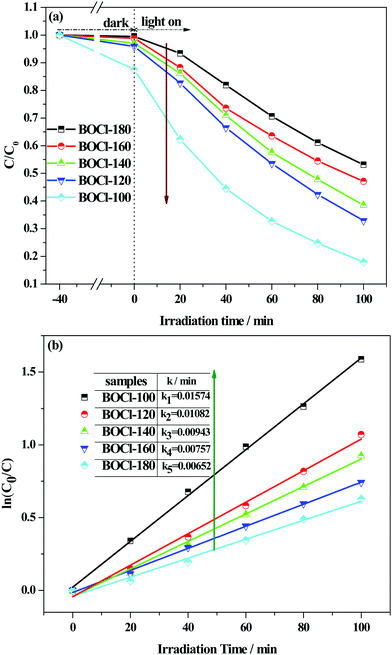
The photocatalytic activity of the samples was first tested by degradation of typical cationic dye (RhB) under visible-light (λ ≥ 420 nm) irradiation. As shown in Fig. 8(a), after adsorption/desorption equilibrium in the dark, all the samples have a certain adsorption capacity, and the adsorption capacity of the flower-ball-like sample prepared at a low temperature is much stronger than that of thick-plate-like samples obtained at a high temperature, which further confirms the advantages of the three-dimensional flower-ball-like BiOCl. Under visible light illumination, the rapid decrease in RhB concentration shows that the as-prepared samples can effectively degrade RhB dye even if BiOCl does not harvest the visible light due to its large band gap. These results demonstrate that the degradation is attributed to a dye-photosensitized degradation process.We know that the strong adsorption ability of photocatalyst for dyes is beneficial for the injection of electrons from the excited dye molecule to a semiconductor. Herein, our results provide a good model to understand the importance of adsorption ability to photosensitized degradation. Fig. 8(a) shows that the degradation rate of RhB by BiOCl-100 reached 84.2% due to its strong adsorption capacity, while only a 46.6% degradation rate of RhB was obtained by BiOCl-180 due to its poor adsorption. The degradation reaction kinetics can be obtained by the following pseudo-first-order reaction model of Langmuir–Hinshelwood: ln(C0/C) = kt, where k is the first-order rate constant. As displayed in Fig. 8(b), the k values of all the samples are simulated to be 0.00652 min−1 (BiOCl-180), 0.00757 min−1 (BiOCl-160), 0.00943 min−1 (BiOCl-140), 0.01082 min−1 (BiOCl-120), and 0.01574 min−1 (BiOCl-100). The results show that the sample obtained at low temperature has a high RhB-photosensitized degradation activity for RhB under visible light illumination. In Table 3, the present dye-photosensitized degradation activity of the hierarchical BiOCl nanostructure under visible light is compared with the reported literature. From the comparison results in the table, both the high exposed {001} surface and large BET specific surface area greatly contribute to enhancing the RhB-photosensitized degradation activity of the BiOCl crystal.
| Microstructures of BiOCl (synthesis method) | S BET/m2 g−1 | Lamp source | Concentration of RhB/ppm | Complete degradation time/min | Ref. |
|---|---|---|---|---|---|
| Nanoplates (hydrolysis) | — | 500 W xenon lamp (λ > 420 nm) | 10 | 60 | 52 |
| Nanosheets with {001} facets-dominated (hydrothermal) | 5.6 | 300 W xenon lamp (λ > 400 nm) | 20 | 180 | 53 |
| Microspheres (hydrothermal) | 15.3 | 300 W xenon lamp (λ > 400 nm) | 10 | 120 | 54 |
| Flower-like balls (solvothermal) | 5.6 | 500 W xenon lamp (λ > 400 nm) | 10 | 200 | 55 |
| Microspheres (solvothermal) | 37.1 | 500 W xenon lamp (λ > 420 nm) | 4.8 | 6 | 56 |
| Flower-like balls with {001} facets-exposed (microwave hydrothermal) | 12.6 | 350 W xenon lamp (λ > 420 nm) | 20 | 110 | This study |
In order to understand the mechanism of electron injection and transfer in the photosensitization process, we investigated the roles of both RhB and illumination by electrochemical impedance spectroscopy (EIS). The Nyquist plots can be interpreted in terms of the equivalent circuit as displayed in the inset of Fig. 9(a). In the equivalent circuit, Rs is the solution resistance, CPE and Rct are the constant phase element for the electrolyte/electrode interface and the charge transfer resistance across the interface of electrode/electrolyte, respectively. Thus, the arcs in the Nyquist plot are related to charge transfer at the interface of the photocatalyst/electrolyte.57,58 As shown in Fig. 9(a), the Nyquist plots of bare BiOCl-100 and BiOCl-100@RhB (BiOCl-100@RhB: BiOCl-100 adsorbed RhB in 20 mg L−1 RhB solution in the dark for 40 min) in the high frequency region do not show a semicircle arc, indicating that the above systems have a large interfacial electron transfer resistance in absence of light illumination. After the introduction of light illumination, obvious semicircle arcs appear in the Nyquist plots of the above systems, which was attributed to the fact that the effective excitation and separation of the carriers resulted in a large decrease in resistance for interfacial electron transfer. Moreover, BiOCl-100@RhB displayed a much smaller radius of the semicircle arc than that of BiOCl-100, which implies that the electron transfer resistance of the BiOCl electrode decreased largely after the adsorption of RhB due to the electron injection effect from the excited dye into the electrode. As shown in Fig. 9(b), all BiOCls@RhB samples exhibited semicircle arc Nyquist plots. We also noted that BiOCl prepared at 100 °C has the smallest radius in the semicircle arc, implying the minimum electron transfer resistance. The analysis results of EIS data illustrated that BiOCls prepared at a low temperature favor the electron transfer from the photo-sensitive RhB. In general, rapid electron transfer facilitates the effective separation of carriers, and further increases the probability of producing the reactive oxygen species, which is beneficial for improvement in the photocatalytic degradation efficiency.
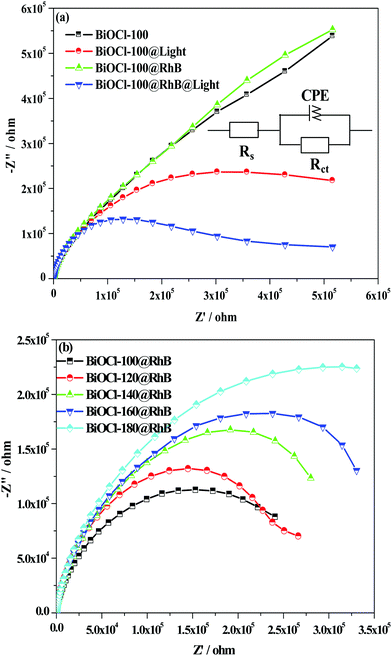 | ||
| Fig. 9 (a) The effect of the adsorption of RhB and visible light irradiation on the Nyquist impedance plots of BiOCl-100; (b) the Nyquist impedance plots of different BiOCl samples with adsorbed RhB. | ||
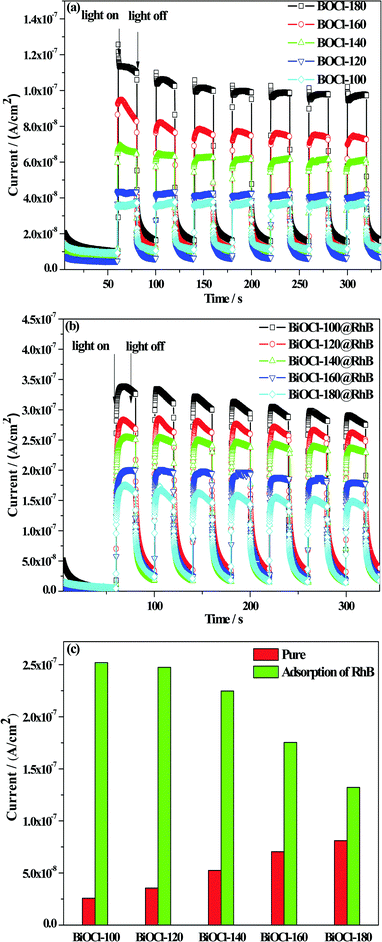
Meanwhile, a further test of the transient photocurrent response time (TPRT) was carried out to quantify the capacity of the as-prepared samples to accept electrons from RhB. The photocurrent densities of pure BiOCl and BiOCl@RhB samples are shown in Fig. 10(a) and (b), respectively. The bar charts of the absolute photocurrent response density of all the samples are presented in Fig. 10(c). These results showed that the photocurrent density values of disc-like BiOCls prepared at a high temperature are higher than that of flower-ball-like BiOCls prepared at a low temperature. The reason could be that the unidirectional built-in electric field in a BiOCl nanosheet crystal is more favorable for the rapid migration of photogenerated electrons compared with the multidirectional built-in electric field in the three-dimensional BiOCl structure. Interestingly, the absolute photocurrent response density values of BiOCl@RhB samples are much higher than that of the corresponding sole BiOCl samples, which suggests that the introduction of RhB can effectively enhance the yield of photo-generated electrons of pure BiOCl samples due to the electron injection effect.
Furthermore, in conditions of equal time adsorption towards RhB, the BiOCl samples obtained at a low temperature show much stronger absolute photocurrent response density values than the samples prepared at a high temperature, which reveals that the former has a stronger ability to accept electron injection than that of the latter. Therefore, the analysis of both EIS and TPRT confirmed that BiOCl samples fabricated at a low temperature have superior photogenerated electron yield and excellent migration efficiency due to their strong adsorption capacity to RhB, thus exhibiting a high degradation efficiency for RhB.
An effective dye-photosensitized catalyst system should not only possess good dye-photosensitivity but also have a strong degradation ability to other pollutants. Herein, BiOCl-100 and BiOCl-180 are used as typical photocatalysts, and methyl orange (MO) is used as a second pollutant, for verifying the degradation ability of the BiOCl@RhB system to MO under visible light illumination.
As shown in Fig. 11(a), the photocatalytic decomposition rate of pure methyl orange over BiOCl-100 can be negligible even under visible light illumination for 5 h, which also can be confirmed by the unchanged color of methyl orange. However, in the mixed RhB (10 mg L−1)/MO (10 mg L−1) system, with an increase of illumination time, the maximum absorption peaks of RhB (553 nm) and MO (463 nm) decrease simultaneously, indicating the simultaneous degradation of the two dyes.59,60 Compared with RhB, the maximum absorption peak of MO undergoes a faster change than that of RhB, suggesting MO could be preferentially degraded over RhB-photosensitized BiOCl-100 in the mixed RhB/MO system. As shown in Fig. 11(b), the photocatalytic decomposition efficiency of pure MO over BiOCl-180 can also be negligible. In the mixed system, we observed that the maximum absorption peak of MO decreases with prolonged illumination time, but the maximum absorption peak of RhB displays only a slight decrease in intensity and no shift in peak position. The color change in the mixed dye solution from orange red to fresh peach also indicated that MO could be preferentially degraded while RhB cannot be effectively degraded. From the above comparative analysis in the double-dye degradation experiments, we can infer that in the BiOCl@RhB system, MO can be further degraded via a visible photosensitized route. Compared with BiOCl-180, BiOCl-100 displays a superior RhB-photosensitized activity for MO degradation, which was induced by the continuous electron injection from excited RhB*.
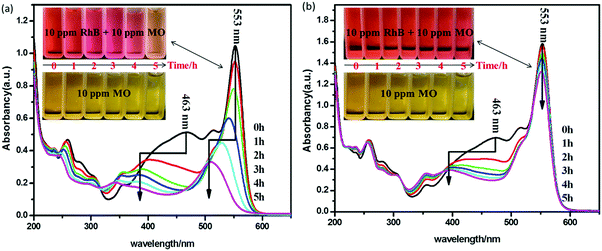 | ||
| Fig. 11 The temporal evolution of the absorption spectra of the RhB/MO mixed solution over (a) BiOCl-100, (b) BiOCl-180. | ||
3.8. Mechanism discussion
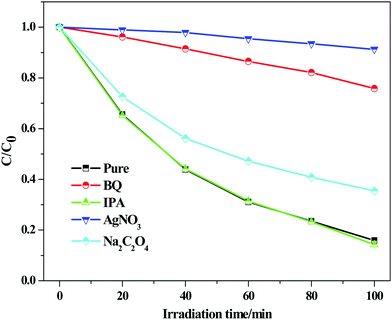
In order to explore the mechanism for RhB degradation over BiOCl under visible light illumination, active species capture experiments were carried out to determine which active species play the main role. BiOCl-100 is selected as a model catalyst and silver nitrate (AgNO3), benzoquinone (BQ), isopropanol (IPA) and sodium oxalate (Na2C2O4) were used as the scavengers of electrons (e−), superoxide radicals (˙O2−), hydroxyl radicals (˙OH) and holes (h+), respectively.61–63 The results are shown in Fig. 12. The degradation activity of BiOCl-100 shows no obvious change after the addition of IPA and Na2C2O4, indicating that ˙OH and h+ are not the main active species in the photocatalytic degradation process. On the other hand, we noted that when silver nitrate and benzoquinone were introduced into the reaction system, especially for the former, a distinct inhibition in the degradation rate was observed, demonstrating the significant roles of e− and ˙O2− for the dye degradation (e− is the initial active species). The result is consistent with our discussion about the photoelectrochemical test, which suggests that the injection and transfer capability of electrons in the BiOCl-RhB system play a crucial role in the photosensitized degradation of RhB (Fig. 13).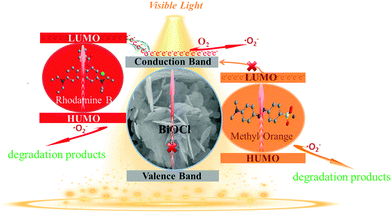 | ||
| Fig. 13 Schematic diagram of the proposed mechanism for the RhB photosensitized degradation of RhB and MO over hierarchical BiOCl nanostructures. | ||
Previous studies show that the electrons from the adsorbed RhB* (photosensitizer) excited by visible light can effectively inject into the conduction band of BiOCl (electron acceptors) and the transferred electrons subsequently can be captured by oxygen adsorbed on the surface of BiOCl to generate oxidation active species (˙O2−) which can effectively destroy the organic pollutants.20,22,64,65 The above process is described as follows:
 | (1) |
| RhB(ads)* + BiOCl → ˙RhB(ads)+ + BiOCl(eCB−) | (2) |
| O2 + BiOCl(eCB−) →˙O2− | (3) |
| ˙O2− + ˙RhB(ads)+ → degraded products | (4) |
Based on the above reaction process, we can know that the more electrons accepted on the BiOCl conduction band, the more conducive it is to enhance the rate of subsequent advanced oxidation degradation. Our experimental results further confirmed that the continuous electron injections are very important for the photosensitized degradation of RhB by BiOCl, and the electronic injection efficiency is closely related with the adsorption ability of BiOCl toward dyes, which is the main cause for the high photocatalytic activity of flower-ball-like BiOCl. On the other hand, two main reasons could account for the poor degradation of MO over pure BiOCl. Firstly, there are negatively charged oxygen atoms over the exposed (001) surface of BiOCl. Thus, there exists an electrostatic repulsion with the anionic MO. Secondly, the energy position of the lowest unoccupied molecular orbital (LUMO) in MO is more positive than the conduction band of BiOCl. Thus, the excited state electrons in MO cannot inject into BiOCl.28,66,67 In the BiOCl-RhB system, cationic RhB can be easily adsorbed by the negatively charged (001) surface of BiOCl. Then, the electrons from the excited RhB* can easily inject into the conduction band of BiOCl and rapidly react with the adsorbed O2 on the surface to generate ˙O2− radicals. ˙O2− radicals can degrade the adsorbed MO and RhB due to their extremely positive oxidation potential. Therefore, the double dyes can be effectively degraded at the same time. Based on the above analysis, a feasible mechanism was proposed (Fig. 12) to illustrate the degradation process of RhB and mixed dyes (RhB/MO) over the RhB-photosensitized BiOCl system.
4. Conclusions
In this microwave hydrothermal synthesis, BiOCl crystals with different morphologies can be achieved by modulating the reaction temperatures (100 to 180 °C). The thick disk-like BiOCl crystal grown towards the [001] direction were obtained under high temperature conditions. At a low temperature (100 °C), the disk-like BiOCl gradually transform into a curved flaky unit structure grown towards the [110] direction, and each building unit tends to assemble into BiOCl flower-ball-like hierarchical structures with a large specific area surface. The hierarchical flower-ball-like BiOCl showed an efficient photosensitized degradation activity towards RhB under visible light irradiation. The highly photosensitized activity was attributed to the fact that the BiOCl exposed {001} surface with abundant oxygen atoms is favorable to the adsorption for cationic RhB. At the same time, the energy level difference between the lowest unoccupied molecular orbital (LUMO) of RhB and the conduction band of BiOCl is thermodynamically favorable for the efficient injection of electrons from RhB to BiOCl. While bare MO cannot be effectively degraded by BiOCl due to the lack of photosensitizing conditions. However, MO can be effectively degraded by photosensitized synergistic effect of BiOCl@RhB. Compared with the thick disk-like BiOCl, BiOCl with a three-dimensional flower-ball-like structure has a strong adsorption for RhB due to its texture advantages (large specific surface area and rich pore structures), which ensures the continuous and efficient electronic injection from excited RhB*. The effective injections of electrons allow the continuous production of ˙O2−, resulting in a high visible-light-photosensitized degradation activity for RhB and mixed dyes (RhB/MO). Here, our work provides a simple and facile synthetic method for other BiOX (X = Br, I) with hierarchical structures. At the same time, our results provide a good idea for deepening the understanding of the dye-photosensitized degradation process of dyes pollutants.Conflicts of interest
There are no conflicts to declare.Acknowledgements
This research was financially supported by the National Natural Science Foundation of China (21567008, 21263005, 21607064, 21707055), Program of Qingjiang Excellent Young Talents, Jiangxi University of Science and Technology, Program of 5511 Talents in Scientific and Technological Innovation of Jiangxi Province (20165BCB18014), Academic and Technical Leaders of the Main Disciplines in Jiangxi Province (20172BCB22018), Jiangxi Province Natural Science Foundation (20161BAB203090), Natural Science Foundation of Fujian Province of China (No. 2015J01062), and the Program for New Century Excellent Talents in Fujian Province University.References
- C. L. Yu, Z. Wu, R. Y. Liu, D. D. Dionysiou, K. Yang, C. Y. Wang and H. Liu, Appl. Catal., B, 2017, 209, 1–11 CrossRef CAS.
- H. P. Jiao, X. Yu, Z. Q. Liu, P. Y. Kuang and Y. M. Zhang, RSC Adv., 2015, 5, 16239–16249 RSC.
- H. B. He, S. S. Xue, Z. Wu, C. L. Yu, K. Yang, G. M. Peng, W. Q. Zhou and D. H. Li, Chin. J. Catal., 2016, 37, 1841–1850 CrossRef CAS.
- X. Li, J. G. Yu and M. Jaroniec, Chem. Soc. Rev., 2016, 45, 2603–2636 RSC.
- S. J. Chang, Q. B. Wang, B. S. Liu, Y. H. Sang and H. Liu, Catal. Sci. Technol., 2017, 7, 524–532 CAS.
- C. L. Yu, W. Q. Zhou, H. Liu, Y. Liu and D. D. Dionysiou, Chem. Eng. J., 2016, 287, 117–129 CrossRef CAS.
- R. Kaur, A. Rana, R. K. Singh, V. A. Chhabra, K. H. Kim and A. Deep, RSC Adv., 2017, 7, 29015–29024 RSC.
- P. P. Zhou, Y. Xie, J. Fang, Y. Ling, C. L. Yu, X. M. Liu, Y. H. Dai, Y. C. Qin and D. Zhou, Chemosphere, 2017, 178, 1–10 CrossRef CAS PubMed.
- X. A. Dong, W. D. Zhang, W. Cui, Y. J. Sun, H. W. Huang, Z. B. Wu and F. Dong, Catal. Sci. Technol., 2017, 7, 1324–1332 CAS.
- S. Kumar, R. Parthasarathy, A. P. Singh, B. Wickman, M. Thirumal and A. K. Ganguli, Catal. Sci. Technol., 2017, 7, 481–495 CAS.
- A. F. Wells, Structural Inorganic Chemistry, Oxford University Press, London, 1975, pp. 407–409 Search PubMed.
- G. G. Briand and N. Burford, Chem. Rev., 1999, 99, 2601–2658 CrossRef CAS PubMed.
- C. R. Michel, N. L. L. Contreras and A. H. M. Preciado, Sens. Actuators, B, 2011, 160, 271–277 CrossRef CAS.
- F. Pu, X. Q. Lu, Y. Xia, W. Huang and Z. L. Li, J. Electrochem. Soc., 2014, 161, H269–H275 CrossRef CAS.
- N. Kijima, K. Matano, M. Saito, T. Oikawa, T. Konishi, H. Yasuda, T. Sato and Y. Yoshimura, Appl. Catal., A, 2001, 206, 237–244 CrossRef CAS.
- K. L. Zhang, C. M. Liu, F. Q. Huang, C. Zheng and W. D. Wang, Appl. Catal., B, 2006, 68, 125–129 CrossRef CAS.
- J. Li, Y. Yu and L. Z. Zhang, Nanoscale, 2014, 6, 8473–8488 RSC.
- C. L. Yu, F. F. Cao, G. Li, R. F. Wei, J. C. Yu, R. C. Jin, Q. Z. Fan and C. Y. Wang, Sep. Purif. Technol., 2013, 120, 110–122 CrossRef CAS.
- H. F. Cheng, B. B. Huang and Y. Dai, Nanoscale, 2014, 6, 2009–2026 RSC.
- T. X. Wu, G. M. Liu and J. C. Zhao, J. Phys. Chem. B, 1998, 102, 5845–5851 CrossRef CAS.
- J. Y. Xiong, G. Cheng, G. F. Li, F. Qin and R. Chen, RSC Adv., 2011, 1, 1542–1553 RSC.
- X. F. Chang, M. A. Gondal, A. A. Al-Saadi, M. A. Ali, H. F. Shen, Q. Zhou, J. Zhang, M. P. Du, Y. S. Liu and G. B. Ji, J. Colloid Interface Sci., 2012, 377, 291–298 CrossRef CAS PubMed.
- J. Jiang, K. Zhao, X. Y. Xiao and L. Z. Zhang, J. Am. Chem. Soc., 2012, 134, 4473–4476 CrossRef CAS PubMed.
- M. L. Guan, C. Xiao, J. Zhang, S. J. Fan, R. An, Q. M. Cheng, J. F. Xie, M. Zhou, B. J. Ye and Y. Xie, J. Am. Chem. Soc., 2013, 135, 10411–10417 CrossRef CAS PubMed.
- H. J. Zhang, L. Liu and Z. Zhou, RSC Adv., 2012, 2, 9224–9229 RSC.
- L. Q. Ye, L. Zan, L. H. Tian, T. Y. Peng and J. J. Zhang, Chem. Commun., 2011, 47, 6951–6953 RSC.
- D. H. Wang, G. Q. Gao, Y. W. Zhang, L. S. Zhou, A. W. Xu and W. Chen, Nanoscale, 2012, 4, 7780–7785 RSC.
- H. B. Chen, X. Yu, Y. Zhu, X. H. Fu and Y. M. Zhang, J. Nanopart. Res., 2016, 18, 225 CrossRef.
- J. L. Hu, W. J. Fan, W. Q. Ye, C. J. Huang and X. Q. Qiu, Appl. Catal., B, 2014, 158, 182–189 CrossRef.
- B. Ohtani, Chem. Lett., 2008, 37, 216–229 CrossRef.
- G. S. Li, B. Jiang, S. N. Xiao, Z. C. Lian, D. Q. Zhang, J. C. Yu and H. X. Li, Environ. Sci.: Processes Impacts, 2014, 16, 1975–1980 CAS.
- Y. J. Li, Q. Wang, B. C. Liu and J. Zhang, Appl. Surf. Sci., 2015, 349, 957–969 CrossRef CAS.
- L. Chen, R. Huang, M. Xiong, Q. Yuan, J. He, J. Jia, M. Y. Yao, S. L. Luo, C. T. Au and S. F. Yin, Inorg. Chem., 2013, 52, 11118–11125 CrossRef CAS PubMed.
- S. X. Weng, Z. B. Fang, Z. F. Wang, Z. Y. Zheng, W. H. Feng and P. Liu, ACS Appl. Mater. Interfaces, 2014, 6, 18423–18428 CAS.
- X. Zhang, X. B. Wang, L. W. Wang, W. K. Wang, L. L. Long, W. W. Li and H. Q. Yu, ACS Appl. Mater. Interfaces, 2014, 6, 7766–7772 CAS.
- X. F. Chang, S. B. Wang, Q. Qi, M. A. Gondal, S. G. Rashid, D. Y. Yang, M. A. Dastageer, K. Shen, Q. Y. Xu and P. Wang, Appl. Catal., B, 2015, 176, 201–211 CrossRef.
- K. S. W. Sing, D. H. Everett, R. A. W. Haul, L. Moscou, R. A. Pierotti, J. Rouquerol and T. Siemieniewska, Pure Appl. Chem., 1985, 57, 603–619 CrossRef CAS.
- M. Sanchez-Cantu, L. M. Perez-Diaz, A. M. Maubert and J. S. Valente, Catal. Today, 2010, 150, 332–339 CrossRef CAS.
- F. Rouquerol, J. Rouquerol, K. S. W. Sing, P. Llewellyn and G. Maurin, Adsorption by Powders and Porous Solids Principles, Methodology and Applications, Academic Press, UK, 2014, pp. 290–292 Search PubMed.
- B. H. Chen, C. Huang, D. G. Huang, C. W. Luo, H. T. Li and Z. S. Chao, Appl. Catal., A, 2014, 470, 239–249 CrossRef CAS.
- D. F. Evans, M. Allen, B. W. Ninham and A. Founda, J. Solution Chem., 1984, 13, 87–101 CrossRef CAS.
- G. F. Li, F. Qin, H. Yang, Z. Lu, H. Z. Sun and R. Chen, Eur. J. Inorg. Chem., 2012, 2508–2513 CrossRef CAS.
- T. Imae, R. Kamiya and S. Ikeda, J. Colloid Interface Sci., 1985, 108, 215–225 CrossRef CAS.
- J. Mata, D. Varade and P. Bahadur, Thermochim. Acta, 2005, 428, 147–155 CrossRef CAS.
- M. M. Rashad and A. E. Shalan, J. Mater. Sci.: Mater. Electron., 2013, 24, 3189–3194 CrossRef CAS.
- M. A. Boles, M. Engel and D. V. Talapin, Chem. Rev., 2016, 116, 11220 CrossRef CAS PubMed.
- J. Xie, Y. L. Cao, D. Z. Jia, H. Y. Qin and Z. T. Liang, Catal. Commun., 2015, 69, 34–38 CrossRef CAS.
- J. E. D. Davies, J. Inorg. Nucl. Chem., 1973, 35, 1531–1534 CrossRef CAS.
- S. V. Awate, R. K. Sahu, M. D. Kadgaonkar, R. Kumar and N. M. Gupta, Catal. Today, 2009, 141, 144–151 CrossRef CAS.
- H. Hussain, G. Tocci, T. Woolcot, X. Torrelles, C. L. Pang, D. S. Humphrey, C. M. Yim, D. C. Grinter, G. Cabailh, O. Bikondoa, R. Lindsay, J. Zegenhagen, A. Michaelides and G. Thornton, Nat. Mater., 2017, 16, 461–466 CrossRef CAS PubMed.
- M. A. Butler, J. Appl. Phys., 1977, 48, 1914–1920 CrossRef CAS.
- Q. Z. Wang, J. Hui, Y. J. Huang, Y. M. Ding, Y. X. Cai, S. Q. Yin, Z. M. Li and B. T. Su, Mater. Sci. Semicond. Process., 2014, 17, 87–93 CrossRef CAS.
- Z. Haider, J. Y. Zheng and Y. S. Kang, Phys. Chem. Chem. Phys., 2016, 18, 19595–19604 RSC.
- C. Hao, Y. M. Xu, M. J. Bao, X. H. Wang, H. L. Zhang and T. H. Li, J. Mater. Sci.: Mater. Electron., 2017, 28, 3119–3127 CrossRef CAS.
- S. Zhao, Y. W. Zhang, Y. M. Zhou, C. Zhang, X. L. Sheng, J. S. Fang and M. Y. Zhang, ACS Sustainable Chem. Eng., 2017, 5, 1416–1424 CrossRef CAS.
- H. P. Zhao, Y. F. Zhang, G. F. Li, F. Tian, H. Tang and R. Chen, RSC Adv., 2016, 6, 7772–7779 RSC.
- S. J. Hong, S. Lee, J. S. Jang and J. S. Lee, Energy Environ. Sci., 2011, 4, 1781–1787 CAS.
- W. Yu, X. J. Liu, L. K. Pan, J. L. Li, J. Y. Liu, J. Zhang, P. Li, C. Chen and Z. Sun, Appl. Surf. Sci., 2014, 319, 107–112 CrossRef CAS.
- K. Yu, S. G. Yang, H. He, C. Sun, C. G. Gu and Y. M. Ju, J. Phys. Chem. A, 2009, 113, 10024–10032 CrossRef CAS PubMed.
- K. Dai, H. Chen, T. Y. Peng, D. N. Ke and H. B. Yi, Chemosphere, 2007, 69, 1361–1367 CrossRef CAS PubMed.
- C. L. Yu, L. F. Wei, W. Q. Zhou, D. D. Dionysiou, L. H. Zhu, Q. Shu and H. Liu, Chemosphere, 2016, 157, 250–261 CrossRef CAS PubMed.
- Y. X. Guo, H. W. Huang, Y. He, N. Tian, T. R. Zhang, P. K. Chu, Q. An and Y. H. Zhang, Nanoscale, 2015, 7, 11702–11711 RSC.
- G. S. Li, B. Jiang, X. Li, Z. C. Lian, S. N. Xiao, J. Zhu, D. Q. Zhang and H. X. Li, ACS Appl. Mater. Interfaces, 2013, 5, 7190–7197 CAS.
- X. M. Mao, C. M. Fan, Y. W. Wang, Y. F. Wang and X. C. Zhang, Appl. Surf. Sci., 2014, 317, 517–525 CrossRef CAS.
- L. Q. Ye, Y. R. Su, X. L. Jin, H. Q. Xie and C. Zhang, Environ. Sci.: Nano, 2014, 1, 90–112 RSC.
- H. Lachheb, E. Puzenat, A. Houas, M. Ksibi, E. Elaloui, C. Guillard and J. M. Herrmann, Appl. Catal., B, 2002, 39, 75–90 CrossRef CAS.
- Y. C. Hsiao, T. F. Wu, Y. S. Wang, C. C. Hu and C. P. Huang, Appl. Catal., B, 2014, 148, 250–257 CrossRef.
| This journal is © The Royal Society of Chemistry and the Centre National de la Recherche Scientifique 2018 |

