
Immunomodulating protein aggregates in soy and whey hydrolysates and their resistance to digestion in an in vitro infant gastrointestinal model: new insights in the mechanism of immunomodulatory hydrolysates
Mensiena B. G.
Kiewiet
 *a,
Renske
Dekkers
b,
Laurien H.
Ulfman
b,
Andre
Groeneveld
b,
Paul
de Vos
a and
Marijke M.
Faas
ac
*a,
Renske
Dekkers
b,
Laurien H.
Ulfman
b,
Andre
Groeneveld
b,
Paul
de Vos
a and
Marijke M.
Faas
ac
aImmunoendocrinology, Division of Medical Biology, Department of Pathology and Medical Biology, University of Groningen, University Medical Center Groningen, Hanzeplein 1, 9700 RB Groningen, The Netherlands. E-mail: m.b.g.kiewiet@umcg.nl
bFrieslandCampina, Stationsplein 4, 3818 LE Amersfoort, The Netherlands
cDepartment of Obstetrics and Gynecology, University of Groningen, University Medical Center Groningen, 9713 GZ Groningen, The Netherlands
First published on 12th December 2017
Abstract
Hydrolysates, which are used in hypoallergenic infant formulas, have been found to possess immune modulating effects. For an optimal utilization of hydrolysates, the working mechanisms and responsible proteins underlying the effects should be elucidated. In this study, the immunomodulating activity of whey and soy hydrolysates was studied by quantifying TLR activation and assessing cytokine production in hydrolysate stimulated dendritic cells. The responsible protein fraction was identified and characterized by gel electrophoresis. The immune effects under gastrointestinal conditions were studied by digesting the hydrolysates in an in vitro infant digestion model, after which the digests were analyzed. In both soy and whey hydrolysates, TLR activation and cytokine production in dendritic cells were induced by a fraction containing protein aggregates larger than 1000 kDa, which were formed by electrostatic interactions and disulfide bonds. Only soy aggregates remained intact during duodenal digestion, and maintained the TLR activating capacity. Soy and whey protein aggregates larger than 1000 kDa possess immunomodulatory properties, but only soy aggregates remain under intestinal digestion conditions. This knowledge is important for a better understanding of the effects of hydrolysates.
Introduction
Cow's milk allergy is the most common food allergy in newborns, with a prevalence of 2–3%,1 but allergies against alternative proteins such as soy can also occur.2 Hydrolyzation of cow's milk and soy proteins is used to prevent the onset of allergic symptoms.3 The hypoallergenic properties of hydrolyzed proteins are caused by the destruction of allergenic epitopes during the hydrolysis process,4 and also by the creation of novel proteins and peptides with immune regulating properties.5–7 How these proteins and peptides modulate the immune system and whether these properties are maintained during digestion in the infant gastrointestinal track is still largely unknown.Our group and others recently showed using in vitro model systems that hydrolysates induce immunomodulatory effects via Toll-like receptors (TLRs).8,9 TLRs are a family of pathogen recognition receptors which are expressed in many cell types, including dendritic cells, lymphocytes and epithelial cells.10–12 TLRs sample the lumen of the intestine, which was found to be important in mucosal immune regulation.13,14 Due to the complex protein composition of hydrolysates, it remains to be identified which proteins and/or peptides are sampled by TLRs. This identification of the responsible proteins or peptides could contribute to a better understanding of the working mechanisms of hydrolysates and are instrumental in the design of hydrolysates with predictable and reproducible health effects.15
Most studies addressing the interactions of food components with intestinal immune cells apply ingredients without pre-exposure to the hazardous stomach conditions.16,17 It is therefore unknown whether bioactive foods such as hydrolysates maintain their immunomodulatory properties after digestion in the stomach. In order to be able to interact with immune cells, for example, with small-intestine located TLR expressing dendritic cells,18 the proteins and peptides in the hydrolysates should be able to resist the low pH and digestive enzymes in the stomach and the beginning of the small intestine. It is recognized that digestion in the infant's stomach is suboptimal because of the lower enzymatic activity and higher gastric pH in infants compared to adults.19,20 Therefore, digestion models mimicking these specific conditions should be used when studying infant digestion.
In the present study, the immunomodulating effects of whey and soy hydrolysates were investigated by quantifying TLR activation. The fraction responsible for the TLR activation was identified by size based fractionation of the hydrolysates. This fraction was further characterized using native and SDS-PAGE. To study whether the protein fraction remained bioactive during digestion, hydrolysates were digested using an in vitro infant digestion assay mimicking the infant stomach and duodenum, after which the protein content and TLR activating capacity of the digests were analyzed.
Materials and methods
Tested materials
Soy and whey protein hydrolysates and their source materials (soy isolate and whey protein concentrate) were provided by FrieslandCampina (Amersfoort, the Netherlands). The hydrolysates were produced by a two-step digestion of the source materials. The peptide composition of the hydrolysates was characterized with Reverse Phase–Ultra High Performance Liquid Chromatography (RP-UHPLC).21 Separations were performed on a Hypersil GOLD C18 analytical column. Elution was performed at a flow rate of 0.8 mL min−1. The gradient elution was carried out with a mixture of 0.1% trifluoroacetic acid (TFA) and 1% acetonitrile (ACN) in H2O and 0.1% TFA and 90% ACN in H2O. All the samples were tested for endotoxins by using the Limulus amebocyte lysate (LAL) assay according to the manufacturer's instructions (Thermo Fisher Scientific, Waltham, USA). Endotoxin concentrations in all the samples had no significant activating effects on the applied cells.Fractioning of hydrolysates
The hydrolysates were size based fractionated using 2 mL Amicon centrifugal filters with molecular weight cut-offs (MWCOs) of 10 kDa, 100 kDa, and 1000 kDa (Merck, NJ, USA). Hydrolysates were dissolved in 5 mL sterile PBS (20 mg mL−1) by stirring the solution for 15 min at room temperature (RT). Before filtration, the samples were centrifuged at 2000g for 10 min in order to remove undissolved particles that could block the centrifugal filters. A sample of 1 mL of the supernatant was stored (and used in the cell assay as total hydrolysate); the remaining supernatant was used for filtering. Filtration was performed following the manufacturer's instructions. Briefly, hydrolysates were added to the filter tubes, and centrifuged at 4000g for 10 min at RT. Then, the retentate was mixed by pipetting up and down to prevent blocking of the filter, and the tubes were again centrifuged at 4000g for 5 min at RT. This last step was repeated. The permeate was collected and 2 mL of PBS was added to the remaining retentate. The retentate was washed by two repetitions of centrifugation of 5 min at 4000g. Then, the retentate was collected by inverting the centrifugal filter tubes, followed by a short centrifugation.Protein concentrations of the hydrolysate fractions obtained were determined using the Pierce BCA protein assay, following the manufacturer's instructions (Thermo Scientific, Waltham, USA). When the fractions were tested in THP-1 reporter cells, the protein concentrations for complete samples and fractions were equalized.
THP-1 reporter cell assay
To test the TLR activating capacity, THP-1-XBlue™-MD2-CD14 (Invivogen, Toulouse, France) reporter cell assays were used. These cells endogenously express TLRs. To quantify TLR activation, the cell line contains a construct for secreted embryonic alkaline phosphatase (SEAP), which was coupled to the nuclear factor kB/activating protein-1 (NF-κB/AP-1) promoter. NF-κB/AP-1 is a known downstream target of TLR receptors.22,23Cells were cultured as described before.22 The cells were seeded in a flat-bottom 96-well plate at a concentration of 100![[thin space (1/6-em)]](https://www.rsc.org/images/entities/char_2009.gif) 000 cells per well (100 μL per well), and stimulated with total hydrolysates or fractions for 24 hours (37 °C, 95% oxygen, 5% CO2) or with 10 ng mL−1 LPS as a positive control. Hydrolysates alone were tested at a concentration of 2 mg mL−1. The medium was used as a negative control. After incubation, Quanti-Blue detection medium was used to analyze the cell supernatant as described before.22 The absorbance (650 nm) was measured using a VersaMax microplate reader (Molecular Devices GmbH, Biberach an der Riss, Germany) and SoftMax Pro Data Acquisition & Analysis Software to determine SEAP activity, which represents the activation of NF-κB/AP-1.
000 cells per well (100 μL per well), and stimulated with total hydrolysates or fractions for 24 hours (37 °C, 95% oxygen, 5% CO2) or with 10 ng mL−1 LPS as a positive control. Hydrolysates alone were tested at a concentration of 2 mg mL−1. The medium was used as a negative control. After incubation, Quanti-Blue detection medium was used to analyze the cell supernatant as described before.22 The absorbance (650 nm) was measured using a VersaMax microplate reader (Molecular Devices GmbH, Biberach an der Riss, Germany) and SoftMax Pro Data Acquisition & Analysis Software to determine SEAP activity, which represents the activation of NF-κB/AP-1.
Stimulation of dendritic cells (DCs)
DCs were purchased from MatTek Corporation (Ashland, MA, USA). The DCs were generated from umbilical cord blood CD34+ progenitor cells (hematopoietic stem cells). The DCs were thawed and cultured according to the manufacturer's instructions.Stimulations were performed by seeding 6 × 10⁴ cells per well freshly thawed DCs in a 96-well plate (in 200 μL). The cells were precultured for 24 hours before starting the experiment as described in the manufacturer's instructions. Then, the cells were exposed to hydrolysates or their fractions for 24 hours and the supernatant was collected and stored at −80 °C for cytokine measurements.
In order to confirm NF-κB dependency, which is a known downstream target of TLR receptors, the experiment was repeated in the presence and absence of 10 μM of the NF-κB inhibitor celastrol (Invivogen, Toulouse, France). Cells were preincubated with celastrol for 30 min before the samples were added.
Assessment of cytokine expression
The quantity of IL-1β, IL-1RA, IL-10, IL-12, IL-6, IL-8, MCP-1, MIP-1α, RANTES, TNFα, and TSLP in the DC supernatant was measured using a custom-made ProcartaPlex® multiplex immunoassay (Affymetrix, CA, USA). The immunoassay was performed according to the manufacturer's protocol. Briefly, cytokine standards were resuspended, and serial dilutions were prepared. The antibody magnetic bead mix was added to the plate. After washing, standards and samples were added (50 μL per well), the plate was sealed, and incubated while shaking (30 min at RT, overnight at 4 °C, and again 30 min at RT). After washing the plate twice, the detection antibodies were added (25 μL per well) and the plate was incubated for 30 min at RT on a plate shaker. After incubation, the plate was washed twice and 50 μL per well streptavidin–phycoerythrin was added. Again, the plate was incubated at RT for 30 min while shaking. To prepare the plate for analysis, the plate was washed, and 120 μL per well of the reading buffer was added. After shaking the plate for 5 min at RT, the fluorescence was measured using a Luminex 100 system. The data obtained were analyzed using the StarStation software.Polyacrylamide gel electrophoresis (PAGE)
The involvement of charge interactions in the buildup of the proteins was studied by comparing the native PAGE result with a sodium dodecyl sulfate (SDS)-PAGE gel in which a uniform charge density was established with SDS. In the other experiment, an SDS-PAGE was performed in the presence of DTT, which is known to break sulfide bonds.Under all conditions, gel electrophoresis was performed using precast 4–20% criterion TGX stain-free gels (Biorad, CA, USA). All the samples were loaded at a concentration of 1 mg mL−1, after being heated for 3 min at 95 °C. After centrifugation, 10 μL of each sample was loaded on the gel. First, a voltage of 100 V was applied for 10 min. Then, the voltage was increased to 150 V which was applied for 50 min. The proteins in the gel were visualized by exposing the gel to UV light and pictures were taken using a Chemidoc MP Imaging system (Biorad, CA, USA).
For the native PAGE, samples were mixed with 50 μL native sample buffer 2× (Biorad, CA, USA) and the volume made up to 100 μL with PBS. Tris/glycine buffer (Biorad, CA, USA) was used as the running buffer. SDS-PAGE was performed for the hydrolysates and protein sources, both in the absence and presence of DTT. For the SDS-PAGE without DTT, the samples were mixed with 25 μL Laemmli sample buffer 4× (Biorad, CA, USA), and the volume made up to 100 μL with PBS. Tris/glycine/SDS buffer was used as a running buffer. In the SDS-PAGE containing DTT, the hydrolysates were mixed with 25 μL Laemmli sample buffer 4× and 5 μL 1 M dithiothreitol (DTT), and the volume was made up to 100 μL with PBS. The running buffer was also Tris/glycine/SDS buffer. In the SDS-PAGE, unstained protein standard (Biorad, CA, USA) was included. A 5 μL protein standard sample was loaded on the gel.
In vitro infant digestion
The digestibility of the hydrolysates was tested using an in vitro infant digestion model similar to that of Nguyen et al.24 Stomach digestion was performed for 40 min, since this was found to be representative for the gastric half-emptying time after human milk and infant formula consumption.19 This model consisted of a compartment mimicking the enzyme activities in the stomach and a compartment mimicking the enzyme activities in the duodenum. The stomach juice consisted of sterile H2O containing 175 mg L−1 NaCl, 1100 mg L−1 KCl, 110 mg L−1 CaCl2, 62 U mg−1 protein pepsin, 15 U mg−1 protein lipase and 18 mM HCl. The pepsin and lipase concentrations were based on the literature describing the gastric pepsin and lipase amounts in humans.25–27 Since the amount of gastric pepsin in infants is 10–20% of the amount in adults,28 we decreased the amounts accordingly. Duodenal juice contained 1250 mg L−1 NaCl, 150 mg L−1 KCl, 55 mg L−1 CaCl2, and 80 mg g−1 protein pancreatin in sterile H2O supplemented with bile salts. The bile salt concentration in the gut of infants is usually 1–2 mM.29 Therefore, 1 mM sodium taurocholate and 1 mM sodium glycodeoxycholate were added to the duodenal juice. The amount of pancreatin used in the duodenal juice was based on a previous digestion model.30 Before use, the pH of the intestinal juice was set at 6.8 using 0.1 M NaHCO3.At the start of the experiment, the hydrolysates were dissolved in 70 mL sterile H2O at a concentration of 1.2% protein by stirring at RT for 15 min. Then, 15 min before the start of the digestion, the hydrolysates were preheated in a 37 °C water bath. At the start of the digestion, 50 mL of the preheated hydrolysate was transferred to a Scott bottle in a 37 °C water bath, while the rest of the sample was stored for further analysis (see below) (sample 0). Then, 25 mL preheated stomach juice was added to the Scott bottle. This led to stomach conditions with an average starting pH of 4.39 ± 0.3, representing the pH in the stomach of infants.24 The whole digestion was performed in a 37 °C water bath under continuous stirring. Samples were taken at the start of the stomach digestion (sample 1), after 20 min (sample 2) and after 40 min (sample 3) and stored for further analysis (see below). After 40 min of incubation, the pH of the stomach juice was adjusted to 6.7 with 1 M NaHCO3, after which 47 mL preheated intestinal juice was added. Again, the samples were taken at the start of the intestinal digestion (sample 4), after 60 min (sample 5) and after 120 min (sample 6). As a negative control, the digestion was performed with PBS instead of the protein sample. The digestion was performed twice.
Storage of digestion samples
Three different samples were taken for further analysis at the 7 mentioned time points. A sample of 400 μL of the digestion products was snapfrozen and stored at −20 °C for testing the TLR activating properties in THP-1 reporter cells as described above. The digestion products were tested undiluted. The response was corrected for the effects of the stomach and intestinal juice by also testing the digestion products of the control, PBS digestion. Another 400 μL of the digestion products was snapfrozen for the purpose of running a native PAGE, which was performed as described above. Lastly, 400 μL of the digestion samples was added to 400 μL 0.46 M TCA and stored at −20 °C for o-phthaldialdehyde (OPA) analysis (see below).Analysis of digestion using the OPA method
To assess the level of digestion of the hydrolysates, OPA analysis was performed to identify the amount of amino groups present in the digestion samples collected at different time points during digestion. After thawing, the samples were first centrifuged at 14000g for 10 min. L-Leucine was used as a standard, and a stock of 10 mM L-leucine was used to prepare a serial dilution in H2O (0, 1, 2, 3, 4, and 5 mmol mL−1). A sample of 400 μL 0.46 M TCA was added to 400 μL of the standards, which were then incubated at 37 °C for 30 min.
To start the reaction, 200 μL of the standard or sample (samples were 10× diluted in borate buffer) was added to a 15 mL tube, together with 2.5 mL 0.15 M borate buffer (pH 9.5), 50 μL 50 mM N-acetyl cysteine solution and 50 μL 50 mM OPA. The reaction mix was incubated for 15 min at RT, after which the absorbance was measured at 340 nm using an Epoch 2 spectrophotometer (BioTek Instruments, Winooski, USA). The standard curve results were used to create a linear standard curve, which was used to calculate the amount of amino groups in the digested hydrolysates. The results were expressed as μmol per g protein. The results were corrected using the control, PBS digestion values.
Statistical analysis
Statistical analysis was performed using Graphpad Prism 6. The normal distribution of the data was tested using the Kolmogorov–Smirnov test. When the data were normally distributed, the values were expressed as mean ± SD. ANOVA followed by a Tukey's multiple comparison test was used to identify individual differences. To test for the significant effects of celastrol on DC cytokine production, paired t-tests were done. For the data which were not normally distributed, median ± range was shown. The Kruskal–Wallis test followed by a Dunn's test was used to show individual differences. A p-value of <0.05 was considered to indicate a significant difference.Results
Characteristics of soy and whey hydrolysates
The soy and whey protein hydrolysates were obtained by a two-step hydrolysis of soy isolate and whey protein concentrate, respectively. The peptide patterns determined by reversed phase chromatography and molecular weight distributions are shown in Fig. 1. Both hydrolysates are mainly composed of peptides, but also contain a fraction of larger (>10 kDa), possibly intact, proteins. The soy hydrolysate tested was hydrolyzed more extensively compared to the whey hydrolysate, and therefore contains a larger fraction of small peptides (<500 Da). | ||
| Fig. 1 Characterization of soy and whey hydrolysates. Peptide and amino acid patterns were obtained by RP-UHPLC (A), and the molecular weight distribution was calculated (B). | ||
Both soy and whey hydrolysates induce TLR activation
TLR activation has been recognized as a mechanism for cell stimulation by hydrolysates.8 In order to test whether the soy and whey hydrolysates were also able to induce TLR activation, the samples were tested on a THP-1 reporter cell line.Both the soy and whey hydrolysates showed a significant activating effect on TLRs in the THP-1 cell line compared to unstimulated cells (both p < 0.05) (Fig. 2).
 | ||
| Fig. 2 NF-κB/AP-1 activation in a THP-1-MD2-CD14 reporter cell line after stimulation with soy and whey hydrolysates. Both the soy and whey hydrolysates (2 mg mL−1) induced TLR signaling after stimulating THP-1 cells for 24 hours. Statistically significant differences compared to the negative control were determined by using the Kruskal–Wallis test followed by Dunn's test and indicated by *. | ||
A fraction of proteins larger than 1000 kDa is responsible for the observed TLR activation induced by soy and whey hydrolysates
In order to identify the protein fractions which are responsible for the observed TLR activation induced by soy and whey hydrolysates, the hydrolysates were fractionated based on size using filters with MWCOs of 10 kDa, 100 kDa and 1000 kDa. Each fraction was subsequently tested for TLR activating capacities in the THP-1 reporter cell line.For both the soy and whey hydrolysates, the total hydrolysate sample significantly increased TLR activation compared to the negative control (Fig. 3). Furthermore, when the hydrolysates were fractionated using a 10 kDa filter, the retentate of both hydrolysates significantly enhanced the TLR activating capacity, suggesting that the proteins larger than 10 kDa (p < 0.05) are responsible for this effect. By using a 100 kDa and a 1000 kDa filter, it was subsequently demonstrated that TLR activation was only detected in the fractions containing proteins larger than 100 kDa and 1000 kDa, respectively (Fig. 3).
 | ||
| Fig. 3 NF-κB/AP-1 activation in a THP-1-MD2-CD14 reporter cell line after stimulation with soy and whey hydrolysate fractions. The fractions containing proteins larger than 1000 kDa were found to be responsible for the TLR activating effects of the hydrolysates. Statistically significant differences compared to the negative control were determined by using the Kruskal–Wallis test followed by Dunn's test and indicated by *. | ||
The >1000 kDa fractions induced cytokine production in dendritic cells similar to the complete soy and whey hydrolysates
The activation of TLRs is known to induce cell activation and cytokine production in dendritic cells in the intestine.13 Therefore, next, it was tested whether the hydrolysates induced cytokine production in DCs. Since the >1000 kDa fraction of both hydrolysates also induced TLR activation, these fractions were also tested.After stimulation with 2 mg mL−1 soy hydrolysate, the cytokines IL-1β, IL-12, IL-8, TNFα, IL-10, IL-1RA, IL-6, MCP-1, MIP-1α, RANTES and TSLP were significantly increased compared to unstimulated cells (Fig. 4). When DCs were stimulated with the >1000 kDa fraction of the soy hydrolysate, the production of the same cytokines was significantly increased (all p < 0.05), except for IL-1RA. After 24 hours of stimulation with the whey hydrolysate, the cytokines IL-12, IL-8, IL-10, MCP-1, MIP-1α, and RANTES were significantly increased compared to the production of cytokines by unstimulated cells (all p < 0.05). The >1000 kDa fraction of the whey hydrolysate was responsible for the enhanced cytokine production of IL-12, IL-8, IL-1RA, and MCP-1 (all p < 0.05).
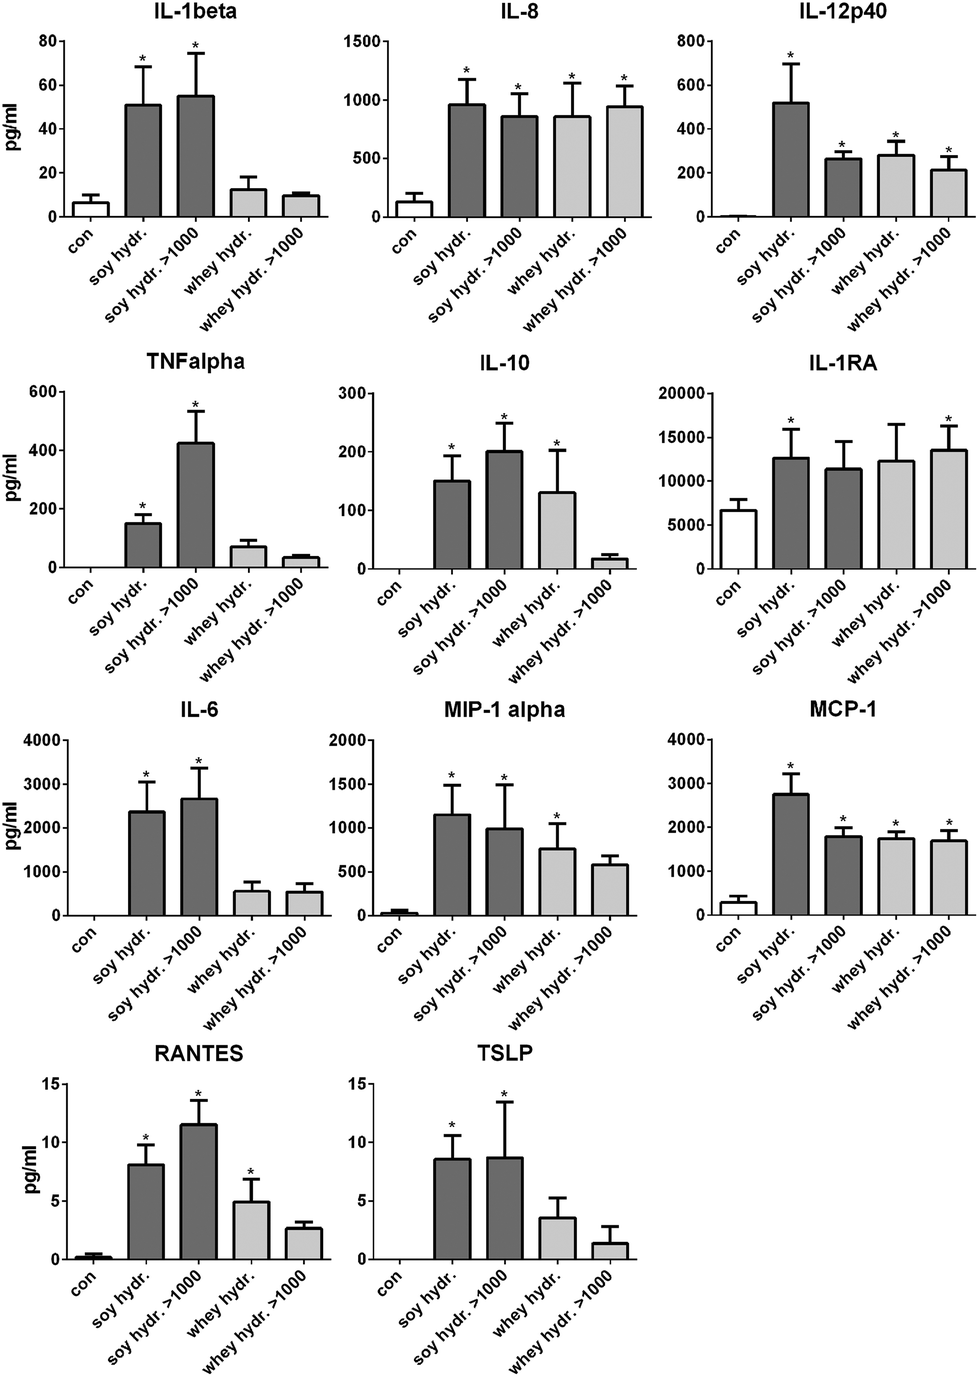 | ||
| Fig. 4 Cytokine production by DCs after stimulation with soy and whey hydrolysates or their >1000 kDa protein fraction. After stimulation with 2 mg mL−1 soy or whey hydrolysate, most cytokines were statistically significantly increased. After stimulation with the >1000 kDa fraction of these hydrolysates, a similar cytokine production pattern was observed. Statistically significant differences compared to the negative control were determined by using ANOVA followed by Tukey's post-test and indicated by *. | ||
The effects of soy and whey hydrolysates and their large protein fractions were found to be NF-κB dependent, since the NF-κB inhibitor celastrol significantly reduced the cytokine production induced by the hydrolysates and/or their fractions (Fig. 5).
 | ||
| Fig. 5 The NF-κB inhibitor celastrol was used to test the NF-κB dependency of the observed effects of hydrolysates (fractions) in dendritic cells. Celastrol inhibited the hydrolysate (fraction) induced cytokine production of all cytokines measured. Three representative graphs are shown (IL-6, TNFα and MIP-1α). Statistically significant differences between cells treated and not treated with celastrol were determined by using paired t-tests and indicated by *. | ||
Both SDS and DTT lead to the breakdown of the large protein fraction in the soy and whey hydrolysates
The involvement of charge interactions in the buildup of the large protein fraction in the hydrolysates was studied in intact soy isolate, intact whey protein and their hydrolysates by comparing the native PAGE result with an SDS-PAGE gel in which a uniform charge density was established. To study the presence of disulfide bonds, SDS-PAGE was also performed in the presence of DTT, which is known to break disulfide bonds.First, a native PAGE was performed with intact soy isolate, intact whey protein and their hydrolysates (left gel in Fig. 6). As shown in Fig. 6, it was found that more of the large protein fraction (arrow on the left side of the gel) was present in the whey hydrolysate compared to the soy hydrolysate. Also, this large protein band of the whey hydrolysate is thicker compared to the band of the intact whey, while the large protein band of the soy hydrolysate is smaller compared to the band of its source material.
 | ||
| Fig. 6 Gels of native PAGE, SDS-PAGE, and SDS-PAGE with DTT to assess the role of electrostatic forces and disulfide bridges in the protein make-up. Native gel (left), SDS-PAGE (middle), and SDS-PAGE with DTT (right) were loaded from left to right with soy hydrolysate (soy hydr.), soy isolate (soy prot.), whey hydrolysate (whey hydr.) and whey protein concentrate (whey prot.). The treatment of the hydrolysates and source materials with SDS and DTT reduced the size of the bands representing the large protein fraction (left arrows). The bands representing the intact whey proteins appeared when the large protein fraction of whey hydrolysates disappeared (right arrows). | ||
Electrostatic interactions were involved in the large protein fraction (Fig. 6, middle gel) as the treatment of the hydrolysates and source materials with SDS reduced the thickness of the bands representing this large protein fraction. Also, disulfide bridges were involved since the specific bands containing the large protein fraction almost completely disappeared in the presence of both SDS and DTT (right gel).
Finally, while the protein band containing the large protein fraction disappeared after the SDS and DTT treatment of the whey hydrolysate, two specific bands of 18 kDa and 14 kDa, corresponding to the two main whey proteins β-lactoglobulin and α-lactalbumin,32,33 appeared in the gel.
The large protein fraction in the soy hydrolysates resisted digestion, while the large protein fraction of the whey hydrolysate is digested in the intestine
Next, it was investigated whether the large protein fractions remained intact during digestion.Fig. 7A shows the native gels for the digestion products of PBS (negative control), soy hydrolysate and whey hydrolysate at different time points. The bands present in the gel showing the PBS controls (see the arrows on the left) are the bands of the enzymes applied or their breakdown products (left, Fig. 7A). For the soy hydrolysate, the protein bands representing the large proteins in the hydrolysate (see the arrow on the right) do not change significantly under the stomach or duodenum digestive conditions (middle, Fig. 7A). The whey protein fraction resisted the stomach digestive conditions but readily disappeared from the digest simulating the duodenum (right, Fig. 7A).
 | ||
| Fig. 7 Native PAGE gel and OPA analysis of the digestion products at different time points during simulated infant stomach and duodenal digestion. Figure A shows a native PAGE of the digestion products. PBS control indicates bands representing the digestive enzymes (left arrows). Large proteins in the soy hydrolysate remained intact in the stomach and duodenal digestion phase (left arrow). Large proteins in the whey hydrolysates started to degrade in the duodenal phase (4,5). OPA analysis confirmed these observations (B). The numbers in the graphs correspond to sample numbers in the gel. | ||
OPA analysis was applied as well to study the level of digestion of the hydrolysates under stomach or duodenum conditions. This OPA analysis showed no digestion in the stomach phase but an immediate and extensive digestion of the whey hydrolysate when added to the duodenal conditions (Fig. 7B). The digestion of soy also started under duodenum conditions, but to a much lesser extent compared to the whey hydrolysate.
Digested soy hydrolysates activated TLRs, while digested whey hydrolysates did not
Finally, it was tested whether the digested soy and whey hydrolysates maintained their TLR activating capacity after digestion by testing the digested samples with appropriate controls on THP-1 reporter cells.TLR activation was significantly increased in THP-1 reporter cell lines stimulated with the undigested soy hydrolysate (sample 0), and the digested soy hydrolysates (samples 1, 3, and 4) (Fig. 8). TLR activation was also increased by soy hydrolysate sample 6, although not significantly. Furthermore, the undigested whey hydrolysate (sample 0) and whey hydrolysate samples 1 and 3 significantly increased TLR activation, while whey hydrolysate sample 4 and 6 had no effect.
 | ||
| Fig. 8 NF-κB/AP-1 activation in a THP-1-MD2-CD14 reporter cell line after stimulation with soy and whey hydrolysate digestion products. The digestion products of the stomach digestion of both the soy and whey hydrolysates induced TLR signaling in THP-1 cells. Digestion samples 1, 3, 4, and 6 of the soy hydrolysate still showed TLR activation (although not significant for sample 6). Statistically significant differences compared to the negative control were determined by using the Kruskal–Wallis test followed by Dunn's test and indicated by *. | ||
Discussion
Hydrolysates have been found to possess immune modulating effects such as a contribution to the generation of Treg and Breg cells.34 For an optimal utilization of these beneficial effects in, for example, hypoallergenic infant formulas, the working mechanisms and responsible proteins or peptides underlying the observed effects should be elucidated. Therefore, in this study, the immunomodulatory effects of a whey and soy hydrolysate were tested, after which the bioactive fraction was identified and further characterized. Lastly, the fate of this fraction in an in vitro infant digestion model was assessed, in order to determine whether the bioactivity is maintained during the passage through the stomach and duodenum. For both soy and whey hydrolysates, TLR activation and cytokine production in DCs was found to be induced by the complete hydrolysate as well as by the fraction of proteins larger than 1000 kDa. These fractions were formed by both electrostatic interactions and disulfide bonds. Furthermore, proteins larger than 1000 kDa of both soy and whey proteins resisted stomach digestion, while whey proteins, but not soy proteins, were readily digested in the duodenum, resulting in the loss of the TLR activating capacity.A bioactive protein fraction in soy and whey hydrolysates containing proteins with a size larger than 1000 kDa (Fig. 3) was identified. Since intact whey and soy proteins are smaller than 1000 kDa,33,35 it was concluded that hydrolysates must contain protein aggregates. Heating of whey and soy proteins is known to induce aggregate formation.36,37 This is probably the step responsible for the generation of the immune modulating fraction in whey. Heating is already applied in the production of the source material (in which an aggregate fraction was detected as well) and again used in the preparation of the whey hydrolysate, where the amount of the aggregate was even higher than in the source material. In the intact soy protein source material, aggregates were observed as well, but surprisingly the amount was lower in the soy hydrolysate despite the application of heating. One explanation for this could be the pertinent structural differences between soy and whey proteins36,38 that make that soy proteins form less aggregates than whey during a second heating step. Another reason could be the higher degree of hydrolysis of the soy hydrolysate compared to the whey hydrolysate, since this means that the soy hydrolysate contains less large, intact proteins which probably form the aggregates.
When studying the characteristics of the aggregates in more detail, it was found that both electrostatic forces and disulfide bonds were involved in the aggregate formation in both soy and whey hydrolysates, which corroborates the findings of Havea et al.39,40 Heat induced protein denaturation is the first step towards protein aggregation.41 During the heat denaturation of the proteins, hydrophobic regions and thiol groups, which are normally enclosed in the folded protein, are exposed.42,43 This leads to both non-covalent bonds and stronger covalent disulfide bonds between denatured proteins, resulting in polydisperse aggregate formation.44,45 These aggregates were predominantly formed from intact whey proteins, since bands corresponding to β-lactoglobulin and α-lactalbumin appeared in the gel when aggregates were treated with SDS and DTT (right arrows, Fig. 6).
When digesting the bioactive aggregate containing hydrolysates in an infant in vitro infant digestion model, both soy and whey aggregates were found to resist the stomach conditions (Fig. 7A), as was observed before.24,46 Soy aggregates also resisted the duodenal digestion, but whey aggregates disappeared quickly in the duodenal phase. This corresponded to a fast increase in whey hydrolysate digestion in the beginning of the duodenal digestion as confirmed by OPA analysis (Fig. 7B). This was not observed for the soy hydrolysate, which already had a high OPA value in line with the more hydrolyzed nature of the material. These results suggest that soy and whey aggregates differ, and therefore suggest that digestibility and bioavailability should be assessed for each hydrolysate individually.
TLR activating capacities were preserved for up to 2 hours of duodenal soy hydrolysate digestion, suggesting that immune effects can be induced by soy aggregates in the subsequent part of the small intestine. Since it was shown in vitro that cytokine production in DCs (including IL-6, IL-12, IL-10 and chemokines IL-8, MIP-1α and MCP-1) was induced by the hydrolysate fraction with proteins bigger than 1000 kDa (i.e. the fraction containing the aggregates (Fig. 4)), one could hypothesize that DCs in the jejunum and ileum can be stimulated by aggregates in a similar way. If aggregates increase the levels of the mentioned cytokines and chemokines in these intestinal DCs,47,48 subsequently, T cell responses might also be triggered.49,50 However, the verification of the immune effects of these specific hydrolysates in vivo is needed.
Both whey and soy hydrolysates are used in infant formulas. Recent research has demonstrated that hydrolysates are able to actively modulate the immune response.51 This opens up new venues to use infant formulas for managing immunity. However, before this can be done, more insight is required in the mechanisms and compositions of hydrolysates. Studies addressing the effects of hydrolysates mainly focus on the peptides present in the hydrolysates.15,31,52 Here, we show for the first time that large protein aggregates in the hydrolysates are also involved in the immune effect of hydrolysates from different protein sources. This means that the amount and composition of the aggregates in the hydrolysates should be taken into account, both during research efforts and during the production processes of hydrolysates. Since we observed the TLR activating properties of protein aggregates, which could lead to DC maturation53 and subsequent T cell differentiation,49,50 we believe that some aggregates could, for example, contribute to immune maturation or the decrease of allergic reactions. However, more in vivo research is needed to be able to reproducibly have efficacy and desired tailored effects of aggregates.
In summary, this study shows that both soy and whey hydrolysates contain immunomodulating aggregates 1000 kDa or larger, which have TLR activating properties. However, only the aggregates in the soy hydrolysate were found to resist stomach and duodenal digestion. Soy aggregates might therefore stimulate DC cytokine production via TLR signaling in the small intestine in vivo, and in this way, contribute to the additional beneficial effects of hydrolysates. However, more in vivo research is needed to confirm this. This study shows for the first time that protein aggregates contribute to the immunomodulatory effects of hydrolysates, and is therefore an important step for a better understanding of the immune effects of hydrolysates.
Conflicts of interest
MBGK, MMF and PDV declared no conflict of interest. The project was funded both by FrieslandCampina and the University Medical Center Groningen. RD, LHU and AG are employed by FrieslandCampina, but had no role in study design, data collection and analysis.References
- C. Sackesen, A. Assa'ad, C. Baena-Cagnani, M. Ebisawa, A. Fiocchi, R. G. Heine, A. Von Berg and O. Kalayci, Cow's milk allergy as a global challenge, Curr. Opin. Allergy Clin. Immunol., 2011, 11, 243–248 CrossRef CAS PubMed.
- B. I. Nwaru, L. Hickstein, S. S. Panesar, G. Roberts, A. Muraro and A. Sheikh, EAACI Food Allergy Anaphylaxis, Prevalence of common food allergies in Europe: a systematic review and meta-analysis, Allergy, 2014, 69, 992–1007 CrossRef CAS PubMed.
- S. Salvatore and Y. Vandenplas, Hydrolyzed Proteins in Allergy, Nestle Nutr. Inst. Workshop Ser., 2016, 86, 11–27, DOI:10.1159/000442699 . Epub 2016 Jun 23.
- G. Bu, Y. Luo, F. Chen, K. Liu and T. Zhu, Milk processing as a tool to reduce cow's milk allergenicity: a mini-review, Dairy Sci. Technol., 2013, 93, 211–223 CrossRef CAS PubMed.
- N. Lahart, Y. O'Callaghan, S. A. Aherne, D. O'Sullivan, R. J. FitzGerald and N. M. O'Brien, Extent of hydrolysis effects on casein hydrolysate bioactivity: Evaluation using the human Jurkat T cell line, Int. Dairy J., 2011, 21, 777–782 CrossRef CAS.
- X. Mao, J. Ni, Q. Nan and Y. Li, Immunomodulating effects of casein hydrolysates on murine peritoneal macrophages, Milchwissenschaft-Milk Science International, 2005, 60, 119–121 CAS.
- Y. Sutas, E. Soppi, H. Korhonen, E. Syvaoja, M. Saxelin, T. Rokka and E. Isolauri, Suppression of lymphocyte proliferation in vitro by bovine caseins hydrolyzed with Lactobacillus casei GG-derived enzymes, J. Allergy Clin. Immunol., 1996, 98, 216–224 CrossRef CAS PubMed.
- M. B. G. Kiewiet, R. Dekkers, M. Gros, R. J. J. van Neerven, A. Groeneveld, P. de Vos and M. M. Faas, Toll-like receptor mediated activation is possibly involved in immunoregulating properties of cow's milk hydrolysates, PLoS One, 2017, 12(6), e0178191, DOI:10.1371/journal.pone.0178191 . eCollection 2017.
- M. M. Iskandar, N. Dauletbaev, S. Kubow, N. Mawji and L. C. Lands, Whey protein hydrolysates decrease IL-8 secretion in lipopolysaccharide (LPS)-stimulated respiratory epithelial cells by affecting LPS binding to Toll-like receptor 4, Br. J. Nutr., 2013, 110, 58–68 CrossRef CAS PubMed.
- M. T. Abreu, Toll-like receptor signalling in the intestinal epithelium: how bacterial recognition shapes intestinal function, Nat. Rev. Immunol., 2010, 10, 131–143 CrossRef CAS PubMed.
- M. Michallet, G. Rota, K. Maslowski and G. Guarda, Innate receptors for adaptive immunity, Curr. Opin. Microbiol., 2013, 16, 296–302 CrossRef CAS PubMed.
- S. Gordon, Pattern recognition receptors: Doubling up for the innate immune response, Cell, 2002, 111, 927–930 CrossRef CAS PubMed.
- H. Hemmi and S. Akira, TLR signalling and the function of dendritic cells, Chem. Immunol. Allergy, 2005, 86, 120–135 CAS.
- T. Kubo, R. Hatton, J. Oliver, X. Liu, C. Elson and C. Weaver, Regulatory T cell suppression and anergy are differentially regulated by proinflammatory cytokines produced by TLR-activated dendritic cells, J. Immunol., 2004, 173, 7249–7258 CrossRef CAS.
- E. C. Y. Li-Chan, Bioactive peptides and protein hydrolysates: research trends and challenges for application as nutraceuticals and functional food ingredients, Curr. Opin. Food Sci., 2015, 1, 28–37 CrossRef.
- J. Rodriguez-Carrio, A. Fernandez, F. A. Riera and A. Suarez, Immunomodulatory activities of whey beta-lactoglobulin tryptic-digested fractions, Int. Dairy J., 2014, 34, 65–73 CrossRef CAS.
- X. Y. Mao, H. Y. Yang, J. P. Song, Y. H. Li and F. Z. Ren, Effect of yak milk casein hydrolysate on Th1/Th2 cytokines production by murine spleen lymphocytes in vitro, J. Agric. Food Chem., 2007, 55, 638–642 CrossRef CAS PubMed.
- S. Uematsu, K. Fujimoto, M. H. Jang, B. Yang, Y. Jung, M. Nishiyama, S. Sato, T. Tsujimura, M. Yamamoto, Y. Yokota, H. Kiyono, M. Miyasaka, K. J. Ishii and S. Akira, Regulation of humoral and cellular gut immunity by lamina propria dendritic cells expressing Toll-like receptor 5, Nat. Immunol., 2008, 9, 769–776 CrossRef CAS PubMed.
- C. Bourlieu, O. Menard, K. Bouzerzour, G. Mandalari, A. Macierzanka, A. R. Mackie and D. Dupont, Specificity of Infant Digestive Conditions: Some Clues for Developing Relevant In Vitro Models, Crit. Rev. Food Sci. Nutr., 2014, 54, 1427–1457 CrossRef PubMed.
- D. C. Dallas, M. A. Underwood, A. M. Zivkovic and J. B. German, Digestion of Protein in Premature and Term Infants, J. Nutr. Disord Ther., 2012, 2(3), 112 Search PubMed.
- C. Esteve, A. D'Amato, M. Luisa Marina, M. Concepcion Garcia and P. G. Righetti, Analytical Approaches for the Characterization and Identification of Olive (Olea europaea) Oil Proteins, J. Agric. Food Chem., 2013, 61, 10384–10391 CrossRef CAS PubMed.
- L. Vogt, U. Ramasamy, D. Meyer, G. Pullens, K. Venema, M. M. Faas, H. A. Schols and P. de Vos, Immune Modulation by Different Types of beta 2 -> 1-Fructans Is Toll-Like Receptor Dependent, PLoS One, 2013, 8, e68367 CAS.
- G. A. Paredes-Juarez, B. J. de Haan, M. M. Faas and P. de Vos, A Technology Platform to Test the Efficacy of Purification of Alginate, Materials, 2014, 7, 2087–2103 CrossRef CAS PubMed.
- T. T. P. Nguyen, B. Bhandari, J. Cichero and S. Prakash, Gastrointestinal digestion of dairy and soy proteins in infant formulas: An in vitro study, Food Res. Int., 2015, 76, 348–358 CrossRef CAS PubMed.
- H. Janowitz and F. Hollander, The Basal Secretion of Pepsin by the Human Stomach, J. Clin. Invest., 1952, 31, 338–340 CrossRef CAS PubMed.
- I. E. Gillespie and D. J. Bowen, The gastric secretion of pepsin in man, Gut, 1962, 3, 255–259 CrossRef CAS PubMed.
- L. Sams, J. Paume, J. Giallo and F. Carriere, Relevant pH and lipase for in vitro models of gastric digestion, Food Funct., 2016, 7, 30–45 CAS.
- C. Shani-Levi, P. Alvito, A. Andres, R. Assuncao, R. Barbera, S. Blanquet-Diot, C. Bourlieu, A. Brodkorb, A. Cilla, A. Deglaire, S. Denis, D. Dupont, A. Heredia, S. Karakaya, C. V. L. Giosafatto, L. Mariniello, C. Martins, O. Menard, S. N. El, G. E. Vegarud, E. Ulleberg and U. Lesmes, Extending in vitro digestion models to specific human populations: Perspectives, practical tools and bio-relevant information, Trends Food Sci. Technol., 2017, 60, 52–63 CrossRef CAS.
- G. M. Murphy and E. Signer, Bile acid metabolism in infants and children, Gut, 1974, 15(2), 151–163 CrossRef CAS PubMed.
- B. Hernandez-Ledesma, A. Quiros, L. Amigo and I. Recio, Identification of bioactive peptides after digestion of human milk and infant formula with pepsin and pancreatin, Int. Dairy J., 2007, 17, 42–49 CrossRef CAS.
- B. Hernandez-Ledesma, M. Jose Garcia-Nebot, S. Fernandez-Tome, L. Amigo and I. Recio, Dairy protein hydrolysates: Peptides for health benefits, Int. Dairy J., 2014, 38, 82–100 CrossRef CAS.
- M. Papiz, L. Sawyer, E. Eliopoulos, A. North, J. Findlay, R. Sivaprasadarao, T. Jones, M. Newcomer and P. Kraulis, The Structure of Beta-Lactoglobulin and its Similarity to Plasma Retinol-Binding Protein, Nature, 1986, 324, 383–385 CrossRef CAS PubMed.
- P. Restani, C. Ballabio, C. Di Lorenzo, S. Tripodi and A. Fiocchi, Molecular aspects of milk allergens and their role in clinical events, Anal. Bioanal. Chem., 2009, 395, 47–56 CrossRef CAS PubMed.
- M. B. G. Kiewiet, B. C. A. M. van Esch, J. Garssen, M. M. Faas and P. de Vos, Partially hydrolyzed whey proteins prevent clinical symptoms in a cow's milk allergy mouse model and enhance regulatory T and B cell frequencies, Mol. Nutr. Food Res., 2017, 61, 1700340 Search PubMed.
- K. Nishinari, Y. Fang, S. Guo and G. O. Phillips, Soy proteins: A review on composition, aggregation and emulsification, Food Hydrocolloids, 2014, 39, 301–318 CrossRef CAS.
- M. Carbonaro, P. Maselli and A. Nucara, Structural aspects of legume proteins and nutraceutical properties, Food Res. Int., 2015, 76, 19–30 CrossRef CAS.
- F. Guyomarc'h, M. Nono, T. Nicolai and D. Durand, Heat-induced aggregation of whey proteins in the presence of kappa-casein or sodium caseinate, Food Hydrocolloids, 2009, 23, 1103–1110 CrossRef.
- M. Carbonaro, P. Maselli and A. Nucara, Relationship between digestibility and secondary structure of raw and thermally treated legume proteins: a Fourier transform infrared (FT-IR) spectroscopic study, Amino Acids, 2012, 43, 911–921 CrossRef CAS PubMed.
- P. Havea, H. Singh and L. Creamer, Characterization of heat-induced aggregates of beta-lactoglobulin, alpha-lactalbumin and bovine serum albumin in a whey protein concentrate environment, J. Dairy Res., 2001, 68, 483–497 CrossRef CAS PubMed.
- P. Havea, H. Singh, L. Creamer and O. Campanella, Electrophoretic characterization of the protein products formed during heat treatment of whey protein concentrate solutions, J. Dairy Res., 1998, 65, 79–91 CrossRef CAS.
- M. Verheul, S. Roefs and K. de Kruif, Kinetics of heat-induced aggregation of beta-lactoglobulin, J. Agric. Food Chem., 1998, 46, 896–903 CrossRef CAS.
- T. Kajander, P. Kahn, S. Passila, D. Cohen, L. Lehtio, W. Adolfsen, J. Warwicker, U. Schell and A. Goldman, Buried charged surface in proteins, Structure, 2000, 8, 1203–1214 CrossRef CAS PubMed.
- F. Monahan, J. German and J. Kinsella, Effect of Ph and Temperature on Protein Unfolding and Thiol-Disulfide Interchange Reactions during Heat-Induced Gelation of Whey Proteins, J. Agric. Food Chem., 1995, 43, 46–52 CrossRef CAS.
- M. Hoffmann and P. vanMil, Heat-induced aggregation of beta-lactoglobulin: Role of the free thiol group and disulfide bonds, J. Agric. Food Chem., 1997, 45, 2942–2948 CrossRef CAS.
- M. de la Fuente, H. Singh and Y. Hemar, Recent advances in the characterisation of heat-induced aggregates and intermediates of whey proteins, Trends Food Sci. Technol., 2002, 13, 262–274 CrossRef CAS.
- O. Menard, T. Cattenoz, H. Guillemin, I. Souchon, A. Deglaire, D. Dupont and D. Picque, Validation of a new in vitro dynamic system to simulate infant digestion, Food Chem., 2014, 145, 1039–1045 CrossRef CAS PubMed.
- K. Kranzer, A. Eckhardt, M. Aigner, G. Knoll, L. Deml, C. Speth, N. Lehn, M. Rehli and W. Schneider-Brachert, Induction of maturation and cytokine release of human dendritic cells by Helicobacter pylori, Infect. Immun., 2004, 72, 4416–4423 CrossRef CAS PubMed.
- C. Ahonen, S. Gibson, R. Smith, L. Pederson, J. Lindh, M. Tomai and J. Vasilakos, Dendritic cell maturation and subsequent enhanced T-cell stimulation induced with the novel synthetic immune response modifier R-848, Cell. Immunol., 1999, 197, 62–72 CrossRef CAS PubMed.
- T. L. Denning, Y. Wang, S. R. Patel, I. R. Williams and B. Pulendran, Lamina propria macrophages and dendritic cells differentially induce regulatory and interleukin 17-producing T cell responses, Nat. Immunol., 2007, 8, 1086–1094 CrossRef CAS PubMed.
- M. Mohamadzadeh, S. Olson, W. Kalina, G. Ruthel, G. Demmin, K. Warfield, S. Bavari and T. Klaenhammer, Lactobacilli activate human dendritic cells that skew T cells toward T helper 1 polarization, Proc. Natl. Acad. Sci. U. S. A., 2005, 102, 2880–2885 CrossRef CAS PubMed.
- M. B. G. Kiewiet, M. Gros, R. J. J. van Neerven, M. M. Faas and P. de Vos, Immunomodulating properties of protein hydrolysates for application in cow's milk allergy, Pediatr. Allergy Immunol., 2015, 26, 206–217 CrossRef CAS PubMed.
- C. Wang, B. Wang and B. Li, Bioavailability of peptides from casein hydrolysate in vitro: Amino acid compositions of peptides affect the antioxidant efficacy and resistance to intestinal peptidases, Food Res. Int., 2016, 81, 188–196 CrossRef CAS.
- C. Hoarau, C. Lagaraine, L. Martin, F. Velge-Roussel and Y. Lebranchu, Supernatant of Bifidobacterium breve induces dendritic cell maturation, activation, and survival through a Toll-like receptor 2 pathway, J. Allergy Clin. Immunol., 2006, 117, 696–702 CrossRef CAS PubMed.
| This journal is © The Royal Society of Chemistry 2018 |