
 Open Access Article
 This Open Access Article is licensed under a
 Creative Commons Attribution 3.0 Unported Licence
Synthesis, crystallisation and thermodynamics of two polymorphs of a new derivative of meglumine: 1-(2,2,3-trimethyl-1,3-oxazolidin-5-yl)-butane-1,2,3,4-tetrol†
Michael
Svärd
 *ab,
Gamidi Rama
Krishna
a and
Åke C.
Rasmuson
ab
*ab,
Gamidi Rama
Krishna
a and
Åke C.
Rasmuson
ab
aSynthesis and Solid State Pharmaceutical Centre, Department of Chemical and Environmental Science, Bernal Institute, University of Limerick, Castletroy, Ireland
bDepartment of Chemical Engineering, KTH Royal Institute of Technology, Stockholm, Sweden. E-mail: micsva@kth.se
First published on 1st December 2017
Abstract
A new compound, 1-(2,2,3-trimethyl-1,3-oxazolidin-5-yl)-butane-1,2,3,4-tetrol, has been discovered, described, and its crystal polymorphism investigated. The crystal structures of two polymorphs have been solved with single-crystal X-ray diffraction. The molecule is chiral with four stereo centers, and both polymorphs crystallise in the non-centrosymmetric orthorhombic, chiral P212121 space group, with one molecule in the asymmetric unit. In both structures the molecules are arranged three dimensionally in an interlocked manner, stabilized by strong O–H⋯O and weaker C–H⋯O and π⋯π interactions. The polymorphs have been characterized by X-ray powder diffraction (XRPD) and infrared spectroscopy (IR). The thermodynamic stability relationship between the polymorphs from 280 K up to the melting points has been quantitatively determined by differential scanning calorimetry (DSC), through measurement of melting points, heats of fusion, and heat capacities of the solid phases and the supercooled melt. It is established that the relationship is most likely monotropic, with one polymorph (FI) stable throughout the entire evaluated temperature range. The stability relationship at room temperature has been confirmed by a slurry conversion experiment.
Introduction
Crystallisation is an important process in the manufacturing of many organic compounds including most pharmaceutical compounds.1 A recent study has shown that as much as two thirds of the pharmaceutical compounds subjected to a thorough screening for solid phases are able to form more than one unique crystal structure, a phenomenon known as polymorphism.2 In the pharmaceutical industry, polymorphism has been an important topic for over 20 years, and there are regulations that require all solid forms of a drug compound to be identified. In addition, individual polymorphs can be protected by IP rights.3,4 Polymorphs differ with respect to important physicochemical properties, such as solubility, dissolution rate, melting point, and density, and often crystallise in different shapes.5 At each given set of conditions (temperature and pressure), except at possible transition points, there is exactly one thermodynamically stable polymorph with the lowest Gibbs energy and solubility of all potential polymorphs.6 In particular for pharmaceutical products it is generally desirable to obtain the thermodynamically stable polymorph, although sometimes it can be more important to be able to reliably produce a metastable form. Determining which polymorph is thermodynamically stable, whether the relationship between a polymorphic pair is enantiotropic or monotropic, and in case of the former, the location of the transition point, can be laborious.7 The analysis is generally accomplished through solvent-mediated polymorphic transformation in slurry conversion experiments8 and/or measurement and comparison of solubility curves.9 However, due to the often rapid transformation of metastable phases in solution, obtaining a quantitative stability relationship between polymorphs can be particularly difficult, and reports of solved cases are scarce in the open literature.N-Methyl-D-glucamine (meglumine, C7H17NO5, CAS number 6284-40-8) is an amino sugar derived from sorbitol. Meglumine is a common pharmaceutical excipient compound, used to improve the shelf-life of the active pharmaceutical ingredients, as a salt former, and in the preparation of radiopaque contrast media. As a pentavalent antimony compound it also finds use as a therapeutic agent in the treatment of Leishmaniasis.10 Its molecular structure is shown in Fig. 1a. In the course of a previously reported study of this compound, a new derivative compound was serendipitously discovered while working in acetone solution. The derivative compound was isolated and identified as 1-(2,2,3-trimethyl-1,3-oxazolidin-5-yl)-butane-1,2,3,4-tetrol, C10H21NO5, Mw = 235.28 g mol−1. The molecular structure, shown in Fig. 1b, consists of a five-membered oxazole ring connected to an aliphatic side chain, containing one primary –OH and three secondary –OH functional groups.
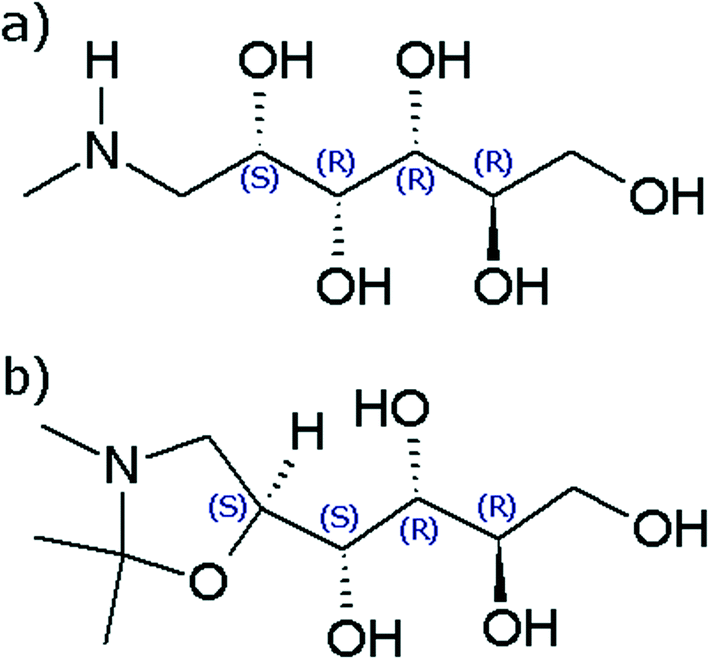 | ||
| Fig. 1 Molecular structure of a) meglumine and b) the title compound. | ||
The reaction of meglumine with acetone resulting in the title compound, shown in Scheme 1, is a condensation reaction between one meglumine and one acetone molecule, with the loss of one molecule of water. In effect, it is a reductive alkylation, resulting in the conversion of a secondary amine into an oxazolidine ring compound. To the best of our knowledge, this compound has never before been reported or described in the literature. Consequently, it lacks standard chemical identifiers, such as a CAS number. The new compound has been characterized by 1H-NMR and mass spectrometry. The two crystalline phases encountered have been characterized by differential scanning calorimetry (DSC), X-ray powder diffraction (XRPD) and infrared spectroscopy (IR), and their crystal structures have been determined by single crystal X-ray diffraction (XRD). A quantitative thermodynamic analysis of the polymorphic stability relationship has been accomplished based on calorimetric data of the two solid phases.
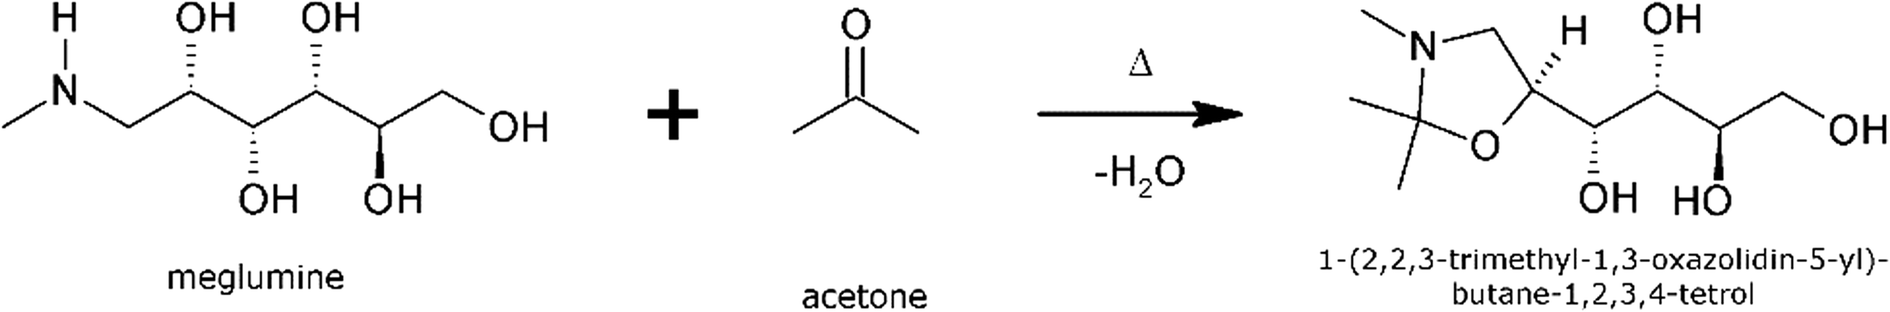 | ||
| Scheme 1 Synthetic route to obtain the title compound. | ||
Experimental work
Materials
Meglumine (N-methyl-D-glucamine, mass based purity = 0.990) was purchased from Sigma-Aldrich and used as received. Acetone (purity >0.998%) was purchased from VWR and used as received.Synthesis of title compound
The title compound was obtained by mixing meglumine and acetone in excess of meglumine solubility in a capped glass bottle equipped with a PTFE coated stir bar, and agitating the suspension using a submersible magnetic stirrer inside a water bath at a temperature of 50 °C. After approx. 24 h, the transformation from meglumine into the derivative compound was complete, as verified by infrared spectroscopy of sampled solids. Two different crystal polymorphs of the compound were obtained in repeat experiments carried out under identical conditions, viz. 50 °C in acetone solution, henceforth termed FI and FII. Either pure FI or pure FII was always obtained in each slurry, and no transformation between the polymorphs was recorded over the course of the project. In the dried state at room temperature, the material is observed to slowly transform back into meglumine over a period of days or weeks.A screening study was undertaken to probe the propensity for meglumine to react in a similar way with other ketone solvents. Slurries containing excess solid meglumine powder in 100 mL solutions of methyl isobutyl ketone (MIBK), methyl ethyl ketone (MEK), 2-butanone and 3-pentanone were prepared in round bottom flasks and heated under reflux for 3–6 h. The crystals were then filtered and analysed with IR. In the two solvents with the highest boiling points (MIBK and 3-pentanone) the IR spectra obtained after 3 h showed differences from the meglumine spectrum, indicating a reaction had occurred, while in MEK and 2-butanone the spectrum was unchanged after 6 h. The experiment shows that this particular type of reaction between meglumine and ketones is not restricted to acetone, which could have important implications for the pharmaceutical industry.
Single crystal X-ray diffraction (SC-XRD)
X-ray diffraction data was collected using an APEX D8 QUEST diffractometer (Bruker) equipped with a temperature control stage (Oxford Cryosystems). The software package used was APEX2,11 with cell refinement and data reduction done with the SAINT program. The crystal structures of FI and FII have been solved by direct methods using SHELXS-9712 and refined by full matrix least-squares refinement on F2 with anisotropic displacement parameters for non-H atoms, using SHELXS-97. OH hydrogen atoms were located in a difference map and refined freely. Aromatic and aliphatic –CH hydrogen atoms were generated by the riding model in idealized geometries. The absolute stereochemistry was determined based on refinement of the Flack parameter.13 The software used for molecular graphics is XSeed v. 1.5.14Powder characterisation by X-ray powder diffraction (XRPD) and infrared spectroscopy (IR)
Samples of solid FI and FII were dried at room temperature for 5 min and then analysed by FTIR spectroscopy and XRPD. IR spectra were collected using a Spectrum One spectrometer (Perkin Elmer) equipped with an ATR accessory. Scans covered the wavenumber range 650–2000 cm−1 with a resolution of 4 cm−1. XRPD diffractograms were collected using an Empyrean diffractometer (PANalytical) operating in transmission mode, over the 2θ-range 5–40° using Cu Kα radiation.1H-NMR spectroscopy
1H-NMR and 13C-NMR spectra of the title compound in deuterated DMSO (d6) solution at room temperature were collected using an AV 400 spectrometer (Bruker) operating at 400.23 MHz and 100.6 MHz, respectively. Proton chemical shifts (δ) are relative to tetramethylsilane (TMS, δ = 0.00) as internal standard and expressed in ppm.Mass spectrometry
The mass spectrum of the title compound was obtained using a 1260 Infinity HPLC system together with a 1260 Infinity Multiple Wavelength Detector (Agilent), coupled with a G6120B Single Quadrupole Mass Spectrometer Detector (Agilent). The spectrum was acquired in positive ion mode using 1% formic acid as buffer, and a mobile phase consisting of acetonitrile and methanol (99![[thin space (1/6-em)]](https://www.rsc.org/images/entities/char_2009.gif) :1).
:1).
Differential scanning calorimetry (DSC)
The melting temperature and the associated enthalpy of fusion of FI and FII were determined using a Q2000 calorimeter (TA Instruments). A constant heating rate of 5 K min−1 was used, starting from ambient temperature. The heat capacity of the solid forms FI and FII and of the supercooled melt were measured by temperature-modulated DSC using the same instrument. A modulation period of 100 s and an amplitude of 1 K were used, with an underlying constant heating rate of 5 K min−1. The heat capacity of the supercooled melt was obtained by rapidly cooling the melt obtained after the initial heating step, inside the pan, to a temperature below the melting point while above the temperature where it recrystallises, followed by heating again at 5 K min−1.In all DSC runs, powder samples of approx. 5 mg were distributed evenly in Tzero aluminium pans. The furnace was purged with nitrogen gas (50 mL min−1) and the instrument was calibrated against the melting properties of indium. The heat capacity signal was calibrated using a sapphire sample, with a linear correction function of the temperature. Mass differences between sample and reference pans were always ≤0.20 mg.
Results and discussion
Characterisation of the compound and its polymorphs
1H and 13C NMR spectra of the obtained new compound are provided as ESI.† For 1H NMR, resulting spin multiplicities δ are obtained as: 4.47 (s 2H), 4.36 (s 2H), 4.01–3.97 (q 1H), 3.59–3.57 (d 2H), 3.40–3.35 (m 2H), 3.23–3.21 (d 1H), 2.89–2.85 (m 1H), 2.70–2.66 (m 1H), 2.2 (s 3H) and 1.13 (s 6H). For 13C NMR, the obtained δ values are 94.43, 76.22, 71.27, 71.06, 71.03, 63.60, 53.90, 35.25 and 23.40.The mass spectrum obtained for the title compound is provided as ESI.† The three peaks obtained, with a relative abundance ratio of approx. 100:12:2, have mass-to-charge ratios of 236.2, 237.2 and 238.2, respectively. This may be compared with the molar mass of the title compound of 235.28 g mol−1.
The title compound is chiral, with four stereo centers at carbon atoms along the carbon chain: C2 (R), C3 (R), C4 (S) and C5 (S). Both polymorphs FI and FII crystallise in the orthorhombic, non-centrosymmetric chiral space group P212121 with one molecule in the asymmetric unit (Z′ =1). Data for the crystal structures determined at 100 K are given in Table 1. ORTEP diagrams of the molecule in the FI and FII structures are shown in Fig. 2.
| FI | FII | |
|---|---|---|
| Empirical formula | C10H21NO5 | |
| Formula weight | 235.28 | |
| Crystal system | Orthorhombic | Orthorhombic |
| Space group | P212121 | P212121 |
| Unit cell dimensions | a = 6.0781(3) Å | a = 7.0282(6) Å |
| b = 10.8821(6) Å | b = 9.9007(8) Å | |
| c = 17.8535(10) Å | c = 17.2379(15) Å | |
| α = 90° | α = 90° | |
| β = 90° | β = 90° | |
| γ = 90° | γ = 90° | |
| Cell volume | 1180.87(11) Å3 | 1199.48(18) Å3 |
| Z | 4 | 4 |
| Temperature | 100(2) K | 100(2) K |
| Radiation | Mo Kα radiation | Mo Kα radiation |
| Wavelength | λ = 0.71073 Å | λ = 0.71073 Å |
| Absorption coefficient | μ = 0.105 mm−1 | μ = 0.103 mm−1 |
| Crystal size | 0.45 × 0.24 × 0.20 mm3 | 0.33 × 0.22 × 0.19 mm3 |
| Data collection | ||
| Instrument | Bruker APEX D8 QUEST diffractometer | Bruker APEX D8 QUEST diffractometer |
| Reflections measured | 20697 |
9958 |
| Independent reflections | 2532 | 2631 |
| Reflections with I > 2σ(I) | 2509 | 2471 |
| R int | 0.0229 | 0.0312 |
| Refinement | ||
| R[F2 > 2σ(F2)] | 0.0228 | 0.0275 |
| wR(F2) | 0.0595 | 0.0675 |
| S | 1.072 | 1.030 |
| Δρmax | 0.243 e Å−3 | 0.244 e Å−3 |
| Δρmin | −0.141 e Å−3 | −0.149 e Å−3 |
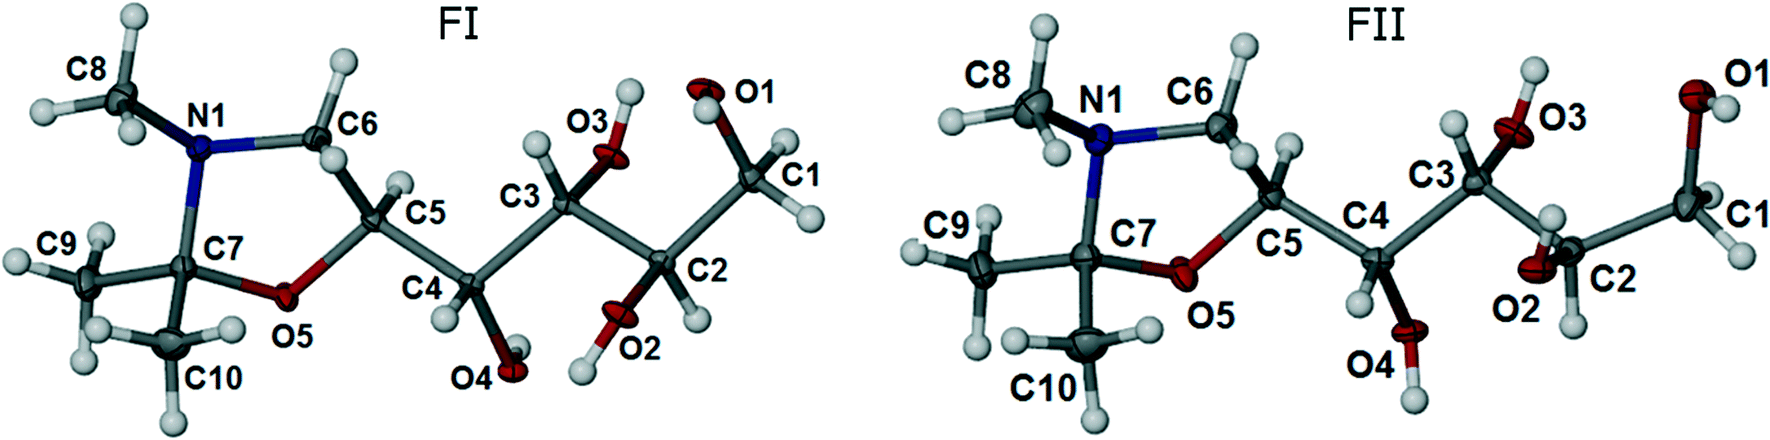 | ||
| Fig. 2 ORTEP representations of FI and FII, with displacement ellipsoids drawn at the 50% probability level. | ||
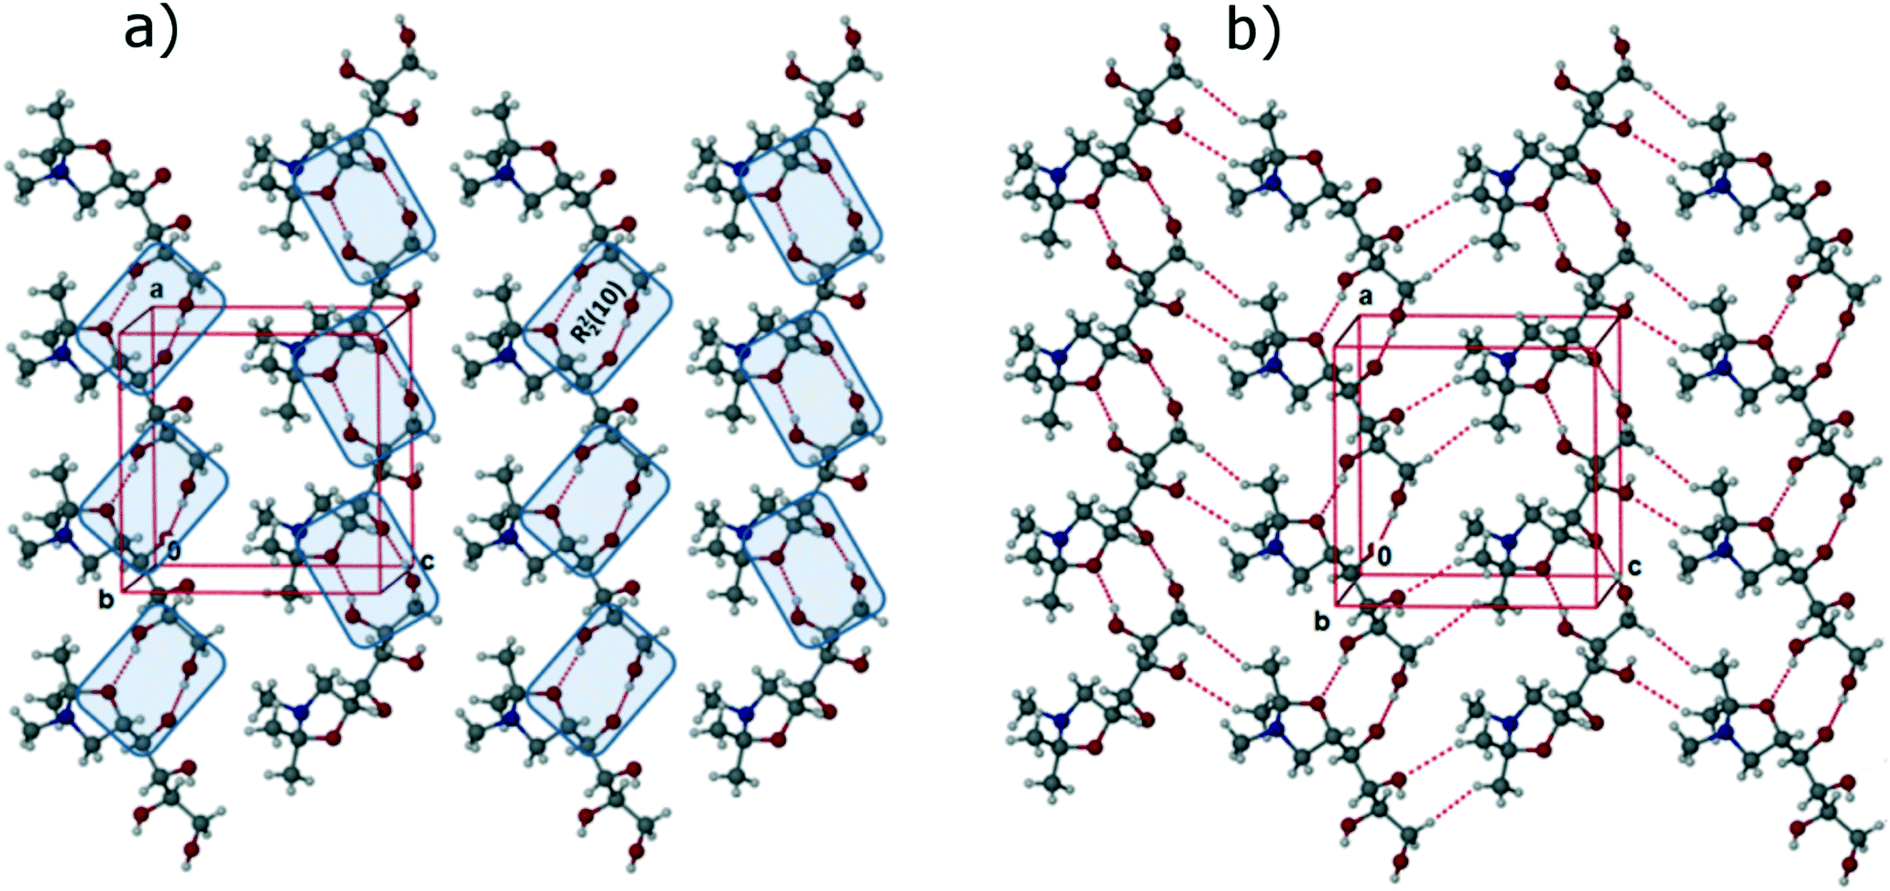
In the FI structure, the molecules are connected by 1D chains along the crystallographic a-axis via strong and directional R22 (10) synthons15 through O–H⋯O (O1–H1⋯O3: 2.7311(13) Å, 165(2)°; O4–H4A⋯O2: 2.7133(13) Å, 159(2)°) intermolecular interactions as shown in Fig. 3a. The 1D chains are stacked in a head-to-head fashion, with neighbouring chains arranged in opposite directions as shown in Fig. 3b. Thus, molecules are connected head-to-head along the b-axis by strong R33 (10) synthons through O–H⋯O (O2–H2A⋯O1: 2.7481(13) Å, 166.7(18)°; O3–H3A⋯O4: 2.7041(13) Å, 167(2)°) intermolecular interactions, forming corrugated 2D sheets along ab-plane as shown in Fig. 3c. In the third dimension, these 2D sheets are stabilized by weak C–H⋯O (C1–H1B⋯O5: 3.3627(16) Å, 166.9(15)°) and C–H⋯H intermolecular interactions. As a whole, the FI structure attains a 3D interlocked network packing.
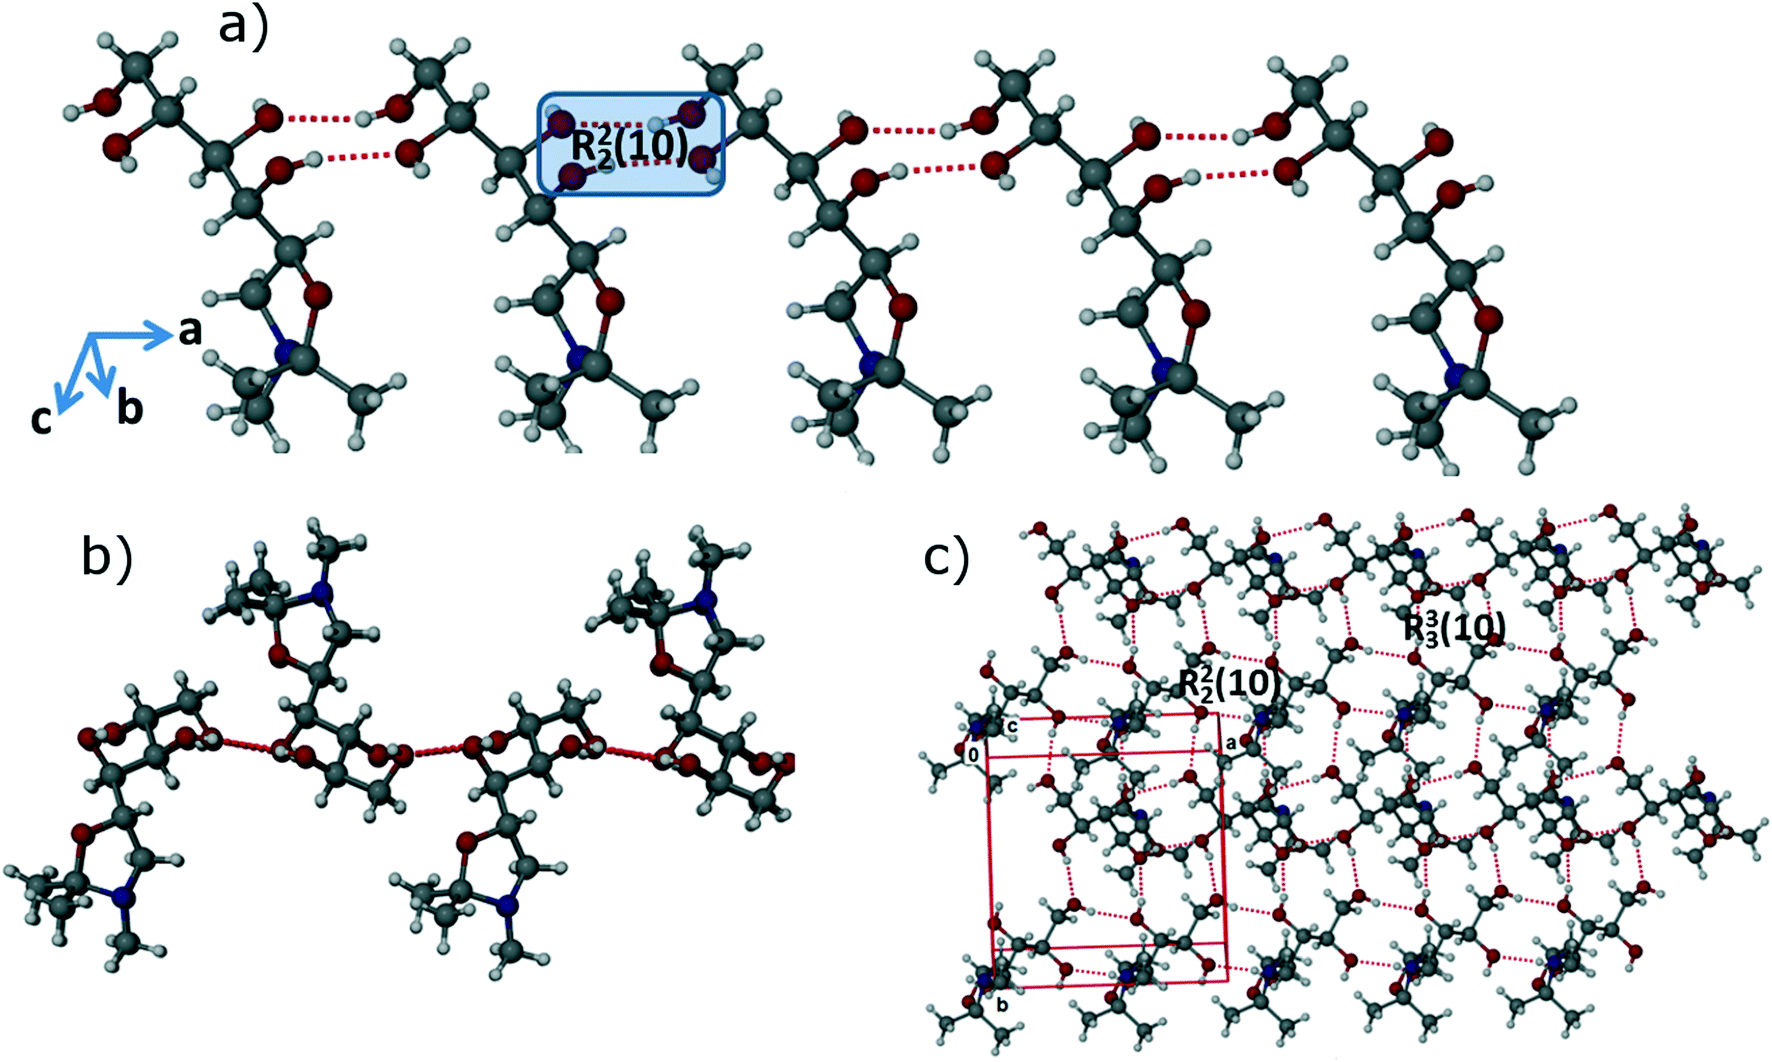 | ||
| Fig. 3 Crystal structure of FI: a) 1D chain along the a-axis via R22 (10) synthons through O–H⋯O intermolecular interactions; b) connection of 1D chains in head-to-head fashion via O–H⋯O interactions to form 2D sheets; c) representation of a 2D sheet along the ab-plane. | ||
In the FII structure, analogous to FI, the molecules are connected by R22 (10) synthons through O–H⋯O (O1–H1⋯O4: 2.7310(17) Å, 172(2)°; O2–H2⋯O1: 2.9168(17) Å, 108(2)°; O2–H2⋯O5: 2.8423(17) Å, 163(2)°; O4–H4⋯O2: 2.6666(17) Å, 175(2)°) interactions, leading to the formation of 1D chains along the crystallographic a-axis, as shown Fig. 4a. These 1D chains are connected through weak C–H⋯O (C2–H2A⋯O4: 2.9815(18) Å, 106.3(14)°; C6–H6B⋯O1: 3.247(2) Å, 140°) and van der Waals' interactions, to form 2D corrugated sheets as shown in Fig. 4b. The 2D sheets are stabilized in the third dimension by both C–H⋯O and O–H⋯N (O3–H3⋯N1: 2.8173(19) Å, 170(2)°) interactions. The overall structure can be described as a 3D interlocked crystal packing featuring O–H⋯O, O–H⋯N, C–H⋯O and π-stacking interactions.
 | ||
| Fig. 4 Crystal structure of FII: a) 1D chains along the a-axis via R22 (10) synthons through O–H⋯O intermolecular interactions; b) formation of corrugated 2D sheet via multiple O–H⋯O and C–H⋯O intermolecular interactions. | ||
One main difference between the FI and FII structures is that, whereas in the former the oxygen of the oxazole ring is involved in the formation of weak C–H⋯O intermolecular interactions, in the FII structure the oxazole oxygen acts as a hydrogen bonding acceptor, forming the O–H⋯O hydrogen bond with the secondary –OH functional group of the C2 carbon (>CH–OH). In addition, the structures differ with respect to molecular torsional angles of the aliphatic side chain (tabulated in ESI†), most notably for the torsion C1–C2–C3–C4 (FI: −176.8(1)°; FII: 157.2(1)°). The differences are sufficient for this to be considered a case of conformational polymorphism, as shown in the overlay diagram in Fig. 5.
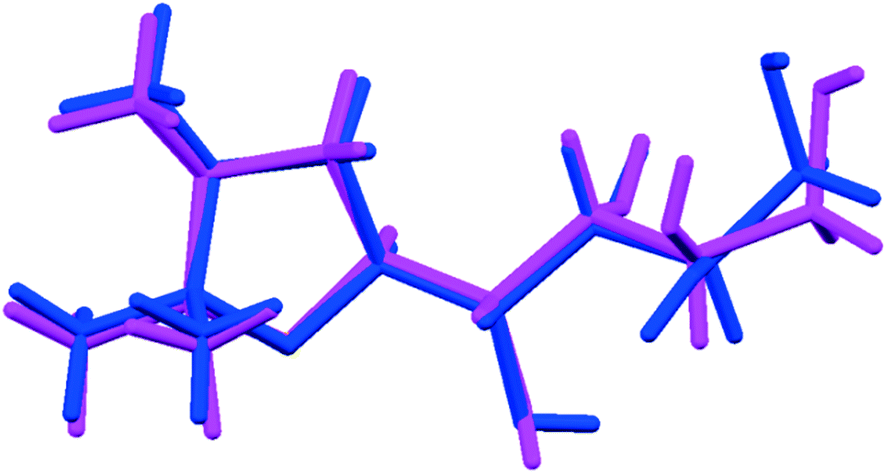 | ||
| Fig. 5 Overlay of the molecular conformations found in FI (blue) and FII (magenta). | ||
In Fig. 6, the X-ray powder diffractograms of the two polymorphs, experimentally determined at room temperature, are shown together with diffractograms simulated from the crystal structures. The experimental and simulated patterns correspond well for both polymorphs, and there are significant differences between the patterns of the two solid forms. The small peaks in the experimental FII pattern at 9.1° and 12.5° are most likely caused by the presence of a small amount of meglumine in the powder. Fig. 7 shows the IR spectra of the two polymorphs. There are significant differences between the spectra, most notably that i) FI has a strong single peak at 1270 cm−1 whereas FII has three smaller peaks in the range 1250–1300 cm−1, and ii) the two peaks at 1085 cm−1 and 1055 cm−1 in FI are replaced by one strong double peak at 1065 cm−1 in FII. The IR spectra are sufficiently different between the polymorphs to enable this technique to be used for polymorph identification and quantification.
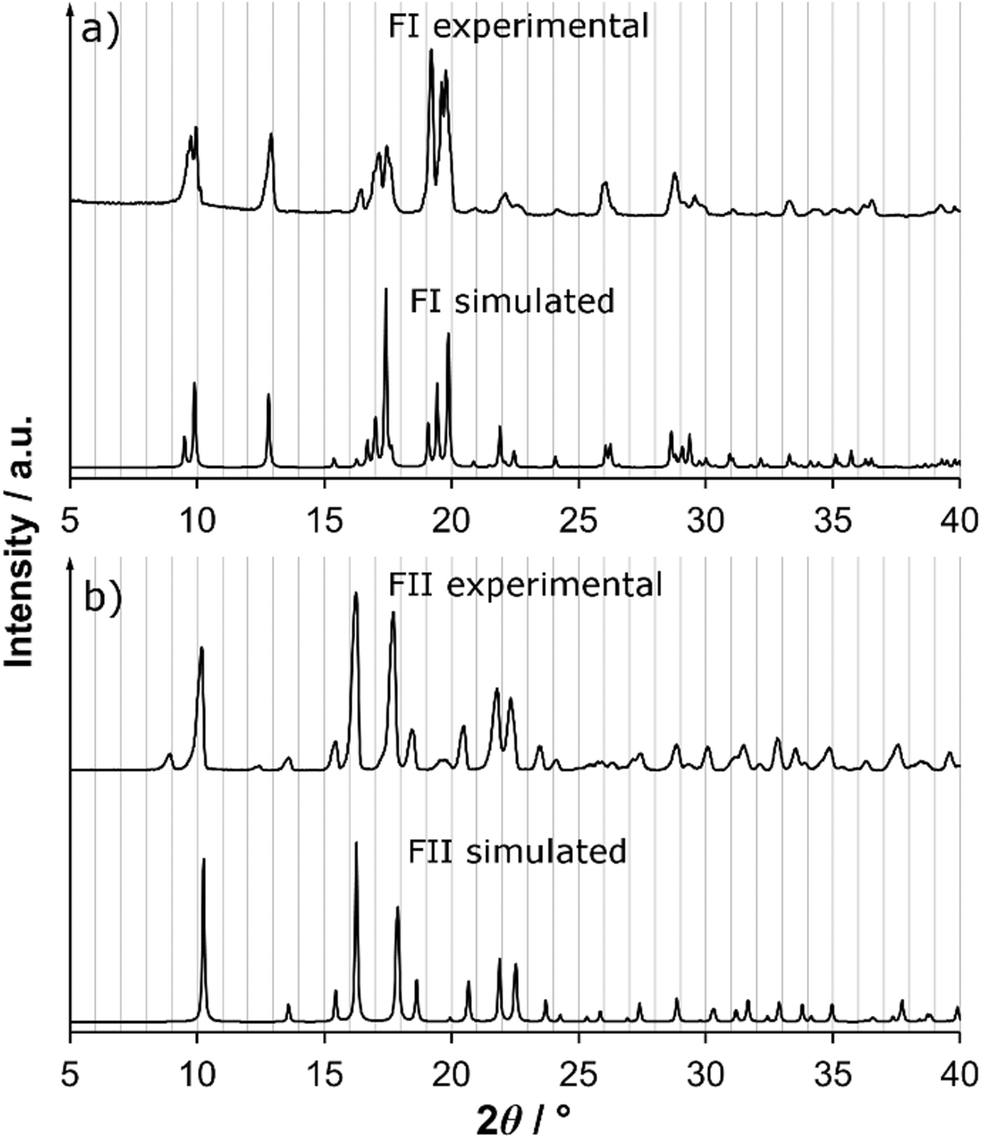 | ||
| Fig. 6 Experimental and simulated XRPD patterns of a) FI and b) FII. | ||
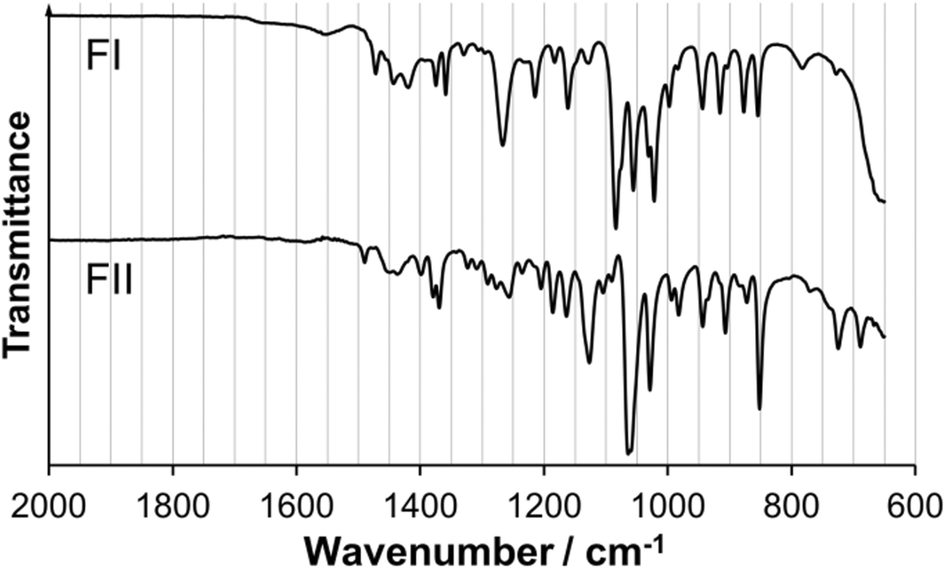 | ||
| Fig. 7 Infrared spectra of FI and FII. | ||
The FI and FII structures were analysed with Hirshfeld surface analysis16 and the intermolecular interactions percentages were quantified by fingerprint plots, using the software Crystal Explorer v. 3.1,17 with energies calculated using dispersion-corrected density functional theory. The resulting surfaces are shown in Fig. 8a and b, and the fingerprint plots in Fig. 8c and d. Surface colours indicate interaction distance; red represents close contacts and blue longer distances, and white regions correspond to typical dispersion interaction distances. Although overall the Hirshfeld surfaces of the two polymorphs are quite similar, signifying a strong similarity with respect to intermolecular interactions, they do exhibit some distinct differences. The percentages of different intermolecular interactions of the two polymorphs have been quantified and compared in Fig. 8e. In both forms, H⋯H interactions are more dominant than any other interactions, as is common for all organic components. FI contains 72.3% H⋯H interactions whereas FII contains 70.3%. The other dominant interactions, which are stronger and more directional than H⋯H interactions, are: O–H⋯Oinside (13.5% in FI, 14.3% in FII), O–H⋯Ooutside (11.9% in FI, 12.8% in FII), O–H⋯Ninside (1.1% in FI, 1.3% in FII) and O–H⋯Noutside (1.1% in FI, 1.3% in FII).
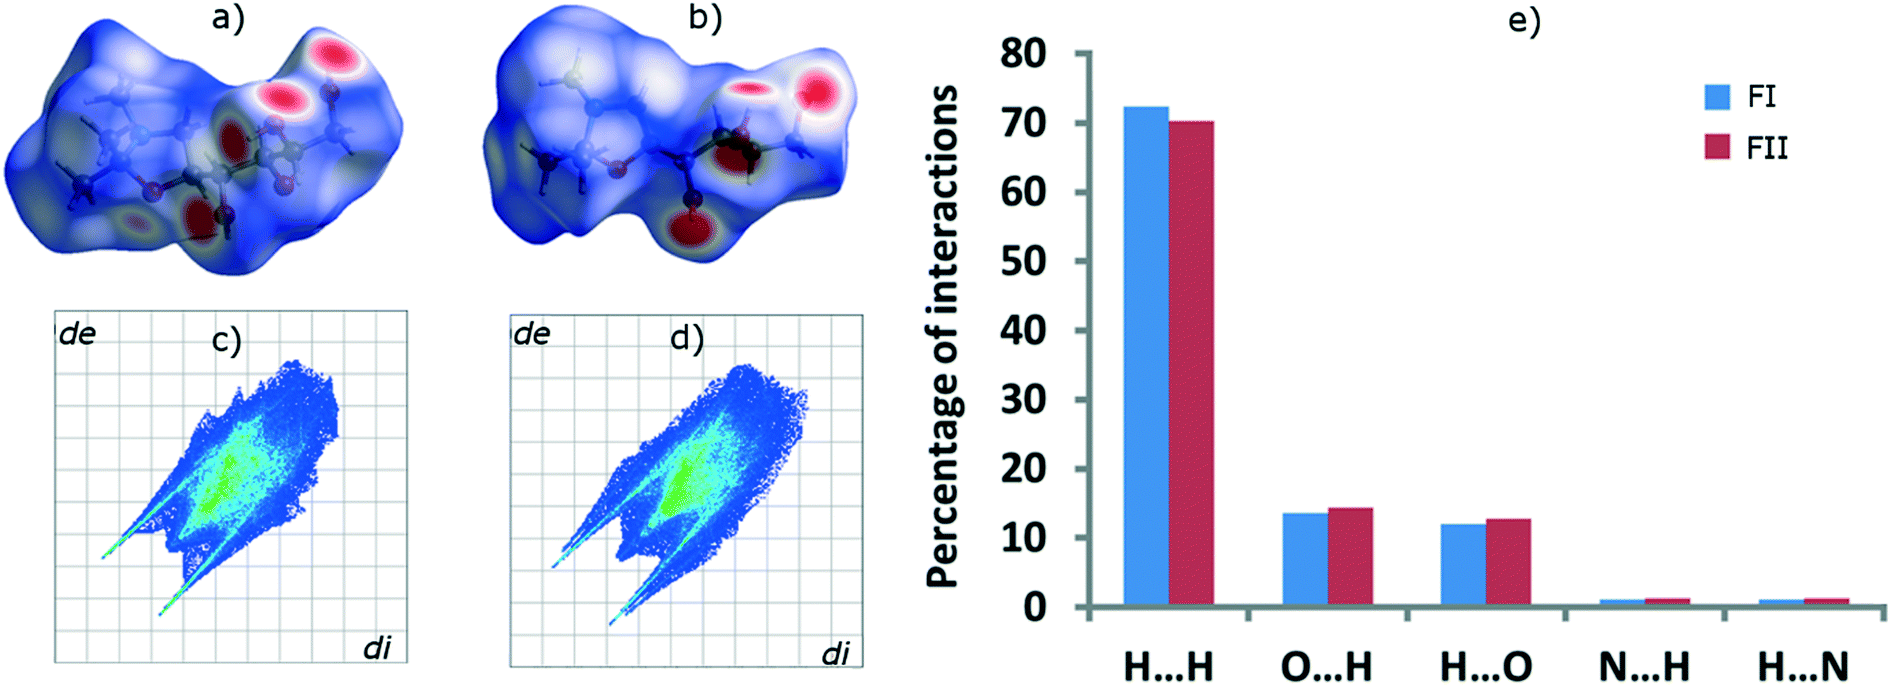 | ||
| Fig. 8 Hirshfeld surfaces of a) FI and b) FII, fingerprint plots of c) FI and d) FII, and e) percentages of different intermolecular interactions in the two polymorphs. | ||
Thermodynamic stability relationship of polymorphs
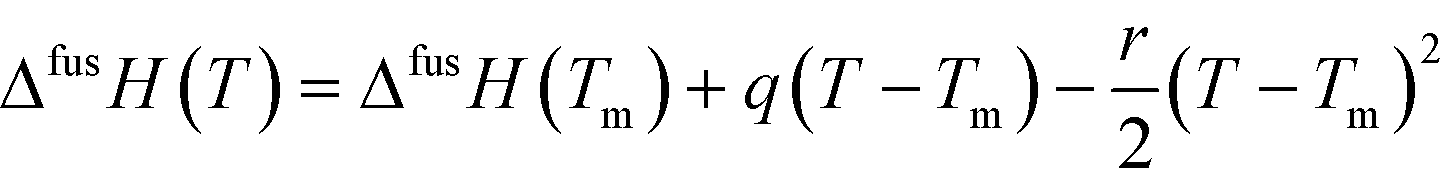
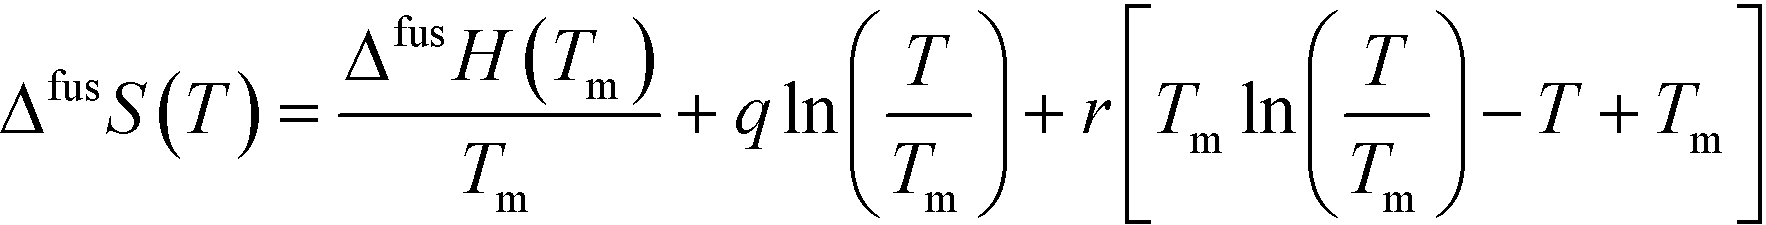
Fig. 9a shows DSC thermograms of the pure polymorphs. On heating, neither thermogram exhibits any thermal activity indicating phase transformations prior to the respective melting peaks. The extrapolated onset melting point of FI is 410.4 K (standard error SE = 0.10 K) with an associated enthalpy of fusion of 48.2 kJ mol−1 (SE = 0.24 kJ mol−1), averaged over 5 runs. For FII, the corresponding values are 395.3 K (SE = 0.21 K) and 48.0 kJ mol−1 (SE = 0.59 kJ mol−1), averaged over 4 runs. The fact that the melting point of FI is higher than that of FII shows that at high temperatures FI is the thermodynamically stable polymorph, and the absence of phase transformations in both thermograms below melting means that both polymorphs are kinetically stable on heating under the conditions of the DSC experiments. Using modulated DSC, the heat capacities of both polymorphs, as well as of the melt, partially supercooled below the melting points of both solid forms, were successfully determined over significant temperature ranges: for FI as an average of 4 runs over the temperature range 279–379 K, for FII as an average of 7 runs over the temperature range 275–370 K, and the melt as an average of 4 runs over the temperature range 363–413 K. Averaged heat capacity curves are shown in Fig. 9b. All curves are visibly linear, and have been cut off at the points where they start to deviate from linear behaviour because of proximity to the onset of melting. The heat capacities of FI and FII are fairly similar, with slightly higher values obtained for FII, but this difference is within the statistical uncertainty limits. Experimental data values at selected temperatures are tabulated in the ESI.† The data has been used to fit a linear function of two parameters, eqn (1), for the two solid forms and for the melt. The resulting coefficients are, for FI: a = 1.050 J mol−1 K−2, b = 18.4 J mol−1 K−1, for FII: a = 1.042 J mol−1 K−2, b = 29.4 J mol−1 K−1, and for the melt: a = 0.3394 J mol−1 K−2, b = 445.6 J mol−1 K−1. Cp is the heat capacity in J mol−1 K−1, and T denotes the absolute temperature in K.| Cp = aT + b | (1) |
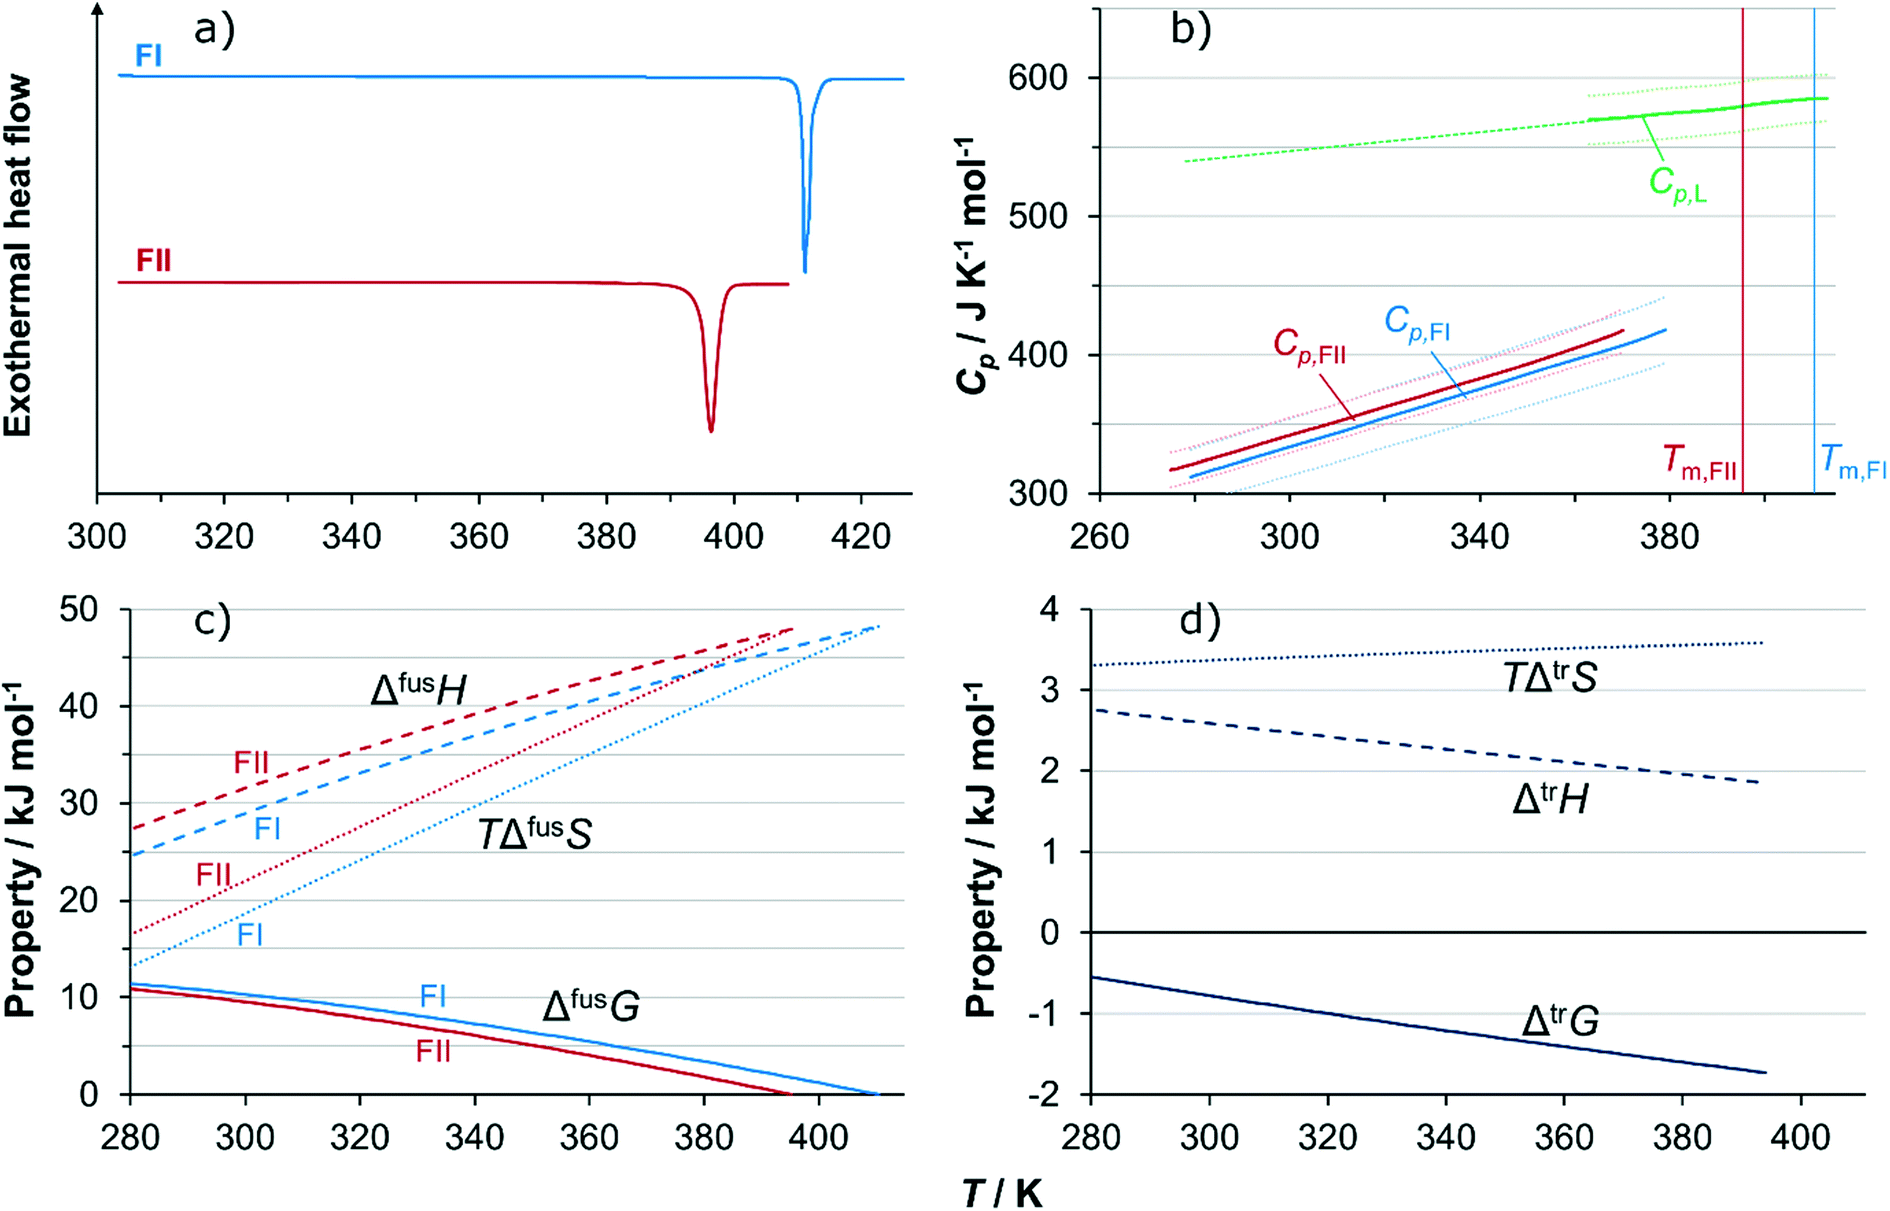 | ||
| Fig. 9 a) DSC thermograms showing melting peaks of FI and FII; b) heat capacities of FI, FII and the melt determined by modulated DSC, with wrapping lines marking 90% confidence limits and dashed line linear extrapolation; c) Gibbs energy of fusion of FI and FII together with enthalpic and entropic contributions, as functions of temperature, determined from DSC data; d) Gibbs energy of transformation (FII → FI) together with enthalpic and entropic contributions, as functions of temperature, determined from DSC data. | ||
Having access to melting data as well as heat capacities of both the solids and the supercooled melt allows estimation of the Gibbs energy, enthalpy and entropy of fusion as functions of temperature of the polymorphs.18 If the heat capacity curves are linear functions of temperature, and assuming the linear behavior can be extrapolated over the entire temperature range of interest, the difference in heat capacity between the melt and the respective solid form can be approximated by the function:
| ΔCp = Cp,L − Cp,S = q + r(Tm − T) | (2) |
| ΔfusG(T) = ΔfusH(T) − TΔfusS(T) | (3) |
 | (4) |
 | (5) |
For FI, the coefficients of eqn (2) obtained using linear regression are: q = 135.3 J mol−1 K−1, r = 0.7109 J mol−1 K−2, and for FII: q = 138.8 J mol−1 K−1, r = 0.6997 J mol−1 K−2. The resulting functions of fusion of the two polymorphs are shown in Fig. 9c, from 280 K up to melting. The similarity in the values of both enthalpy of fusion as well as heat capacity of the two polymorphs results in rather similar development of the respective Gibbs energy curves with temperature, and there is no transition in stability over the evaluated temperature range. Fig. 9d shows how the estimated Gibbs energy of transformation from FII into FI depends on temperature, together with its enthalpic and entropic components. The Gibbs energy of transformation approaches zero with decreasing temperature, but is not projected to cross the x-axis anywhere close to the experimental temperature range. For this reason, and because there is a significant amount of uncertainty associated with extrapolating data outside experimental limits, the conclusion is that the relationship is likely monotropic.
The thermodynamic stability relationship at room temperature was verified by a slurry conversion experiment. A suspension of equal amounts of FI and FII in acetone was prepared in a capped bottle equipped with a magnetic stir bar, and kept at 25 °C under agitation. After 5 days, a sample of the solids was collected and analysed with IR spectroscopy. The IR spectrum showed that all FII had converted into FI, confirming the stability order obtained using DSC data.
Conclusions
A new compound, 1-(2,2,3-trimethyl-1,3-oxazolidin-5-yl)-butane-1,2,3,4-tetrol, has been discovered. The compound is synthesized from meglumine in acetone solution through a reductive alkylation reaction. The molecule is chiral with four stereo centers. The crystal structures of two polymorphs have been solved, both belonging to the orthorhombic, chiral P212121 space group, with one molecule in the asymmetric unit. In both structures the molecules are arranged in a three dimensional interlocked pattern, stabilized in two dimensions by strong O–H⋯O interactions. The thermodynamic stability relationship between the polymorphs is most likely monotropic. FI is the thermodynamically stable form at room temperature, as confirmed with a slurry conversion experiment, and has the highest melting point, 410.4 (±0.10) K with an enthalpy of fusion of 48.2 (±0.24) kJ mol−1. FII melts at 395.3 (±0.21) K with an enthalpy of fusion of 48.0 (±0.59) kJ mol−1. The Gibbs energy, enthalpy and entropy of fusion of both polymorphs have been estimated as functions of temperature through analysis of calorimetric data.Conflicts of interest
There are no conflicts of interest to declare.Acknowledgements
This work is partly supported by the Swedish Research Council (Grant Number 2015-5240) and partly by the Synthesis and Solid State Pharmaceutical Centre (SSPC), financed by a research grant from Science Foundation Ireland (SFI), co-funded under the European Regional Development Fund (Grant Number 12/RC/2275).References
-
H.-H. Tung, E. L. Paul, M. Midler and J. A. McCauley, Crystallization of organic compounds : an industrial perspective, John Wiley & Sons, Hoboken, NJ, USA, 2009 Search PubMed
.
- A. J. Cruz-Cabeza, S. M. Reutzel-Edens and J. Bernstein, Chem. Soc. Rev., 2015, 44, 8619 RSC
- P. Vure, International Journal of Intellectual Property Management, 2011, 4, 297 CrossRef
-
J. Bernstein, in Polymorphism: in the pharmaceutical industry, ed. R. Hilfiker, John Wiley & Sons, Weinheim, Germany, 2006, ch. 14, p. 365 Search PubMed
-
D. J. W. Grant, in Polymorphism in pharmaceutical solids, ed. H. G. Brittain, Marcel Dekker, New York, NY, USA, 1999, ch. 1, p. 1 Search PubMed
-
J. Bernstein, Polymorphism in molecular crystals, Oxford University Press, Oxford, 2002 Search PubMed
- J. M. Miller, B. M. Collman, L. R. Greene, D. J. W. Grant and A. C. Blackburn, Pharm. Dev. Technol., 2005, 10, 291 CAS
- C.-H. Gu, V. Young and D. J. W. Grant, J. Pharm. Sci., 2001, 90, 1878 CrossRef CAS PubMed
- W. Beckmann, R. Boistelle and K. Sato, J. Chem. Eng. Data, 1984, 29, 211 CrossRef CAS
- R. Ragusa, C. A. Di, P. Samperi and G. Schiliro, Am. J. Dis. Child., 1993, 147, 611 CAS
-
A. V. Bruker, APEX2, Bruker AXS Inc., Madison, WI, USA, 2008 Search PubMed
-
G. M. Sheldrick, SHELXS-97, Universität Görringen, Germany, 1997 Search PubMed
- S. Parsons, H. D. Flack and T. Wagner, Acta Crystallogr., Sect. B: Struct. Sci., Cryst. Eng. Mater., 2013, 69, 249 CAS
- L. J. Barbour, J. Supramol. Chem., 2001, 1, 189 CrossRef CAS
- M. C. Etter, J. C. MacDonald and J. Bernstein, Acta Crystallogr., Sect. B: Struct. Sci., 1990, 46, 256 CrossRef
- M. A. Spackman and D. Jayatilaka, CrystEngComm, 2009, 11, 19 RSC
-
M. J. Turner, J. J. McKinnon, S. K. Wolff, D. J. Grimwood, P. R. Spackman, D. Jayatilaka and M. A. Spackman, CrystalExplorer17, University of Western Australia, Australia, 2017 Search PubMed
- M. Svärd, M. Valavi, D. Khamar, M. Kuhs and Å. C. Rasmuson, J. Pharm. Sci., 2016, 105, 1901 CrossRef PubMed
Footnote |
| † Electronic supplementary information (ESI) available: Crystallographic torsion angles and experimental heat capacity values of FI and FII, NMR spectra, LC-MS spectrum. CCDC 1556517, 1556518 and 1579804. For ESI and crystallographic data in CIF or other electronic format see DOI: 10.1039/c7ce01135k |
| This journal is © The Royal Society of Chemistry 2018 |