Fe–N co-decorated hierarchically porous graphene as a highly efficient electrocatalyst for the oxygen reduction reaction†
Jianyu
Cao
 a,
Xiaodi
Jia
a,
Mengwei
Guo
a,
Yingying
Du
a,
Juan
Xu
*a and
Zhidong
Chen
a,
Xiaodi
Jia
a,
Mengwei
Guo
a,
Yingying
Du
a,
Juan
Xu
*a and
Zhidong
Chen
 *ab
*ab
aJiangsu Key Laboratory of Advanced Catalytic Materials and Technology, School of Petrochemical Engineering, Changzhou University, Changzhou 213164, China. E-mail: cjytion@cczu.edu.cn; zdchen.lab@hotmail.com
bJiangsu Key Laboratory of Materials Surface Science and Technology, Jiangsu Collaborative Innovation Centre of Photovoltaic Science and Engineering, School of Materials Science and Engineering, Changzhou University, Changzhou 213164, China
First published on 24th October 2017
Abstract
Fe–N co-decorated hierarchically porous graphene (FeN/G) was prepared by a facile one-step pyrolysis method. In the pyrolysis synthesis process, dicyandiamide was introduced as a nitrogen precursor and sacrificial templating agent, together with ferric nitrate utilized as an iron precursor, to aid in the formation of graphene nanosheets and their self-assembly into an interconnected porous framework. Consequently, the resultant FeN/G framework shows a relatively large specific surface area (401.1 m2 g−1), hierarchically porous structure and abundant meso-/macropores. Such highly desired FeNC structures not only possess sufficient catalytically active sites for the oxygen reduction reaction (ORR) but also guarantee fast transfer of reactants and ions, which provides excellent catalytic activity with positive onset and half-wave potentials, large kinetic-limiting current density, and remarkable durability that is obviously better than the commercial Pt/C in alkaline medium.
Introduction
The polymer electrolyte fuel cell (PEFC) has emerged as one of the promising renewable and sustainable power sources for mobile and stationary applications in the future.1 However, the practical application of the PEFC is greatly dependent on the advancement of the cathodic catalysts, due to the slow intrinsic electrode kinetics of the oxygen reduction reaction (ORR).2,3 Until now, platinum has still been the best catalytic material for ORR in the PEFC application,4–6 despite suffering from some drawbacks such as susceptibility to time-dependent drift, poor tolerance to methanol crossover and CO poisoning effects. A number of attractive routes, including alloying with transition metals,7,8 controllably forming core–shell M–Pt nanostructures with a thin Pt skin layer9,10 to exploit the beneficial synergistic effect produced by the interactions between hetero-metals, and employing unique supports to uniformly disperse Pt nanoparticles,11,12 were proposed to increase the specific mass activity and reduce the Pt loading. However, in the long term, if expensive platinum-based catalysts cannot be substituted by other efficient, inexpensive, and durable catalytic materials, the commercial application of PEFCs will be difficult to achieve. Thus, intensive efforts have recently been focused on developing low-cost nonprecious metal catalysts13–17 as alternatives to platinum-based catalysts, to realize efficient ORR.As a two-dimensional sp2-hybridised carbon, graphene has offered great promise in energy storage and conversion due to its unique structure and properties. Unfortunately, pristine graphene exhibits extremely poor ORR activity although it has abundant free π electrons, because these inert π electrons cannot catalyze ORR directly. Recently, many researchers have revealed that introduction of heteroatoms (such as N,17 B,18 S,19 Fe,20 and Co21) or a combination of those22 into graphene nanostructures may induce uneven charge distribution in the adjacent sites23 or activate carbon π electrons24 to promote adsorption and activation of molecular oxygen, thus converting graphene into an efficient ORR catalyst. Among various heteroatom-modifications involved in graphenes, Fe and N co-doping is generally regarded as one of the most promising candidates owing to the excellent catalytic activity, high durability, and abundance of the elements in the earth. Although great progress20,24–27 has been made, the ORR activity of this kind of materials is not yet competitive to that of the state-of-the-art Pt/C. Furthermore, there are still two urgent issues that should be clarified in order to break the bottleneck of Fe–N co-decorated graphene for ORR. First, the catalytically active species of Fe–N co-decorated graphene still remains elusive. Various FeNC structures (e.g. pyridinic N–Fe macrocycles25 and FeN4C12 moieties26) have been reported to serve as the active center while Fe–C species have also been suggested to enhance the ORR activity.27 Therefore, the active configuration and its catalytic mechanism need to be further clarified. Second, owing to the limitation of the preparation method, graphene usually undergoes restacking and agglomeration driven by interlayer van der Waals force or π–π conjugation,28 resulting in a dramatic decreased surface area. Accordingly, active sites of Fe–N co-decorated graphene obtained by conventional methods (i.e., Hummers methods etc.29) cannot be entirely exposed to the electrolyte, leading to its poor activity. Synthesizing porous graphene by a template-assisted method has been deemed an effective strategy to hinder restacking and agglomeration of graphene nanosheets. Very recently, we have prepared mesoporous graphene via a sacrificial template assisted pyrolysis approach.30 Since restacking and agglomeration were prevented effectively, the mesoporous graphene exhibited much larger mesopore surface area and pore volume, compared with the conventional reduced graphene oxide (RGO). Herein, we developed a sacrificial template assisted one-step synthesis approach to fabricate Fe–N co-decorated graphenes (FeN/Gs). When utilized as a nonprecious metal-free electrocatalyst, the FeN/G catalyst demonstrated excellent ORR activity and durability, even superior to that of the commercial Pt/C catalyst.
Experimental
Materials
Ferric nitrate nonahydrate, resorcinol, and dicyandiamide were purchased from Sigma-Aldrich. All chemicals were analytical reagents and used as received without further purification.Synthetic procedure
In a typical preparation procedure, 0.05 g of ferric nitrate, 0.12 g of resorcinol, and 4 g of dicyandiamide were mixed and then dissolved ultrasonically in ultrapure water. After water was removed by freeze drying, yellow powdered residues were obtained and acted as precursors for FeN/Gs. Finally, a series of FeN/Gs were obtained by heating the precursors to desired temperatures (800–1100 °C) under flowing nitrogen and holding them at that temperature for 1 h. During the pyrolysis, precursors were heated at a ramp rate of 2 °C min−1 from ambient temperature to 600 °C. After 600 °C, the ramp rate increased from 2 to 3.3 °C min−1. In order to facilitate the comparison, the FeN/G samples synthesized under pyrolysis temperatures of 800, 900, 1000 and 1100 °C are denoted as FeN/G-800, FeN/G-900, FeN/G-1000 and FeN/G-1100, respectively.Characterization and measurement
X-ray powder diffraction (XRD) measurements for FeN/Gs were carried out using a Rigaku D/max-2500 diffractometer with Cu Kα radiation (λ = 0.1542 nm). Diffraction patterns were collected at a scanning rate of 2° min−1 and with a step of 0.02°. The morphology of FeN/Gs was observed by field emission scanning electron microscopy (FESEM, Supra 55, Carl Zeiss) and transmission electron microscopy (TEM, JEM-2100, JEOL). Nitrogen adsorption–desorption isotherms were measured at 77 K using an ASAP 2010 surface area analyzer (Micromeritics Instrument Co.). Before measurements, the samples were degassed in vacuum at 120 °C for at least 6 h. Specific surface area was determined using the Brunauer–Emmett–Teller (BET) method while pore volume was obtained by the single point method. Pore size distribution (PSD) curves were obtained according to the Barrett–Joyner–Halenda (BJH) model and the peak position of the PSD was used as the average pore diameter. Evaluation of the electronic structure and surface composition was conducted with X-ray photoelectron spectroscopy (XPS, Escalab 250, Thermo Scientific) using Al Kα radiation. Collected data were corrected for charge shifting using the standard C 1s binding energy of 284.5 eV. The Raman spectrum was collected using a DXR Raman microscope (Thermo Scientific) under a 514 nm excitation.Electrochemical measurements including cyclic voltammetry (CV), chronoamperometry, and rotating disk electrode (RDE) studies were conducted on a CHI 660B potentiostat (CH Instruments Inc.) at 25 ± 1 °C. A catalyst-modified glassy carbon RDE (0.1963 cm2) was used as the working electrode, which was prepared as follows. First, 8 mg of FeN/Gs (or Pt/C) was dispersed into a mixture composed of 5 wt% Nafion solution (0.3 mL), isopropanol (1.0 mL), and ultrapure water (1.0 mL) by sonication to form a homogeneous dispersion. Then, 8 μL of this dispersion was transferred onto the surface of a freshly polished glassy carbon RDE, and left to dry overnight to serve as the working electrode. The loading of FeN/Gs was ca. 141.8 μg cm−2 while the Pt loading for Pt/C was ca. 28.4 μg cm−2. The saturated calomel electrode (SCE) was used as a reference and a platinum foil served as the counter electrode. The ORR measurements were examined by the RDE method in 0.1 M KOH solution saturated with O2, employing a PAR Model 616 rotator to control the rotation speed of the working electrode. All the potentials reported herein were calibrated with respect to the reversible hydrogen electrode (RHE) according to the Nernst equation.
Results and discussion
Fig. 1 presents the structure and morphology of the FeN/G samples obtained at a pyrolysis temperature of 900 °C (FeN/G-900). The XRD pattern (shown in Fig. 1a) confirms the formation of iron nitride (Fe3N, JCPDS no. 49-1663), metallic iron (JCPDS no. 06-0696), and magnetite (Fe3O4, JCPDS no. 65-3107) in FeN/G-900. A broad diffraction peak at approximately 26° corresponds to the (002) reflection from the graphene plane, revealing a low graphitization degree and the presence of abundant defects and residual functional groups. The morphology of FeN/G-900 was examined by FESEM and TEM observations. The FESEM image (Fig. 1b) clearly reveals interconnected, three-dimensional (3D) nanoporous architecture with continuous pores throughout the sample. The size of the pores ranges from tens of nanometers up to and exceeding one hundred nanometers. The results of the morphological studies indicate that porous structures are created successfully within the FeN/G-900 by a facile one-step pyrolysis strategy employing dicyandiamide as a sacrificial template. The TEM image (Fig. 1c) of FeN/G-900 further demonstrates that a lot of nanoparticles (with sizes of 6–30 nm) are attached uniformly on crumpled graphene nanosheets. The average diameter of these nanoparticles is about 14.9 nm, with a relatively broad distribution of particle sizes (Fig. 1d). The nitrogen adsorption–desorption isotherm (presented in Fig. 2) was measured to further analyze the porosity of FeN/G-900. The isotherm of FeN/G-900 shows a significant hysteresis loop at high pressure (P/P0 > 0.7), which is attributed to the presence of the predominant meso/macropores. In addition, at the low relative pressure part (P/P0 < 0.05), a slight increase in nitrogen adsorption amount was observed, suggesting the existence of a few micropores. The pore size distribution plot (Fig. 2b) obtained from the desorption branch of the nitrogen adsorption–desorption isotherm curve of FeN/G-900 suggests a wide pore size distribution with three distinct peaks at 2.3, 3.6 and 15.0 nm. Textural properties of FeN/G-900 are listed in Table 1, exhibiting a specific surface area of 401.1 m2 g−1 and a total pore volume of 0.97 cm3 g−1, together with distinctive mesoporous features (Fig. 2b).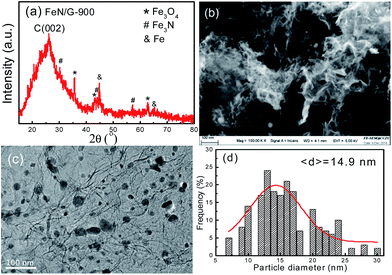 | ||
| Fig. 1 Structure and morphology of the FeN/G-900 catalyst. (a) XRD pattern, (b) FESEM image, (c) TEM image, (d) particle size distribution histogram. | ||
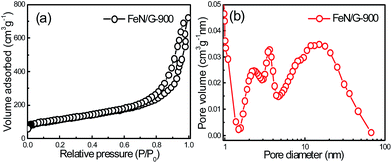 | ||
| Fig. 2 N2 adsorption–desorption isotherm (a) and BJH pore size distribution (b) of the FeN/G-900 catalyst. | ||
| Sample | S BET (m2 g−1) | V pore (cm3 g−1) | V meso (cm3 g−1) | d BJH (nm) |
|---|---|---|---|---|
| FeN/G-900 | 401.1 | 0.97 | 0.92 | 9.64 |
The XPS survey spectrum of FeN/G-900 is shown in Fig. 3a. The XPS peaks for C, N, O and Fe are obviously observed, revealing that the Fe/N species are successfully anchored on the carbon surface. The elemental contents in FeN/G-900 are calculated from the corresponding peak areas and relative sensitivity factors to be 76.72 at% carbon, 7.94 at% nitrogen, 12.99 at% oxygen and 2.35 at% iron. The high resolution C 1s spectrum (Fig. 3b) of FeN/G-900 shows a major peak at 284.5 eV (C1), corresponding to sp2-hybridized graphitic carbon atoms and relatively small signals at higher binding energy indicating some C–C/C![[double bond, length as m-dash]](https://www.rsc.org/images/entities/char_e001.gif) N (C2, 285.3 eV), C–O/C–N (C3, 286.2 eV), C
N (C2, 285.3 eV), C–O/C–N (C3, 286.2 eV), C![[double bond, length as m-dash]](https://www.rsc.org/images/entities/char_e001.gif) O (C4, 287.2 eV) and O–C
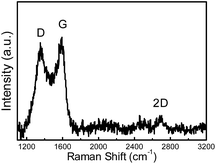
O (C4, 287.2 eV) and O–C![[double bond, length as m-dash]](https://www.rsc.org/images/entities/char_e001.gif) O (C5, 288.8 eV) species remaining in the sample.31,32 To verify the nitrogen states in FeN/G-900, XPS measurements were performed from 394 to 408 eV. The deconvoluted N 1s spectrum of FeN/G-900 is shown in Fig. 3c, revealing six nitrogen species peaked at 397.9, 398.7, 399.7, 400.8, 401.6 and 402.9 eV, which are assigned to imine or cyano nitrogen (N1), pyridinic nitrogen (N2), Nx–Fe (N3), pyrrolic nitrogen (N4), graphitic nitrogen (N5), and oxidized nitrogen (N6), respectively.33–35 By comparing density functional theory (DFT) calculations and experimental results of binding energy shifts of Nx–Fe moieties in the N 1s spectra of Fe–N–C catalysts, Artyushkova et al. in their recent studies indicated that the peak at ca. 399.8 eV could be identified as Fe–N4 moieties.33,34 They further revealed that the binding energy shifts of Fe–N2 and Fe–N3 were less than that for Fe–N4 due to a smaller shift of electron density from N to Fe in disordered coordination versus the mesomeric Fe–N4 where larger reduction of electron density on the N atom results in a more positive binding energy.34 The relative contents of pyridinic N, Nx–Fe, pyrrolic N and graphitic N in the total nitrogen species are 24.6, 14.6, 24.0 and 10.7 at%, respectively. FeN/G-900 exhibits a high content of Nx–Fe species (14.6 at% in the total doped nitrogen) likely responsible for its superior ORR activity as will be discussed later. Fig. 3d presents the Fe 2p spectrum of FeN/G-900. The peaks at 707.2, 708.7, 710.3, 711.4 and 713.3 eV can be assigned to the binding energies of the 2p3/2 orbitals of metallic Fe, Fe–Nx, FeO, Fe3O4 and FeOOH, respectively.33,36 The presence of Fe–Nx species is confirmed by both N 1s and Fe 2p spectra. The Raman spectrum of FeN/G-900 displays two remarkable peaks at around 1350 and 1591 cm−1 (Fig. 4) corresponding to the D band and G band, respectively. The intensity ratio of the two bands (ID/IG) for FeN/G-900 is calculated to be ∼2.15, much higher than those of NGs (0.97–1.43) obtained by a similar pyrolysis approach,30,37 suggesting the existence of abundant surface defects. The weak 2D peak at around 2692 cm−1 reveals that FeN/G-900 is composed of multilayered graphene architecture.38
O (C5, 288.8 eV) species remaining in the sample.31,32 To verify the nitrogen states in FeN/G-900, XPS measurements were performed from 394 to 408 eV. The deconvoluted N 1s spectrum of FeN/G-900 is shown in Fig. 3c, revealing six nitrogen species peaked at 397.9, 398.7, 399.7, 400.8, 401.6 and 402.9 eV, which are assigned to imine or cyano nitrogen (N1), pyridinic nitrogen (N2), Nx–Fe (N3), pyrrolic nitrogen (N4), graphitic nitrogen (N5), and oxidized nitrogen (N6), respectively.33–35 By comparing density functional theory (DFT) calculations and experimental results of binding energy shifts of Nx–Fe moieties in the N 1s spectra of Fe–N–C catalysts, Artyushkova et al. in their recent studies indicated that the peak at ca. 399.8 eV could be identified as Fe–N4 moieties.33,34 They further revealed that the binding energy shifts of Fe–N2 and Fe–N3 were less than that for Fe–N4 due to a smaller shift of electron density from N to Fe in disordered coordination versus the mesomeric Fe–N4 where larger reduction of electron density on the N atom results in a more positive binding energy.34 The relative contents of pyridinic N, Nx–Fe, pyrrolic N and graphitic N in the total nitrogen species are 24.6, 14.6, 24.0 and 10.7 at%, respectively. FeN/G-900 exhibits a high content of Nx–Fe species (14.6 at% in the total doped nitrogen) likely responsible for its superior ORR activity as will be discussed later. Fig. 3d presents the Fe 2p spectrum of FeN/G-900. The peaks at 707.2, 708.7, 710.3, 711.4 and 713.3 eV can be assigned to the binding energies of the 2p3/2 orbitals of metallic Fe, Fe–Nx, FeO, Fe3O4 and FeOOH, respectively.33,36 The presence of Fe–Nx species is confirmed by both N 1s and Fe 2p spectra. The Raman spectrum of FeN/G-900 displays two remarkable peaks at around 1350 and 1591 cm−1 (Fig. 4) corresponding to the D band and G band, respectively. The intensity ratio of the two bands (ID/IG) for FeN/G-900 is calculated to be ∼2.15, much higher than those of NGs (0.97–1.43) obtained by a similar pyrolysis approach,30,37 suggesting the existence of abundant surface defects. The weak 2D peak at around 2692 cm−1 reveals that FeN/G-900 is composed of multilayered graphene architecture.38
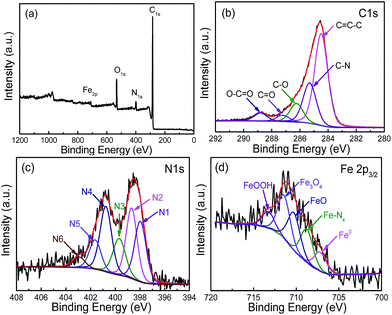 | ||
| Fig. 3 XPS survey spectrum (a) of FeN/G-900, with the high resolution C 1s (b), N 1s (c), and Fe 2p (d) spectra. | ||
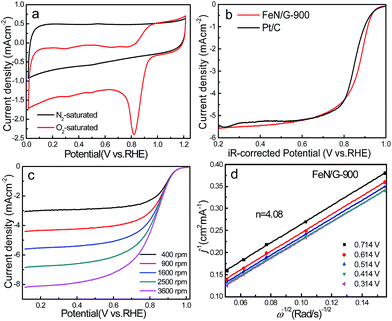
The ORR catalytic properties of FeN/G-900 were first examined by CV in 0.1 M KOH solution saturated with N2 or O2. It can be observed from the CV curves of the FeN/G-900 electrode (Fig. 5a) that a distinct cathodic current peak appears at the potential of ∼0.82 V when the solution is saturated with O2, indicating pronounced catalytic activity toward ORR, whereas in the N2-saturated electrolyte a large capacitive and featureless current response that resulted from the large specific surface area of FeN/G-900 is observed within the potential range of 0 to 1.2 V. The ORR onset potential for FeN/G-900 is ca. 0.98 V, determined by overlapping the CV curves obtained in O2-saturated and N2-saturated 0.1 M KOH solution. Fig. 5b compares the ORR activities of FeN/G-900 and the commercial Pt/C catalyst obtained by LSV testing at 1600 rpm rotation rate. Compared with the commercial Pt/C catalyst, the FeN/G-900 electrode is significantly more active in terms of lower overpotential and larger current density in the kinetic-diffusion control region. Moreover, the half-wave potential (E1/2) for FeN/G-900 is calculated to be ca. 0.873 V, obviously higher than that of commercial Pt/C (0.851 V), demonstrating its superior electrocatalytic activity toward ORR. To gain further insight into the role of the FeN/G-900 electrode during the ORR process, the reaction kinetics was investigated by RDE voltammetry technology (Fig. 5c). The voltammetric profiles show that the current density increases with increase in the rotating rate. The corresponding Koutecký–Levich plots at various potentials (Fig. 5d) reveal a distinctly parallel feature with good linearity at different potentials, generally considered as an indication of first-order reaction kinetics with respect to the concentration of dissolved oxygen.39 The electron transfer number (n) is determined from the slopes of Koutecký–Levich plots at different potentials. The average n value is calculated to be 4.08, suggesting a four-electron transfer in the oxygen reduction process catalyzed by FeN/G-900. Given that catalytic durability is a major concern in fuel cell applications, FeN/G-900 was further subjected to evaluation of the durability toward ORR by chronoamperometric measurements at 0.715 V in O2-saturated 0.1 M KOH aqueous solution. As shown in Fig. 6, after 20![[thin space (1/6-em)]](https://www.rsc.org/images/entities/char_2009.gif) 000 s, FeN/G-900 lost 11.2% of its initial activity compared with 11.5% of Pt/C, which means better durability of the FeN/G-900 catalyst than commercial Pt/C. All these results clearly indicate that FeN/G-900 is a promising noble-metal-free ORR catalyst with excellent activity and durability, which can be a feasible alternative to Pt. These results highlight the superior ORR performance of FeN/G-900, probably due to the following synergetic effects: (1) high concentrations of Fe–Nx species confirmed by XPS N 1s results in Fig. 3c, generally considered to be catalytically active sites for ORR and capable of facilitating the adsorption and dissociation of O2, and (2) the 3D nanoporous frame and relatively high specific surface area, which allows facile mass transfer.
000 s, FeN/G-900 lost 11.2% of its initial activity compared with 11.5% of Pt/C, which means better durability of the FeN/G-900 catalyst than commercial Pt/C. All these results clearly indicate that FeN/G-900 is a promising noble-metal-free ORR catalyst with excellent activity and durability, which can be a feasible alternative to Pt. These results highlight the superior ORR performance of FeN/G-900, probably due to the following synergetic effects: (1) high concentrations of Fe–Nx species confirmed by XPS N 1s results in Fig. 3c, generally considered to be catalytically active sites for ORR and capable of facilitating the adsorption and dissociation of O2, and (2) the 3D nanoporous frame and relatively high specific surface area, which allows facile mass transfer.
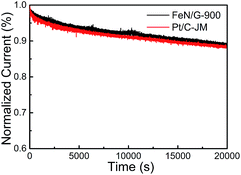 | ||
| Fig. 6 Current–time chronoamperometric response of FeN/G-900 and commercial Pt/C catalysts at 0.715 V in O2 saturated 0.1 M KOH solution at a rotation rate of 1600 rpm. | ||
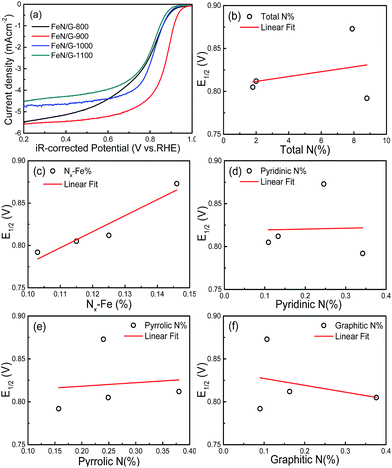
Fig. 7a shows the ORR polarization curves of the FeN/G catalysts obtained at four different pyrolysis temperatures. The potentials of these FeN/G electrodes were corrected for the solution resistance (Rs). The FeN/Gs obtained at 900 °C show a much more positive E1/2 value and larger diffusion current density for ORR than those prepared at other pyrolysis temperatures. As indicated by numerous reports published in the literature,26,37,39 Fe–Nx, pyridinic N, pyrrolic N and graphitic N are possible catalytically active species for FeNC and/or metal-free N–C electrocatalysts. Therefore, the in-depth correlation between surface chemistry (XPS data) and electrocatalytic activity (E1/2) was studied. Fig. 7b–f present the plots of the relationship between E1/2 and the amount of total nitrogen, Nx–Fe, pyridinic N, pyrrolic N and graphitic N detected for the four FeN/G catalysts obtained at different pyrolysis temperatures. As shown in Fig. 7c, with an increase of the amount of Fe–Nx, a higher E1/2 value of ORR is observed. Furthermore, there is a relatively credible linear correlation between the amount of Nx–Fe species and ORR activity, in agreement with previously published data.33,35 The best performing sample has the largest amount of Fe–Nx centers (Fig. S1, ESI†). In addition, Fig. 7b reveals that the amount of total nitrogen does not correlate with the ORR activity. We also do not observe the presence of a clear correlation between the amount of pyridinic N, pyrrolic N and graphitic N and the ORR activity (Fig. 7d–f). These results reveal that Fe–Nx moieties are the only observable active centers for the FeN/Gs.
Conclusions
In summary, a Fe–N co-decorated graphene was achieved via a facile one-step pyrolysis approach. The XPS quantitative analysis reveals that Fe–Nx moieties are the only observable active sites. The resulting Fe–N graphene framework possesses a relatively large specific surface area and hierarchically porous skeleton, as well as rich catalytically active sites, which can not only accelerate interfacial catalysis kinetics of ORR but also facilitate the mass transport to enhance the ORR performance. On the basis of the characteristics described above, the Fe–N/Gs obtained at the pyrolysis temperature of 900 °C exhibit high ORR activity (E1/2 = 0.873 V), high electron transfer selectivity (n = ∼4), and excellent durability in alkaline solution. The outstanding electrocatalytic performance makes the Fe–N/G a promising nonplatinum ORR catalyst for PEFCs.Conflicts of interest
There are no conflicts to declare.Acknowledgements
We thank the National Natural Science Foundation of China (21573025, 21773018 and 51574047), Natural Science Foundation of Jiangsu Province (BK20151183), Natural Science Foundation of the Jiangsu Higher Education Institutions of China (17KJA150001), and Foundation of Jiangsu Key Laboratory of Advanced Catalytic Materials and Technology (BM2012110) for support of this work.Notes and references
- M.-R. Gao, Y.-F. Xu, J. Jiang and S.-H. Yu, Chem. Soc. Rev., 2013, 42, 2986–3017 RSC.
- Y. Jiang, Y. Lu, X. Lv, D. Han, Q. Zhang, L. Niu and W. Chen, ACS Catal., 2013, 3, 1263–1271 CrossRef CAS.
- Y. Zheng, Y. Jiao, J. Chen, J. Liu, J. Liang, A. Du, W. Zhang, Z. Zhu, S. C. Smith, M. Jaroniec, G. Q. Lu and S. Z. Qiao, J. Am. Chem. Soc., 2011, 133, 20116–20119 CrossRef CAS PubMed.
- L. Qu, Y. Liu, J.-B. Baek and L. Dai, ACS Nano, 2010, 4, 1321–1326 CrossRef CAS PubMed.
- L. Zhang, Z. Su, F. Jiang, L. Yang, J. Qian, Y. Zhou, W. Li and M. Hong, Nanoscale, 2014, 6, 6590–6602 RSC.
- M.-R. Gao, J. Jiang and S.-H. Yu, Small, 2012, 8, 13–27 CrossRef CAS PubMed.
- V. R. Stamenkovic, B. Fowler, B. S. Mun, G. Wang, P. N. Ross, C. A. Lucas and N. M. Markovic, Science, 2007, 315, 493–497 CrossRef CAS PubMed.
- S.-I. Choi, S. Xie, M. Shao, J. H. Odell, N. Lu, H.-C. Peng, L. Protsailo, S. Guerrero, J. Park, X. Xia, J. Wang, M. J. Kim and Y. Xia, Nano Lett., 2013, 13, 3420–3425 CrossRef CAS PubMed.
- D. Wang, H. L. Xin, R. Hovden, H. Wang, Y. Yu, D. A. Muller, F. J. DiSalvo and H. D. Abruna, Nat. Mater., 2013, 12, 81–87 CrossRef CAS PubMed.
- K. A. Kuttiyiel, K. Sasaki, Y. M. Choi, D. Su, P. Liu and R. R. Adzic, Energy Environ. Sci., 2012, 5, 5297–5304 CAS.
- J. Kim, S. W. Lee, C. Carlton and Y. Shao-Horn, J. Phys. Chem. Lett., 2011, 2, 1332–1336 CrossRef CAS PubMed.
- Y. Li, Y. Li, E. Zhu, T. McLouth, C.-Y. Chiu, X. Huang and Y. Huang, J. Am. Chem. Soc., 2012, 134, 12326–12329 CrossRef CAS PubMed.
- M.-R. Gao, Y.-R. Zheng, J. Jiang and S.-H. Yu, Acc. Chem. Res., 2017, 50, 2194–2204 CrossRef CAS PubMed.
- S. Wang, D. Yu and L. Dai, J. Am. Chem. Soc., 2011, 133, 5182–5185 CrossRef CAS PubMed.
- Y. Li, W. Zhou, H. Wang, L. Xie, Y. Liang, F. Wei, J.-C. Idrobo, S. J. Pennycook and H. Dai, Nat. Nanotechnol., 2012, 7, 394–400 CrossRef CAS PubMed.
- Q. Li, S. Zhang, L. Dai and L. Li, J. Am. Chem. Soc., 2012, 134, 18932–18935 CrossRef CAS PubMed.
- B. Bayatsarmadi, Y. Zheng, M. Jaroniec and S. Z. Qiao, Chem.–Asian J., 2015, 10, 1546–1553 CrossRef CAS PubMed.
- Z.-H. Sheng, H.-L. Gao, W.-J. Bao, F.-B. Wang and X.-H. Xia, J. Mater. Chem., 2012, 22, 390–395 RSC.
- Z. Ma, S. Dou, A. Shen, L. Tao, L. Dai and S. Wang, Angew. Chem., Int. Ed., 2014, 53, 1–6 CrossRef.
- K. Kamiya, K. Hashimoto and S. Nakanishi, Chem. Commun., 2012, 48, 10213–10215 RSC.
- S. Guo, S. Zhang, L. Wu and S. Sun, Angew. Chem., Int. Ed., 2012, 124, 11940–11943 CrossRef.
- H. Yin, C. Zhang, F. Liu and Y. Hou, Adv. Funct. Mater., 2014, 24, 2930–2937 CrossRef CAS.
- S. Wang, L. Zhang, Z. Xia, A. Roy, D. W. Chang, J.-B. Baek and L. Dai, Angew. Chem., Int. Ed., 2012, 51, 4209–4212 CrossRef CAS PubMed.
- Y. Qin, J. Yuan, L. Zhang, B. Zhao, Y. Liu, Y. Kong, J. Cao, F. Chu, Y. Tao and M. Liu, Small, 2016, 12, 2549–2553 CrossRef CAS PubMed.
- M. Lefèvre, E. Proietti, F. Jaouen and J.-P. Dodelet, Science, 2009, 324, 71–74 CrossRef PubMed.
- A. Zitolo, V. Goellner, V. Armel, M.-T. Sougrati, T. Mineva, L. Stievano, E. Fonda and F. Jaouen, Nat. Mater., 2015, 14, 937–942 CrossRef CAS PubMed.
- Y. Hu, J. O. Jensen, W. Zhang, S. Martin, R. Chenitz, C. Pan, W. Xing, N. J. Bjerrum and Q. Li, J. Mater. Chem. A, 2015, 3, 1752–1760 CAS.
- J. Liu, J. Tang and J. J. Gooding, J. Mater. Chem., 2012, 22, 12435–12452 RSC.
- S. Li, Y. Hu, Q. Xu, J. Sun, B. Hou and Y. Zhang, J. Power Sources, 2012, 213, 265–269 CrossRef CAS.
- J. Cao, H. Zhuang, M. Guo, H. Wang, J. Xu and Z. Chen, J. Mater. Chem. A, 2014, 2, 19914–19919 CAS.
- V. Datsyuk, M. Kalyva, K. Papagelis, J. Parthenios, D. Tasis, A. Siokou, I. Kallitsis and C. Galiotis, Carbon, 2008, 46, 833–840 CrossRef CAS.
- A. L. M. Reddy, A. Srivastava, S. R. Gowda, H. Gullapalli, M. Dubey and P. M. Ajayan, ACS Nano, 2010, 4, 6337–6342 CrossRef CAS PubMed.
- K. Artyushkova, B. Kiefer, B. Halevi, A. Knop-Gericke, R. Schlogl and P. Atanassov, Chem. Commun., 2013, 49, 2539–2541 RSC.
- K. Artyushkova, A. Serov, S. Rojas-Carbonell and P. Atanassov, J. Phys. Chem. C, 2015, 119, 25917–25928 CAS.
- J. Li, S. Ghoshal, W. Liang, M.-T. Sougrati, F. Jaouen, B. Halevi, S. McKinney, G. McCool, C. Ma, X. Yuan, Z.-F. Ma, S. Mukerjee and Q. Jia, Energy Environ. Sci., 2016, 9, 2418–2432 CAS.
- W. Temesghen and P. M. A. Sherwood, Anal. Bioanal. Chem., 2002, 373, 601–608 CrossRef CAS PubMed.
- J. Cao, Y. Hu, L. Chen, J. Xu and Z. Chen, Int. J. Hydrogen Energy, 2017, 42, 2931–2942 CrossRef CAS.
- C. Yang, Y. Xu, C. Zhang, Z. Sun, C. Chen, X. Li, S. Jiang and B. Man, Nanoscale Res. Lett., 2014, 9, 394–399 CrossRef PubMed.
- M. Liu, Y. Song, S. He, W. W. Tjiu, J. Pan, Y.-Y. Xia and T. Liu, ACS Appl. Mater. Interfaces, 2014, 6, 4214–4222 CAS.
Footnote |
| † Electronic supplementary information (ESI) available. See DOI: 10.1039/c7se00458c |
| This journal is © The Royal Society of Chemistry 2018 |

