A broad parameter range for selective methane production with bicarbonate solution in electrochemical CO2 reduction†
Hiroshi
Hashiba
*ab,
Hiroki K.
Sato
a,
Satoshi
Yotsuhashi
a,
Katsushi
Fujii
 c,
Masakazu
Sugiyama
d and
Yoshiaki
Nakano
bd
aAdvanced Research Division, Panasonic Corporation, Soraku-gun, Kyoto 619-0237, Japan. E-mail: hashiba.hiroshi@jp.panasonic.com
bResearch Centre for Advanced Science and Technology, The University of Tokyo, Meguro-ku, Tokyo 153-8904, Japan
cInstitute of Environmental Science and Technology, The University of Kitakyushu, Kitakyushu, Fukuoka 808-0135, Japan
dDepartment of Electrical Engineering and Information Systems, Graduate School of Engineering, The University of Tokyo, Bunkyo-ku, Tokyo 113-8656, Japan
First published on 17th August 2017
Abstract
This study demonstrated the previously unrecognised capability of potassium bicarbonate (KHCO3) aqueous solutions to assist in the selective generation of methane (CH4) over a wide range of reaction parameters during electrochemical CO2 reduction over a bulk polycrystalline Cu catalyst. Compared with the results obtained with potassium chloride (KCl) electrolytes, a 0.5 M KHCO3 solution maintained a higher faradaic efficiency (FE) for CH4 production at higher current densities. This trend was further emphasised upon increasing the CO2 pressure from near-ambient to 3 atm and incorporating stirring. The result was a FE above 50% over a range of current densities from 90 to more than 330 mA cm−2. The maximum FE reached 80% at 0 °C, while maintaining a broad peak structure when plotted against current density, even over 300 mA cm−2. The buffering ability of KHCO3 appears to play an important role in increasing both the reaction rate and the selectivity for CH4, especially when combined with an optimised CO2 supply to the electrode and an ideal reaction temperature.
Introduction
Recently, the efficiency of direct CH4 production, as indicated in the context of power-to-gas,1 has become important. This process offers a practical means of using surplus energy from renewable sources and can take advantage of conventional facilities already used for natural gas storage and distribution. Electrochemical CO2 reduction is one of the most promising candidates for the direct production of renewable fuels, such as CH4 from waste CO2 and water. This reduction proceeds under moderate reaction conditions2,3 and has been attracting the interest of researchers for decades.4Among the various catalysts for electrochemical CO2 reduction, only copper (Cu) catalyses the reaction of CO2 to produce CH4 as the major product.5–8 However, as several reports and reviews have pointed out, CO2 reduction to CH4 over Cu is not readily controllable and numerous by-products interfere with the selective production of CH4 at high reaction rates under low overpotentials.4,8–12 Many studies have found that catalytic CO2 reduction can be significantly affected not only by modifying the Cu catalyst,13–19 but also by varying the reaction parameters, such as the applied potential (or current density), electrolyte, temperature and CO2 pressure, among other parameters.6,7,20,21 Therefore, many factors must be considered when optimising the catalytic process, even when using conventional CO2 reduction catalysts such as polycrystalline Cu. The reaction parameters must be carefully controlled and synergistic effects between the factors must be assessed. This is especially vital when designing practical applications involving the efficient conversion of CO2 to CH4. Despite this, only a few studies have focused on this aspect of the process.22,23
Recently, we developed a combinatorial screening system for the analysis of CO2 reduction reactions, which offers a means of making rapid systematic measurements while controlling multiple reaction parameters.24 Using the power of this system to rapidly ascertain the effects of specific parameters, the roles of CO2 pressure, stirring speed and temperature have been characterised with regard to the impact on the reaction rate and CH4 selectivity in potassium chloride (KCl) solutions.
Herein, extending the scope of our research, we report on the use of a potassium bicarbonate (KHCO3) solution to enhance both the reaction rate and the selectivity during CH4 production over a bulk polycrystalline Cu electrode, incorporating the other parameters optimised in our previous work.24 Traditionally, KHCO3 solutions have been used as the de facto standard electrolyte in this research field.4,8,9 Despite the general consensus that product selectivity could be drastically changed by applying different electrolytes or varying the electrolyte concentration,4 the specific role of the electrolyte has often been overlooked in the studies of CO2 reduction. Recently, Varela et al. discussed the effect of the electrolyte with regard to the buffering ability of KHCO3 on the local pH at the catalyst surface, and discussed the catalytic activity of planar Cu during the synthesis of hydrocarbons including CH4 and ethylene (C2H4).25 In this study, we demonstrate that the buffering effect of KHCO3 can be further emphasised when employed in conjunction with specific CO2 pressures, stirring speeds and reaction temperatures. We also compare these results with those obtained in 0.5 M KCl. Highly selective CH4 production, considerably more selective than that obtained when using 0.5 M KCl, is demonstrated at elevated current densities in 0.5 M KHCO3. This result shows the benefits of using a KHCO3 solution in CH4 production, especially when coupled with other optimised reaction parameters that maximise the catalytic activity of a conventional Cu electrode.
Results and discussion
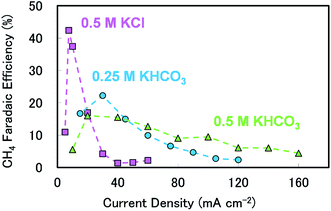
The details of the experimental conditions and procedures are summarised in the ESI.† For all experimental conditions (using various electrolytes, CO2 pressures, stirring speeds and temperatures), we ascertained the variation in faradaic efficiency (FE) for each reaction product with current density, the results of which are summarised in Fig. S2, S3 and Table S1 (ESI).† Meanwhile, the results confirming the reproducibility and time-dependence of the product selectivity are shown in Fig. S4 and S5(a).†Fig. 1 shows the CH4 FE values for reactions carried out over strip-shaped polycrystalline Cu plates as functions of current density when using 0.5 M KCl, 0.25 M KHCO3 or 0.5 M KHCO3. All these data were acquired at a CO2 pressure of 1.3 atm in unstirred reactors. The variation of current density shows a clear maximum CH4 FE for each electrolyte (corresponding to a more negative applied potential), which is consistent with previous observations over Cu.6,8,21,24 In the case of 0.5 M KCl, the peak efficiency was over 40% at 7.5 mA cm−2, but FE drastically decreased with further increases in current density. Above 30 mA cm−2, CH4 production ceased almost completely and was replaced by H2 generation (see Table S1 in the ESI†). A different trend was observed when KHCO3 was used as the cathode electrolyte. In 0.25 M KHCO3, the peak FE was lower than that observed for 0.5 M KCl. However, the decrease in the amount of CH4 produced at higher current densities was not as pronounced, with an efficiency of approximately 10% at 60 mA cm−2. The tail-off in CH4 selectivity with higher current densities was more gradual when 0.5 M KHCO3 was used; a CH4 selectivity of about 4% was observed even at 160 mA cm−2. The figure also shows that the CH4 selectivity plots for the two electrolytes have significantly different structures. The peak CH4 FE was lower but the tail-off was more gradual as the KHCO3 concentration was increased.
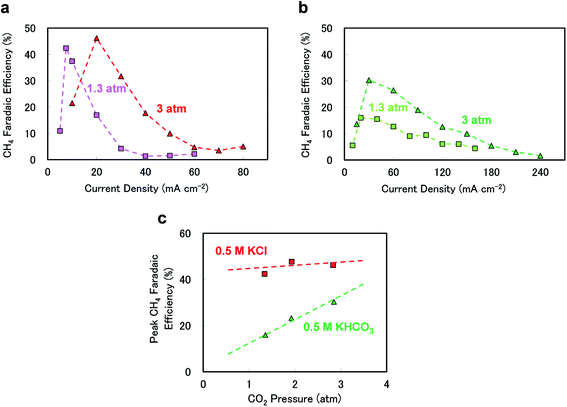
The different electrolytes also generated dissimilar responses upon increasing the CO2 pressure. Fig. 2(a)–(c) show the effects of CO2 pressure on the CH4 FE values when using 0.5 M KCl or 0.5 M KHCO3. As seen in Fig. 2(a) and (b), in 0.5 M KCl, the peak CH4 FE shifted to a higher current density upon increasing the pressure from 1.3 to 3 atm, whereas the peak efficiency increased and the peak became broader at higher current densities and with increasing pressure in 0.5 M KHCO3. Fig. 2(c) summarises the pressure response of the peak CH4 FE under each experimental condition. The peak efficiency was evidently not sensitive to pressure in 0.5 M KCl, which is consistent with our previous observations.24 In contrast, when using KHCO3, the peak efficiency clearly increased with pressure, indicating that CO2 pressure can be used to tune the CH4 selectivity, especially with 0.5 M KHCO3 as the electrolyte.
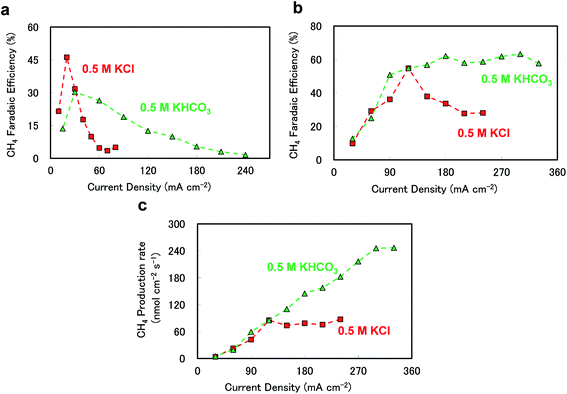
The differences between KHCO3 and KCl may be further emphasised by incorporating a stirring effect. Several papers have reported that stirring can increase the supply of CO2 to the catalyst surface by decreasing the boundary layer thickness between the catalyst surface and the bulk electrolyte.21,24Fig. 3(a) plots the CH4 FE values as functions of current density in 0.5 M KCl and KHCO3, at 3 atm and 0 rpm. Here, the peak CH4 FE is higher in 0.5 M KCl than that in 0.5 M KHCO3, but CH4 is produced across a wider current density range in 0.5 M KHCO3. Fig. 3(b) shows the dependence of the CH4 FE on current density for the two electrolytes under stirred conditions. In 0.5 M KCl, there is a sharp CH4 FE maximum at approximately 120 mA cm−2, although the efficiency rapidly drops below 40% at densities above 150 mA cm−2. In contrast, the CH4 FE in 0.5 M KHCO3 continues to increase even when density is increased above 150 mA cm−2, and maintains a value in the range of 50 to 60% even at 300 mA cm−2. Fig. 3(c) plots the CH4 production rates against current density, and clearly demonstrates the enhanced CH4 production in 0.5 M KHCO3. In each electrolyte, the CH4 production rate increased monotonically throughout the low current density region (below 100 mA cm−2). However, in 0.5 M KCl, the CH4 production rate abruptly plateaued at 80 nmol cm−2 s−1, whereas the CH4 production in 0.5 M KHCO3 continued to increase, reaching over 240 nmol cm−2 s−1. The incorporation of stirring can thus further increase the CH4 selectivity over a broad range of current densities, resulting in a CH4 production rate in KHCO3 more than three times that in KCl.
In addition to the CO2 pressure and stirring speed, temperature can affect the product selectivity, and it is known that the CH4 FE is improved at lower temperatures.20,24Fig. 4 shows the current density dependence of the CH4 FE at 3 atm, 500 rpm and 0 °C. In these trials, we used a 0.5 M KHCO3 + 1 M KCl solution to avoid decreasing the electrolyte conductivity upon lowering the temperature; otherwise this might have affected the current density range. The effect of adding KCl is evident from Fig. S6 (ESI),† in which similar CH4 FEs are observed both with and without KCl. Remarkably, upon decreasing the temperature to 0 °C, the CH4 FE was elevated, especially for a current density of less than 240 mA cm−2, where the maximum FE reached 80.0% at 80 mA cm−2. To the best of our knowledge, this is one of the highest selectivity values yet reported for CH4 production in an aqueous electrolyte using a bulk, polycrystalline Cu electrode.20,26–28 Moreover, CH4 FEs over 65% were achieved from 80 to 240 mA cm−2, demonstrating selective production over a broad current density range as a result of tuning various reaction parameters in the 0.5 M KHCO3 solution.
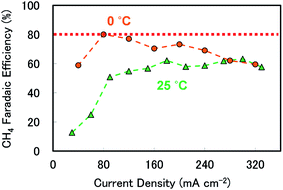 | ||
| Fig. 4 CH4 faradaic efficiencies as functions of current density at different temperatures and at 3 atm and 500 rpm in 0.5 M KHCO3 at 25 °C and 0.5 M KHCO3 + 1 M KCl (to prevent reduced electrolyte resistance, see Fig. S2 in the ESI for more details†) at 0 °C. Green triangles: 25 °C and orange circles: 0 °C. The red dotted line is intended solely as a visual aid. | ||
The CH4 selectivity of 80.0% was observed for an applied cathodic potential of approximately −2.02 V vs. Ag/AgCl (see Table S1 in the ESI†) and −1.38 V vs. the RHE without IR compensation. We calculated energy efficiency with regard to the cathode electrochemical reaction to produce CH4 at the cathode.29 This yielded an energy efficiency of 36.4%, which is also among leading values reported for CH4 production at a high current density value of 80 mA cm−2. We also note that this value includes IR resistance. Thus, further optimization of the system could yield even more efficient production of CH4, and, indeed, of the entire reaction (including oxygen evolution).
At this point, it is helpful to consider why CH4 production over a broad current density range in KHCO3 was higher than that observed in KCl. We therefore calculated the limiting current density (LCD) for CO2 reduction under the three experimental conditions shown in Fig. 1, and these are plotted in Fig. 5. The LCD data for all experimental conditions tested in this study are summarised in Table S2.† The LCD values were determined based on the maximum of partial current density for CO2 reduction under each condition. Generally, LCD relates to the mass transport properties of the reactant, and in this case LCD is believed to be closely related to the mass transport of CO2 in the system. Interestingly, Fig. 5 clearly shows that the LCD values increased when increasing the KHCO3 concentration to 0.5 M but keeping all other conditions the same in all three electrolytes. This result suggests that the extent of CO2 reduction can be varied based on the choice of electrolyte and its concentration.
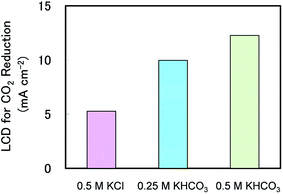 | ||
| Fig. 5 Limiting current densities for CO2 reduction in different electrolytes at 1.3 atm, 0 rpm and 25 °C. | ||
One possible explanation for this phenomenon is obtained by considering the concentrations of dissolved CO2 in various electrolytes. In electrochemical CO2 reduction, the reactant is generally considered to be CO2 dissolved in the electrolyte.30 In addition, the level of dissolved CO2 is known to vary slightly based on the choice of electrolyte and electrolyte concentration.23,31 According to Zhong et al., the saturated CO2 concentration in 0.5 M KHCO3 at ambient pressure is 36.3 mmol l−1, which is approximately 1.16 times that in 0.5 M KCl (31.3 mmol l−1).31 This partially explains the enhanced LCD in KHCO3 solutions, because the amount of CO2 available to participate in the reaction would have been higher. However, the LCD in 0.5 M KHCO3 was more than twice the value in 0.5 M KCl at 1.3 atm. Thus there must be another mechanism responsible for the enhancement of the LCD values in KHCO3 solutions.
The most important difference between these electrolytes is the concentration of HCO3−. In general, a CO2-saturated KHCO3 solution has a much stronger buffering ability than a CO2-saturated KCl solution, which means it is better able to compensate for consumed reactants like H+ and CO2. Hori et al. pointed out that the pH varies between the bulk electrolyte (bulk pH) and the pH at the catalyst surface (local pH).6 During electrochemical CO2 reduction, the local pH tends to be higher than the bulk pH owing to the consumption of H+ by the reaction, which also limits the concentration of CO2 as well as H+ (for a pH over 9, CO2 concentration becomes much lower by equilibrium).23,31 To mitigate this, Gupta et al. suggested that the local pH can be decreased by increasing the KHCO3 concentration (i.e., by increasing the buffer capacity) to compensate for H+ consumed by the reaction.30 Indeed, recent simulation results showed that LCD can be increased by increasing the electrolyte concentration of HCO3−.23 As shown in Table S3 and discussed further in the ESI,† this quantitatively and qualitatively supports our experimental data in suggesting that higher LCD values would be anticipated in conjunction with increased HCO3− concentrations, which in turn enhance the buffering ability of the solution.
As well as considering the H+ equilibrium, we also considered the direct compensation of CO2 consumed during the reaction. However, the interconversion between HCO3− and CO2 was estimated to be small given the lack of available catalyst.32 Nonetheless, we note that recent work used isotope labelling to experimentally propose the possibility of conversion from HCO3− to CO2.33,34 Thus, although several factors remain unclarified, we suggest that the enhancement of LCD in KHCO3 solution is likely to be connected to the interplay between the H+ and CO2 equilibria that is derived from KHCO3's buffering ability.
The present system favours CH4—rather than H2—production with increasing CO2 pressure and stirring speed in 0.5 M KHCO3. However, as shown in Fig. S7 (ESI†), based on the current density dependence data obtained in 0.5 M KHCO3, the minimum FE for H2 is significantly affected by the pressure and stirring speed, accompanied by the increase of the CH4 FE. Interestingly, this tendency was not observed in the case of 0.5 M KCl (see Fig. S8†). This result indicates that the buffering ability of the solution plays a role in suppressing H2 production upon the increase of CO2 pressure and stirring speed, possibly because the regenerated H+ can be more effectively coupled with CO2 on the surface of the catalyst. This synergetic effect between the electrolyte and the supply of CO2 may have contributed to the broad current density range over which CH4 production was observed, as well as the increased LCD values in the 0.5 M KHCO3 solution.
We are also keen to note the effect of reaction parameters on product selectivity during the reduction of CO2. In Fig. S3,† the FE of CO increases with pressure in both 0.5 M KCl and KHCO3 at 0 rpm and 25 °C, especially for low current densities (below 30 mA cm−2). Moreover, the selectivity values for the C2 and C3 products (C2H4, alcohols and aldehydes) also increase with pressure, as demonstrated by other experimental studies.35,36 This is also in-line with recent theoretical studies that showed that increasing surface coverage of CO intermediates—which is likely promoted by increasing CO2 pressure—accelerates CO desorption37 and C–C coupling.38 With regard to the effect of temperature on product selectivity, this work and several other studies have found that CH4 selectivity increases with decreasing temperature, accompanying the decrease in the FE for other CO2-reduction products.7,20,24 However, the mechanism by which low temperatures preferentially promote CH4 production remains unclear. Generally, decreasing the temperature suppresses the thermal excitation of electrons in the catalyst, increasing the selectivity for the most energetically favourable product. Recent computational studies suggest that a CO intermediate, which is considered a step in the reaction pathway toward forming hydrocarbons and alcohols, is more energetically favourable than HCOO−.10,39 In addition, the adsorbed CO on Cu is known to be more energetically favourable than gaseous CO.12 Furthermore, starting from CO, CH4 is predicted to be the most energetically favourable product (rather than methanol, C2 or C3 products) at a near-neutral pH.40 These findings could explain why CH4 production increases at lower temperatures in experimental studies.
Finally, we note that the Cu morphology is a key to the product selectivity. Recent work has shown that introducing nanostructures or adding nanoparticles to the Cu catalyst can alter the selectivity between C2H4 and CH4. This suggests that a smoother surface may favour the production of CH4 over C2H4.14,15,19 We therefore also compared the surface roughness of the Cu electrodes using SEM analysis, as shown in Fig. S9(a) and (b).† The degree of surface roughness was less than for other reported structures, perhaps contributing to the increase in selectivity for CH4 observed here. Moreover, an electron backscattering pattern (EBSP) study showed that the majority of the surface was considered more favourable for CH4 production, than for that of other products, such as C2H4.27 Together with the effects of parameters, these catalyst aspects may have also contributed to the observed selective CH4 production over a broad parameter range.
Conclusions
We have experimentally demonstrated selective CH4 production over a broad current density range in 0.5 M KHCO3. In aqueous solutions of KHCO3, the peak CH4 FE in a plot against current density exhibited a more gradual tail-off toward higher current density values than in 0.5 M KCl. Moreover, we have shown that CH4 production over bulk polycrystalline Cu can be further increased by raising the CO2 pressure and stirring speed in 0.5 M KHCO3, achieving CH4 selectivity values greater than 50% over a broad current density range with a maximum exceeding 300 mA cm−2. Tuning the reaction temperature, the maximum FE increased to 80%, while maintaining a peak efficiency across a broad current density range. The buffering ability of HCO3−, together with other optimised reaction parameters, creates an environment favourable for selective CH4 production over this broader current density range. This study has demonstrated the advantages of a concentrated KHCO3 solution in terms of obtaining selective CH4 production over a current density range of several hundred mA cm−2 for stirred reaction mixtures under pressures of only several atm. This approach could be especially beneficial in terms of its practical aspects, because it allows a wide parameter window in conjunction with the use of concentrated KHCO3 solutions and relatively low pressures. Our study also provides guidelines for optimising the reaction parameters to maximise the catalytic properties of conventional Cu electrodes for rapid and selective CH4 production. These findings suggest that, when developing catalysts for CO2 reduction, one should keep in mind that there is still much room to improve the activity of the catalyst by carefully considering the effects of reaction parameters. This could also be important during the evaluation of novel catalysts for practical applications in efficient CO2-reduction systems.Conflicts of interest
There are no conflicts to declare.References
- M. Jentsch, T. Trost and M. Sterner, Energy Procedia, 2014, 46, 254–261 CrossRef.
- D. T. Whipple and P. J. A. Kenis, J. Phys. Chem. Lett., 2010, 1, 3451–3458 CrossRef CAS.
- E. V. Kondratenko, G. Mul, J. Baltrusaitis, G. O. Larrazábal and J. Pérez-Ramírez, Energy Environ. Sci., 2013, 6, 3112 CAS.
- Y. Hori, Electrochemical CO2 Reduction of Metal Electrodes, in Modern Aspects of Electrochemistry, ed. C. G. Vayenas, R. E. White and M. E. Gamboa-Aldeco, Springer, New York, 2008, pp. 89–189 Search PubMed.
- Y. Hori, K. Kikuchi and S. Suzuki, Chem. Lett., 1985, 1695–1698 CrossRef CAS.
- Y. Hori, A. Murata and R. Takahashi, J. Chem. Soc., Faraday Trans. 1, 1989, 85, 2309–2326 RSC.
- M. Azuma, K. Hashimoto, M. Hiramoto, M. Watanabe and T. Sakata, J. Electrochem. Soc., 1990, 137, 1772–1778 CrossRef CAS.
- K. P. Kuhl, E. R. Cave, D. N. Abram and T. F. Jaramillo, Energy Environ. Sci., 2012, 5, 7050–7059 CAS.
- M. Gattrell, N. Gupta and A. Co, J. Electroanal. Chem., 2006, 594, 1–19 CrossRef CAS.
- A. A. Peterson, F. Abild-Pedersen, F. Studt, J. Rossmeisl and J. K. Norskov, Energy Environ. Sci., 2010, 3, 1311–1315 CAS.
- T. Cheng, H. Xiao and W. A. Goddard, J. Phys. Chem. Lett., 2015, 6, 4767–4773 CrossRef CAS PubMed.
- A. A. Peterson and J. K. Nørskov, J. Phys. Chem. Lett., 2012, 3, 251–258 CrossRef CAS.
- C. W. Li and M. W. Kanan, J. Am. Chem. Soc., 2012, 134, 7231–7234 CrossRef CAS PubMed.
- W. Tang, A. A. Peterson, A. S. Varela, Z. P. Jovanov, L. Bech, W. J. Durand, S. Dahl, J. K. Nørskov and I. Chorkendorff, Phys. Chem. Chem. Phys., 2012, 14, 76–81 RSC.
- R. Kas, R. Kortlever, A. Milbrat, M. T. Koper, G. Mul and J. Baltrusaitis, Phys. Chem. Chem. Phys., 2014, 16, 12194–12201 RSC.
- C. W. Li, J. Ciston and M. W. Kanan, Nature, 2014, 508, 504–507 CrossRef CAS PubMed.
- R. Kas, K. K. Hummadi, R. Kortlever, P. de Wit, A. Milbrat, M. W. Luiten-Olieman, N. E. Benes, M. T. Koper and G. Mul, Nat. Commun., 2016, 7, 10748 CrossRef CAS PubMed.
- Y. Kwon, Y. Lum, E. L. Clark, J. W. Ager and A. T. Bell, ChemElectroChem, 2016, 3, 1013–1019 CrossRef.
- H. Mistry, F. Behafarid, R. Reske, A. S. Varela, P. Strasser and B. R. Cuenya, ACS Catal., 2016, 6, 1075–1080 CrossRef CAS.
- Y. Hori, K. Kikuchi, A. Murata and S. Suzuki, Chem. Lett., 1986, 897–898 CrossRef CAS.
- K. Hara, A. Tsuneto, A. Kudo and T. Sakata, J. Electrochem. Soc., 1994, 141, 2097–2103 CrossRef CAS.
- M. R. Thorson, K. I. Siil and P. J. A. Kenis, J. Electrochem. Soc., 2012, 160, F69–F74 CrossRef.
- M. R. Singh, E. L. Clark and A. T. Bell, Phys. Chem. Chem. Phys., 2015, 17, 18924–18936 RSC.
- H. Hashiba, S. Yotsuhashi, M. Deguchi and Y. Yamada, ACS Comb. Sci., 2016, 18, 203–208 CrossRef CAS PubMed.
- A. S. Varela, M. Kroschel, T. Reier and P. Strasser, Catal. Today, 2016, 260, 8–13 CrossRef CAS.
- R. L. Cook, R. C. MacDuff and A. F. Sammells, J. Electrochem. Soc., 1987, 134, 2375–2376 CrossRef CAS.
- Y. Hori, I. Takahashi, O. Koga and N. Hoshi, J. Mol. Catal. A: Chem., 2003, 199, 39–47 CrossRef CAS.
- K. Manthiram, B. J. Beberwyck and A. P. Alivisatos, J. Am. Chem. Soc., 2014, 136, 13319–13325 CrossRef CAS PubMed.
- A. J. Martín, G. O. Larrazábal and J. Pérez-Ramírez, Green Chem., 2015, 17, 5114–5130 RSC.
- N. Gupta, M. Gattrell and B. MacDougall, J. Appl. Electrochem., 2006, 36, 161–172 CrossRef CAS.
- H. Zhong, K. Fujii, Y. Nakano and F. Jin, J. Phys. Chem. C, 2015, 119, 55–61 CAS.
- Y. Chen, N. S. Lewis and C. Xiang, Energy Environ. Sci., 2015, 8, 3663–3674 CAS.
- T. Sekimoto, H. Hashiba, S. Shinagawa, Y. Uetake, M. Deguchi, S. Yotsuhashi and K. Ohkawa, J. Phys. Chem. C, 2016, 120, 13970–13975 CAS.
- M. Dunwell, Q. Lu, J. M. Heyes, J. Rosen, J. G. Chen, Y. Yan, F. Jiao and B. Xu, J. Am. Chem. Soc., 2017, 139, 3774–3783 CrossRef CAS PubMed.
- C. F. C. Lim, D. A. Harrington and A. T. Marshall, Electrochim. Acta, 2016, 222, 133–140 CrossRef CAS.
- Y. Huang, A. D. Handoko, P. Hirunsit and B. S. Yeo, ACS Catal., 2017, 7, 1749–1756 CrossRef CAS.
- C. Shi, H. A. Hansen, A. C. Lausche and J. K. Nørskov, Phys. Chem. Chem. Phys., 2014, 16, 4720–4727 RSC.
- R. B. Sandberg, J. H. Montoya, K. Chan and J. K. Nørskov, Surf. Sci., 2016, 654, 56–62 CrossRef CAS.
- T. Cheng, H. Xiao and W. A. Goddard, J. Am. Chem. Soc., 2016, 138, 13802–13805 CrossRef CAS PubMed.
- H. Xiao, T. Cheng, W. A. Goddard and R. Sundararaman, J. Am. Chem. Soc., 2016, 138, 483–486 CrossRef CAS PubMed.
Footnote |
| † Electronic supplementary information (ESI) available. See DOI: 10.1039/c7se00352h |
| This journal is © The Royal Society of Chemistry 2017 |

