 Open Access Article
Utilizing light-triggered plasmon-driven catalysis reactions as a template for molecular delivery and release†
Xin
Gu
 ,
Huan
Wang
and
Jon P.
Camden
*
Department of Chemistry and Biochemistry, University of Notre Dame, Notre Dame, Indiana 46556, USA. E-mail: jon.camden@nd.edu
First published on 28th June 2017
Abstract
Due to the facile manipulation and non-invasive nature of light-triggered release, it is one of the most potent ways to selectively and remotely deliver a molecular target. Among the various carrier platforms, plasmonic nanoparticles possess advantages such as enhanced cellular uptake and easy loading of “cargo” molecules. Two general strategies are currently utilized to achieve light-induced molecule release from plasmonic nanoparticles. The first uses femtosecond laser pulses to directly break the bond between the nanoparticle and the loaded target. The other requires significant photo-thermal effects to weaken the interaction between the cargo molecules and nanoparticle-attached host molecules. Different from above mechanisms, herein, we introduce a new light-controlled molecular-release method by taking advantage of a plasmon-driven catalytic reaction at the particle surface. In this strategy, we link the target to a plasmon responsive molecule, 4-aminobenzenethiol (4-ABT), through the robust and simple EDC coupling reaction and subsequently load the complex onto the particles via the strong Au–thiol interaction. Upon continuous-wave (CW) laser illumination, the excited surface plasmon catalyzes the formation of 4,4′-dimercaptoazobenzenethiol (DMAB) and simultaneously releases the loaded molecules with high efficiency. This method does not require the use of high-power pulsed lasers, nor does it rely on photo-thermal effects. We believe that plasmon-driven release strategies open a new direction for the designing of next-generation light-triggered release processes.
Introduction
The ability to control the release of molecules at a specific site is essential when designing targeted drug delivery systems. Such systems combine safe transportation of high-payload toxic drugs to the desired location via nano-carriers with a controlled release mechanism, which can be triggered by a remotely applied stimuli.1 To date, remotely applied triggers such as electric fields,2–4 magnetic fields,5–9 light,10–18 and ultrasound19,20 have been utilized to design drug delivery systems that achieve precise molecular release. Light is one of the most attractive remote triggers because it can provide both high spatial and temporal precision in controlling the release process. Using near infrared (NIR) light, for example, several centimeters of deep tissue penetration can be achieved while avoiding the in vivo autofluorescence in the UV-vis region.21–23 Plasmonic nanoparticles such as gold nanorods, nanoshells and nanocages, therefore, are favored as molecule carriers not only because they strongly absorb light in the NIR region on account of their localized surface plasmon resonance (LSPR), but also due to the enhanced permeability and retention (EPR) effects which allow more passive accumulation of nanoparticles within the desired sites.24,25 Additionally, the use of well-established thiol–Au self-assembly chemistry greatly simplifies the drug-loading of the plasmonic nanoparticles.Currently, there are two major mechanisms to manipulate the release process from plasmonic nanoparticles using NIR light. The first one utilizes the photo-thermal effect generated from strongly NIR absorbing plasmonic nanoparticles upon NIR irradiation. The local heating induces a conformational change in thermo-responsive polymers at the nanoparticle surface to achieve the release of the target molecules,26–28 or cleave a thermo-labile bond between the loaded molecules and host moieties on the nanoparticles.11,29–33 Alternatively, in the second mechanism, the drug molecule is directly attached to the nanoparticle surface via a sulfur–Au covalent bond, which is broken to release the loaded molecules. This approach usually involves the use of pulsed laser to generate high-energy hot-electrons from the plasmon decay process and resulting in the breaking of the metal–sulfur bond.15,34–36
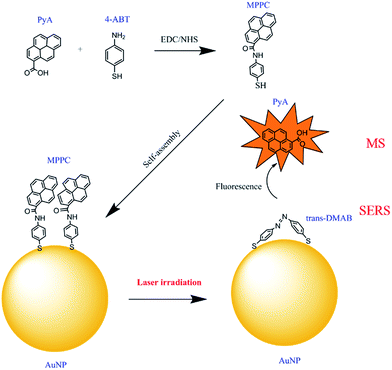
In this work, we demonstrate a novel method, distinct from the above mentioned procedures, to release molecules loaded onto plasmonic nanoparticles without the use of expensive pulsed lasers or reliance on the photo-thermal effect. Our procedure relies on the plasmon-induced dimerization of 4-aminobenzenethiol (4-ABT)37–39 into trans-4,4′-dimercaptoazobenzenethiol (DMAB) under CW laser illumination. Interestingly, this plasmon-driven reaction happens even when the H on the –NH2 of 4-ABT is substituted by other groups,40,41 suggesting a general procedure for targeted release. Therefore, coupling the target molecule with 4-ABT produces a new molecule that can be robustly attached to the nanoparticle and can further deliver the target at the point of interest upon illumination. We illustrate the practicality of this process by coupling a fluorescent molecule, 1-pyrenecarboxylic acid (PyA), to 4-ABT through a facile EDC/NHS reaction and attach the product, N-(mercaptophenyl)pyrene-1-carboxamide (MPPC), to 60 nm Au nanoparticles (AuNPs) via robust S–Au interaction. The MPPC is catalysed to DMAB under 785 nm CW laser illumination resulting in release of PyA into the solution (Fig. 1). By monitoring the change of the fluorescence intensity in the aqueous solution, we are able to quantify the amount of PyA released during the process and evaluate the release efficiency.
Results and discussion
Monitoring the plasmon-driven reaction using surface-enhanced Raman spectroscopy (SERS)
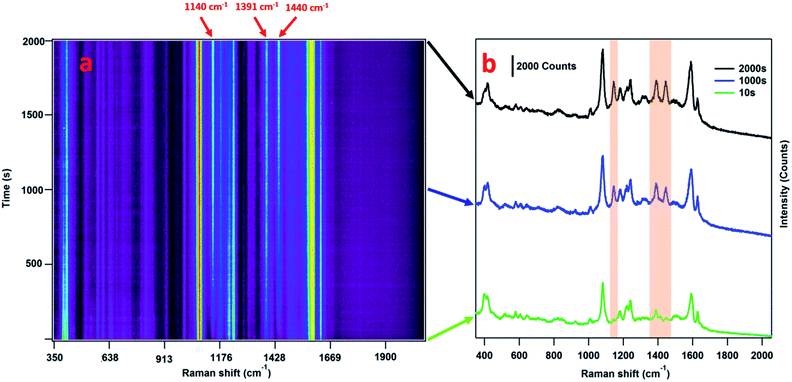
SERS is a very sensitive probe of chemical and conformational changes of surface-bound molecules.42–46 The plasmon-driven catalysis of 4-ABT or 4-nitrobenzenethiol (4-NBT) to DMAB, for example, has been widely investigated using SERS and TERS by monitoring the emerging bands at 1144, 1390, and 1443 cm−1 which are associated with the generation of DMAB.37,39,47–57 For the case of 4-ABT to DMAB, it is speculated that hot holes generated from the LSPR decay are directly linked to the oxidation of 4-ABT to DMAB, where O2 is implicated as a hot-electron capturer to improve the efficiency of hole–electron separation.38,58 Amazingly, this reaction is not only limited to aromatic compounds with a –NH2 group but is observed in other compounds where the H of the –NH2 is substituted by other groups.40 Consequently, we hypothesized that the formation of a diazo bond between two adjacent nitrogen atoms could release the group originally connected to the nitrogen atom attached to the phenyl ring.In order to validate this scheme, MPPC is synthesized by coupling the fluorescent molecule PyA with 4-ABT via EDC reaction, and attached to the AuNPs. According to the release mechanism proposed above (Fig. 1), laser irradiation of the MPPC modified AuNPs will result in (1) plasmon-driven generation of DMAB which will be reflected as the appearance of DMAB bands in SERS spectra, and (2) the simultaneous release of PyA which can be further confirmed by mass spectrometry and increase of the fluorescence in the supernatant solution (vide infra). Therefore, to monitor the conversion from MPPC to DMAB upon laser illumination, SERS spectra are obtained from MPPC modified AuNPs aggregates as a function of time. As Fig. 2a shows, the bands at 1144, 1390, and 1443 cm−1 are initially absent and grow stronger with prolonged 785 nm laser illumination indicating the generation of DMAB. Single SERS spectra from 10, 1000, and 2000 s are also displayed (Fig. 2b) respectively to show how the spectra change over time. The SERS bands in the shaded region of Fig. 2b correspond to the formation of DMAB. Before laser illumination (green trace) the spectra is entirely attributed to MPPC, but over time the DMAB bands grow. Furthermore, monitoring the SERS intensity vs. time of the DMAB bands (Fig. 3), we find the reaction is mostly complete within 600 s. While the appearance of the DMAB bands is a concrete proof of our proposed light triggered plasmon-driven reaction, we are careful not to use the SERS spectra to quantify DMAB formation as the intensity of the SERS bands rely strongly on the relative Raman cross sections of MPPC and DMAB and the SERS enhancement factors.
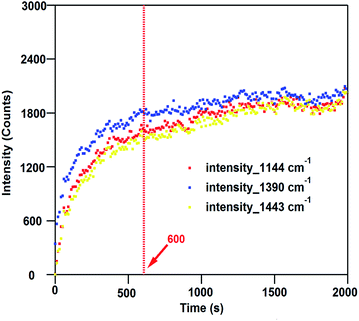 | ||
| Fig. 3 SERS intensities of the 1140, 1391, and 1440 cm−1 bands versus time. The plasmon-driven release is mostly complete after 600 s. | ||
Fluorescence investigation of PyA and MPPC
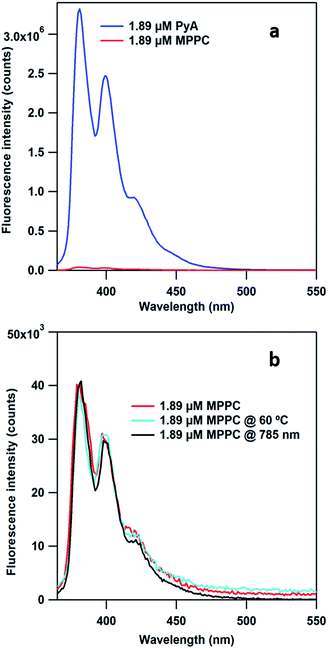
In our hypothesis, release of the loaded PyA will give rise to the fluorescence intensity in the supernatant solution. However, one could speculate that desorption of MPPC from AuNPs might also contribute to the fluorescence increase, which would potentially undermine the quantification of released PyA. To eliminate this possibility, we check the fluorescence properties (λex = 342 nm) of both PyA and MPPC under same concentration (1.89 μM) in water and find that MPPC exhibits negligible fluorescence (Fig. 4a, red trace) while PyA shows several orders of magnitude stronger fluorescence (Fig. 4a, blue trace). This is probably due to the lone pair electrons on the nitrogen donating to pyrene ring, which causes the quenching effect.59 Advantageously, the lack of MPPC fluorescence excludes the possibility that an increase in fluorescence intensity after laser illumination results from the direct desorption of MPPC from the AuNPs. We further measure the fluorescence intensity of the MPPC solution without AuNP (1.89 μM) after heating to 60 °C or after laser illumination (45 mW, 785 nm, 2 h) (Fig. 4b). The fluorescence intensity of the control solution (no heat or laser illumination), the laser illuminated sample, and the heater sample are all the same within the experimental uncertainty; thereby, illustrating the photo- and thermal-stability of MPPC under our test conditions. This result is a solid evidence that neither light nor heat can trigger the release of PyA from MPPC without the presence of plasmonic nanoparticles.Monitoring 785 nm CW laser-induced release using fluorescence and MS
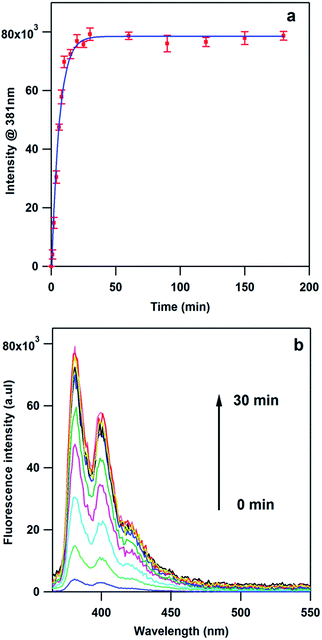
Although the conversion from MPPC to DMAB is demonstrated by the SERS spectra (Fig. 2a and b), we still need to confirm the release of the PyA into the solution through more direct methods. As mentioned above, PyA release will cause an increase in fluorescence intensity of the supernatant solution, which can be used to validate and quantify the release process. Samples placed in the glass vials under stirring are subject to defocused laser irradiation (45 mW 785 nm) for 1–180 minutes and after centrifugation the fluorescence intensity in the supernatant solution is measured (Fig. 5a). It is clear that after 30 min illumination, the fluorescence intensity stabilizes indicating the maximal release of PyA has been achieved. For clarity, we also show the complete fluorescence spectra from samples after laser irradiation (Fig. 5b).To further confirm that PyA is the release product, supernatant solutions from samples subject to 180 and 0 min irradiation are checked with mass spectrometry. We find a peak at 247.0138 in the irradiated sample which corresponds to [PyAH]+, while no such peak is found in the sample without laser exposure (Fig. S4 and S5, ESI†). The results from fluorescence and MS are solid proof of releasing PyA through our proposed scheme. In order to quantify the amount of PyA released, we construct a calibration curve (Fig. S6, ESI†) using the fluorescence intensity of the peak at 381 nm, which shows a linear relation between fluorescence intensity and concentration. Through our calculation, the amount of PyA released is about 38.5 nM. Since the concentration of the AuNPs used is about 109 particles per mL, it is calculated that ∼23![[thin space (1/6-em)]](https://www.rsc.org/images/entities/char_2009.gif) 000 PyA molecules are released from one single AuNP. Taking account the size of AuNPs (60 nm) it is estimated that about 2.04 × 10¹⁴ PyA per cm−2 is released. If we adopt the packing density of 4-biphenylthiol (3 × 10¹⁴ molecules per cm−2)60 as the packing density of MPPC, it suggests that >66% of the loaded PyA is released. Given the fact that MPPC molecule is significantly larger than 4-biphenylthiol, our above estimate represents a worst-case scenario and the release efficiency is likely much higher.
000 PyA molecules are released from one single AuNP. Taking account the size of AuNPs (60 nm) it is estimated that about 2.04 × 10¹⁴ PyA per cm−2 is released. If we adopt the packing density of 4-biphenylthiol (3 × 10¹⁴ molecules per cm−2)60 as the packing density of MPPC, it suggests that >66% of the loaded PyA is released. Given the fact that MPPC molecule is significantly larger than 4-biphenylthiol, our above estimate represents a worst-case scenario and the release efficiency is likely much higher.
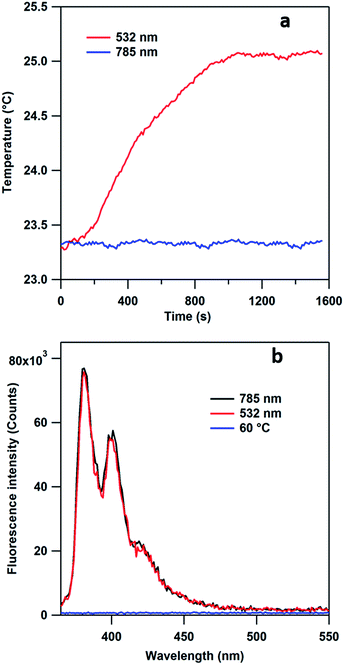
As our laser excitation wavelength (785 nm) is well removed from the maximum of the AuNP extinction spectrum (534 nm, Fig. S7†), our procedure differs from the usual photo-thermal release mechanism which requires the LSPR band of the nanoparticles to overlap with the laser wavelength. To verify this statement, we expose the MPPC modified AuNPs samples to both 532 nm and 785 nm CW laser under the same power (45 mW) and utilize an IR camera to record the temperature change. As Fig. 6a shows, a 1.8 °C increase is observed in the sample illuminated with 532 nm laser while no such change is observed in the sample exposed to 785 illumination. The fluorescence of the supernatant solution resulting from the irradiated samples are measured after centrifugation (Fig. 6b). Interestingly, the intensity of fluorescence obtained from both the 532 nm and 785 nm samples are the same within experimental uncertainty indicating similar amounts of PyA are released from plasmon-driven process. However, when MPPC modified AuNPs are heated to 60 °C for 2 hours, no fluorescence is observed (Fig. 6b, blue trace) from its supernatant solution after centrifugation illustrating neither heat nor the AuNPs itself is the key factor in the release process. This provides additional evidence that our results are not obtained from the photo-thermal effect.
Conclusions
We have introduced a novel way to release molecules from plasmonic nanoparticles in an efficient manner. The release mechanism is based on breaking the bond between 4-ABT and a loaded molecule through a plasmon-driven reaction which converts the 4-ABT-target-molecule complex into DMAB. Unlike the most common release methods, our scheme does not rely on producing significant photo-thermal effect by overlapping the extinction band of the nanoparticles with the laser wavelength, or resort to expensive pulsed lasers. Moreover, the availability of facile and sophisticated amine modification chemistry makes it easy to couple desired molecules like drugs, DNA, and proteins to our plasmon-responsive host molecule, 4-ABT.61 We envision our method will open a new field in designing the systems that utilizes the idea of plasmon-driven release and inspire more researchers to be involved with designing the related drug release systems.Experimental
Synthesis of MPPC
4-Pyrenecarboxylic acid (0.29 mmol), N-hydroxysuccinimide (0.43 mmol) is dissolved in dry DCM (5 mL) under nitrogen atmosphere in a 25 mL round bottom flask. At 0 °C, EDCI (67 mg, 0.43 mmol) is added into the flask. The mixture is kept stirring at 0 °C for 30 minutes, then removed from the water bath and stirred at room temperature until the starting material disappears. The reaction mixture is directly used for the next reaction without further purification. 4-Amino benzenethiol (0.43 mmol) and trimethylamine (0.43 mmol) is added into the reaction mixture and stirred at room temperature for 10 hours. After that, the reaction mixture is washed with water and extracted with ethyl acetate. The dark green solid product is purified by silica gel column chromatography (10–50% EtOAc in PE) in 75% yield for two steps. 1H NMR (400 MHz, CDCl3): δ = 3.92 (s, 2H), 6.82 (d, 2H, Ar-H), 7.41 (d, 2H, Ar-H), 8.04–8.29 (m, 7H, Ar-H), 8.68 (d, 2H, ArH), 8.89 (d, 2H, Ar-H). 13C NMR (400 MHz, CDCl3): δ = 155.1, 136.7, 134.4, 131.4, 130.8, 130.0, 129.9, 128.8, 127.4, 125.7, 125.6, 125.4, 124.8, 124.3, 115.9. HRMS: found 354.0964 [M + H]+, calculated for [C23H16NOS]+ 354.0947 (NMR and MS details in Fig. S1–S3, ESI†).Functionalization of AuNPs with MPPC
2 μL of freshly prepared 0.5 mg mL−1 MPPC solution is added into 3 mL AuNPs (109 particles per mL, 60 nm, purchased from Nanopartz) and the mixture is stirred overnight in a dark environment. The excess MPPC is removed by centrifugation (6500 rpm for 10 min) and resuspension in ultrapure water. The modified AuNP solution is stored at 4 °C before use.SERS spectra
The laser beam (2 mW, measured at the sample) is focused onto aggregated Au colloids (aggregated by 100 μL 1 M NaBr added into 1 mL of modified Au colloid solution in order to get decent SERS signal) using an inverted microscope objective (Nikon 20×, NA = 0.5). The scattered light is collected by the same objective and, after passing through a Rayleigh rejection filter (Semrock), was dispersed in a spectrometer (PI Acton Research, f = 0.3 m, grating = 600 g mm−1). Light is detected with a back-illuminated deep-depletion CCD (PIXIS, Spec-10, Princeton Instruments). Winspec 32 software (Princeton Instruments) is used to operate the spectrometer and CCD camera. The SERS spectra is acquired every 10 s for total time of 2000 s.785 nm laser stimulated release study
3 mL of above MPPC modified AuNPs is stirred in a glass vial on a stirring plate. Each sample solution is irradiated from the side with 785 nm CW laser beam (45 mW, diameter 1 mm) for 1, 2, 4, 6, 8, 10, 15, 20, 25, 30, 60, 90, 120, 150, and 180 min. Afterwards, a 1.5 mL aliquot is removed and immediately centrifuged at 10![[thin space (1/6-em)]](https://www.rsc.org/images/entities/char_2009.gif) 000 rpm for 10 min. 1 mL of the supernatant is collected and fluorescence is measured for all samples.
000 rpm for 10 min. 1 mL of the supernatant is collected and fluorescence is measured for all samples.
Temperature study of MPPC modified AuNPs
3 mL of above MPPC modified AuNPs is stirred in a glass vial on a stirring plate. Each sample solution is irradiated from the side with 785 nm and 532 nm CW laser beam (45 mW, diameter 1 mm) for 2 hours respectively. The temperature is recorded using a thermal imaging camera (ICI, USA). Another sample without the laser illumination is also recorded during the process using the IR camera to calibrate the change in the room temperature.Acknowledgements
This work was supported by Advanced Diagnostics and Therapeutics (XG) at the University of Notre Dame, U.S. National Science Foundation under Grants CHE-1150687 and CHE-1709566 (JPC, XG). XG thanks Wenqi Liu and Prof. Bradley Smith for the assistance in fluorescence measurement and inspirational suggestions on the research. XG also thanks Scott K. Shaw for the assistance in the thermal camera setup.Notes and references
- J. Liu, C. Detrembleur, S. Mornet, C. Jerome and E. Duguet, J. Mater. Chem. B, 2015, 3, 6117–6147 RSC.
- J. Ge, E. Neofytou, T. J. Cahill, R. E. Beygui and R. N. Zare, ACS Nano, 2012, 6, 227–233 CrossRef CAS PubMed.
- Y. C. Zhu, H. J. Liu, F. Li, Q. C. Ruan, H. Wang, M. Fujiwara, L. Z. Wang and G. Q. Lu, J. Am. Chem. Soc., 2010, 132, 1450–1451 CrossRef CAS PubMed.
- D. Samanta, N. Hosseini-Nassab and R. N. Zare, Nanoscale, 2016, 8, 9310–9317 RSC.
- C. Alexiou, W. Arnold, R. J. Klein, F. G. Parak, P. Hulin, C. Bergemann, W. Erhardt, S. Wagenpfeil and A. S. Lubbe, Cancer Res., 2000, 60, 6641–6648 CAS.
- K. Hayashi, K. Ono, H. Suzuki, M. Sawada, M. Moriya, W. Sakamoto and T. Yogo, ACS Appl. Mater. Interfaces, 2010, 2, 1903–1911 CAS.
- F. Lu, A. Popa, S. W. Zhou, J. J. Zhu and A. C. S. Samia, Chem. Commun., 2013, 49, 11436–11438 RSC.
- M. M. Goswami, Sci. Rep., 2016, 6, 35721–35730 CrossRef PubMed.
- S. Mornet, S. Vasseur, F. Grasset and E. Duguet, J. Mater. Chem., 2004, 14, 2161–2175 RSC.
- P. K. Brown, A. T. Qureshi, A. N. Moll, D. J. Hayes and W. T. Monroe, ACS Nano, 2013, 7, 2948–2959 CrossRef CAS PubMed.
- R. Huschka, J. Zuloaga, M. W. Knight, L. V. Brown, P. Nordlander and N. J. Halas, J. Am. Chem. Soc., 2011, 133, 12247–12255 CrossRef CAS PubMed.
- G. Han, C. C. You, B. J. Kim, R. S. Turingan, N. S. Forbes, C. T. Martin and V. M. Rotello, Angew. Chem., Int. Ed., 2006, 45, 3165–3169 CrossRef CAS PubMed.
- X. J. Yang, X. Liu, Z. Liu, F. Pu, J. S. Ren and X. G. Qu, Adv. Mater., 2012, 24, 2890–2895 CrossRef CAS PubMed.
- J. Zheng, Y. H. Nie, S. Yang, Y. Xiao, J. S. Li, Y. H. Li and R. H. Yang, Anal. Chem., 2014, 86, 10208–10214 CrossRef CAS PubMed.
- A. Wijaya, S. B. Schaffer, I. G. Pallares and K. Hamad-Schifferli, ACS Nano, 2009, 3, 80–86 CrossRef CAS PubMed.
- D. D. Luo, K. A. Carter, A. Razi, J. M. Geng, S. Shao, D. Giraldo, U. Sunar, J. Ortega and J. F. Lovell, Biomaterials, 2016, 75, 193–202 CrossRef CAS PubMed.
- Y. L. Luo, Y. S. Shiao and Y. F. Huang, ACS Nano, 2011, 5, 7796–7804 CrossRef CAS PubMed.
- E. S. Levy, D. P. Morales, J. V. Garcia, N. O. Reich and P. C. Ford, Chem. Commun., 2015, 51, 17692–17695 RSC.
- W. G. Pitt, G. A. Husseini and B. J. Staples, Expert Opin. Drug Delivery, 2004, 1, 37–56 CrossRef CAS PubMed.
- A. Schroeder, J. Kost and Y. Barenholz, Chem. Phys. Lipids, 2009, 162, 1–16 CrossRef CAS PubMed.
- X. H. Huang, P. K. Jain, I. H. El-Sayed and M. A. El-Sayed, Laser. Med. Sci., 2008, 23, 217–228 CrossRef PubMed.
- N. Fomina, J. Sankaranarayanan and A. Almutairi, Adv. Drug Delivery Rev., 2012, 64, 1005–1020 CrossRef CAS PubMed.
- M. C. Daniel and D. Astruc, Chem. Rev., 2004, 104, 293–346 CrossRef CAS PubMed.
- H. Maeda, J. Wu, T. Sawa, Y. Matsumura and K. Hori, J. Controlled Release, 2000, 65, 271–284 CrossRef CAS PubMed.
- M. Ferrari, Nat. Rev. Cancer, 2005, 5, 161–171 CrossRef CAS PubMed.
- T. Kawano, Y. Niidome, T. Mori, Y. Katayama and T. Niidome, Bioconjugate Chem., 2009, 20, 209–212 CrossRef CAS PubMed.
- Y. N. Zhong, C. Wang, L. Cheng, F. H. Meng, Z. Y. Zhong and Z. Liu, Biomacromolecules, 2013, 14, 2411–2419 CrossRef CAS PubMed.
- J. Liu, C. Detrembleur, M. C. De Pauw-Gillet, S. Mornet, E. Duguet and C. Jerome, Polym. Chem., 2014, 5, 799–813 RSC.
- A. Riedinger, P. Guardia, A. Curcio, M. A. Garcia, R. Cingolani, L. Manna and T. Pellegrino, Nano Lett., 2013, 13, 2399–2406 CrossRef CAS PubMed.
- S. Yamashita, H. Fukushima, Y. Niidome, T. Mori, Y. Katayama and T. Niidome, Langmuir, 2011, 27, 14621–14626 CrossRef CAS PubMed.
- M. Chen, P. C. Qiu, X. X. He, K. M. Wang, S. Y. Chen, S. N. Yang and X. S. Ye, J. Mater. Chem. B, 2014, 2, 3204–3213 RSC.
- A. Barhoumi, R. Huschka, R. Bardhan, M. W. Knight and N. J. Halas, Chem. Phys. Lett., 2009, 482, 171–179 CrossRef CAS.
- M. Reismann, J. C. Bretschneider, G. von Plessen and U. Simon, Small, 2008, 4, 607–610 CrossRef CAS PubMed.
- P. K. Jain, W. Qian and M. A. El-Sayed, J. Am. Chem. Soc., 2006, 128, 2426–2433 CrossRef CAS PubMed.
- A. M. Goodman, N. J. Hogan, S. Gottheim, C. Li, S. E. Clare and N. J. Halas, ACS Nano, 2017, 11, 171–179 CrossRef CAS PubMed.
- J. Stehr, C. Hrelescu, R. A. Sperling, G. Raschke, M. Wunderlich, A. Nichtl, D. Heindl, K. Kurzinger, W. J. Parak, T. A. Klar and J. Feldmann, Nano Lett., 2008, 8, 619–623 CrossRef CAS PubMed.
- Y.-F. Huang, H.-P. Zhu, G.-K. Liu, D.-Y. Wu, B. Ren and Z.-Q. Tian, J. Am. Chem. Soc., 2010, 132, 9244–9246 CrossRef CAS PubMed.
- Y. F. Huang, M. Zhang, L. B. Zhao, J. M. Feng, D. Y. Wu, B. Ren and Z. Q. Tian, Angew. Chem., Int. Ed., 2014, 53, 2353–2357 CrossRef CAS PubMed.
- M. T. Sun and H. X. Xu, Small, 2012, 8, 2777–2786 CrossRef CAS PubMed.
- K. Kim, D. Shin, J. Y. Choi, K. L. Kim and K. S. Shin, J. Phys. Chem. C, 2011, 115, 24960–24966 CAS.
- L. L. Kang, P. Xu, B. Zhang, H. H. Tsai, X. J. Han and H. L. Wang, Chem. Commun., 2013, 49, 3389–3391 RSC.
- A. B. Zrimsek, N. Chiang, M. Mattei, S. Zaleski, M. O. McAnally, C. T. Chapman, A.-I. Henry, G. C. Schatz and R. P. Van Duyne, Chem. Rev., 2017, 117, 7583–7613 CrossRef CAS PubMed.
- X. Gu, H. Wang, Z. D. Schultz and J. P. Camden, Anal. Chem., 2016, 88, 7191–7197 CrossRef CAS PubMed.
- W. Wang, L. Zhang, L. Li and Y. Tian, Anal. Chem., 2016, 88, 9518–9523 CrossRef CAS PubMed.
- D. W. Li, L. L. Qu, K. Hu, Y. T. Long and H. Tian, Angew. Chem., Int. Ed., 2015, 54, 12758–12761 CrossRef CAS PubMed.
- B. Sharma, P. Bugga, L. R. Madison, A.-I. Henry, M. G. Blaber, N. G. Greeneltch, N. Chiang, M. Mrksich, G. C. Schatz and R. P. Van Duyne, J. Am. Chem. Soc., 2016, 138, 13952–13959 CrossRef CAS PubMed.
- Y. R. Fang, Y. Z. Li, H. X. Xu and M. T. Sun, Langmuir, 2010, 26, 7737–7746 CrossRef CAS PubMed.
- B. Kafle, M. Poveda and T. G. Habteyes, J. Phys. Chem. Lett., 2017, 8, 890–894 CrossRef CAS PubMed.
- Z. Zhang, D. Kinzel and V. Deckert, J. Phys. Chem. C, 2016, 120, 20978–20983 CAS.
- H.-K. Choi, W.-H. Park, C.-G. Park, H.-H. Shin, K. S. Lee and Z. H. Kim, J. Am. Chem. Soc., 2016, 138, 4673–4684 CrossRef CAS PubMed.
- J. Wang, R. A. Ando and P. H. C. Camargo, Angew. Chem., Int. Ed., 2015, 54, 6909–6912 CrossRef CAS PubMed.
- Z. L. Zhang, P. Xu, X. Z. Yang, W. J. Liang and M. T. Sun, J. Photochem. Photobiol., C, 2016, 27, 100–112 CrossRef CAS.
- M. T. Sun, Y. R. Fang, Z. Y. Zhang and H. X. Xu, Phys. Rev. E: Stat., Nonlinear, Soft Matter Phys., 2013, 87, 020401 CrossRef PubMed.
- Z. L. Zhang, S. X. Sheng, R. M. Wang and M. T. Sun, Anal. Chem., 2016, 88, 9328–9346 CrossRef CAS PubMed.
- Z. L. Zhang, Y. R. Fang, W. H. Wang, L. Chen and M. T. Sun, Adv. Sci., 2016, 3, 1500215 CrossRef PubMed.
- M. T. Sun, Z. L. Zhang, H. R. Zheng and H. X. Xu, Sci. Rep., 2012, 2, 647 Search PubMed.
- X. Yang, H. Yu, X. Guo, Q. Ding, T. Pullerits, R. Wang, G. Zhang, W. Liang and M. Sun, Materials Today Energy, 2017, 5, 72–78 CrossRef.
- X. F. Yan, L. Z. Wang, X. J. Tan, B. Z. Tian and J. L. Zhang, Sci. Rep., 2016, 6, 30193–30199 CrossRef CAS PubMed.
- S. Franzen, W. J. Ni and B. H. Wang, J. Phys. Chem. B, 2003, 107, 12942–12948 CrossRef CAS.
- Y. T. Tao, C. C. Wu, J. Y. Eu, W. L. Lin, K. C. Wu and C. H. Chen, Langmuir, 1997, 13, 4018–4023 CrossRef CAS.
- C. Haensch, S. Hoeppener and U. S. Schubert, Chem. Soc. Rev., 2010, 39, 2323–2334 RSC.
Footnote |
| † Electronic supplementary information (ESI) available: 1H NMR, 13C NMR, and mass spectrum information of synthesized MPPC molecule, the mass spectra of supernatant solution subject to 0 and 180 min of laser irradiation, calibration curve of PyA concentration vs. fluorescence intensity at 381 nm, and the extinction spectrum of the AuNPs. See DOI: 10.1039/c7sc02089a |
| This journal is © The Royal Society of Chemistry 2017 |

