 Open Access Article
Coupling functionalized cobalt ferrite nanoparticle enrichment with online LC/MS/MS for top-down phosphoproteomics†
Bifan
Chen‡
 a,
Leekyoung
Hwang‡
a,
William
Ochowicz
a,
Ziqing
Lin
b,
Tania M.
Guardado-Alvarez
a,
Wenxuan
Cai
b,
Lichen
Xiu
a,
Kunal
Dani
a,
Cyrus
Colah
b,
Song
Jin
a,
Leekyoung
Hwang‡
a,
William
Ochowicz
a,
Ziqing
Lin
b,
Tania M.
Guardado-Alvarez
a,
Wenxuan
Cai
b,
Lichen
Xiu
a,
Kunal
Dani
a,
Cyrus
Colah
b,
Song
Jin
 *a and
Ying
Ge
 *abc
*abc
aDepartment of Chemistry, University of Wisconsin–Madison, Madison, WI, USA. E-mail: ge2@wisc.edu
bDepartment of Cell and Regenerative Biology, University of Wisconsin–Madison, Madison, WI, USA
cHuman Proteomics Program, School of Medicine and Public Health, University of Wisconsin–Madison, Madison, WI, USA
First published on 7th April 2017
Abstract
Phosphorylation plays pivotal roles in cellular processes and dysregulated phosphorylation is considered as an underlying mechanism in many human diseases. Top-down mass spectrometry (MS) analyzes intact proteins and provides a comprehensive analysis of protein phosphorylation. However, top-down MS-based phosphoproteomics is challenging due to the difficulty in enriching low abundance intact phosphoproteins as well as separating and detecting the enriched phosphoproteins from complex mixtures. Herein, we have designed and synthesized the next generation functionalized superparamagnetic cobalt ferrite (CoFe2O4) nanoparticles (NPs), and have further developed a top-down phosphoproteomics strategy coupling phosphoprotein enrichment enabled by the functionalized CoFe2O4 NPs with online liquid chromatography (LC)/MS/MS for comprehensive characterization of phosphoproteins. We have demonstrated the highly specific enrichment of a minimal amount of spike-in β-casein from a complex tissue lysate as well as effective separation and quantification of its phosphorylated genetic variants. More importantly, this integrated top-down phosphoproteomics strategy allows for enrichment, identification, quantification, and comprehensive characterization of low abundance endogenous phosphoproteins from complex tissue extracts on a chromatographic time scale.
Introduction
Reversible protein phosphorylation orchestrates important cellular processes in eukaryotic cells including cell proliferation, protein–protein interaction, signal propagation, among others.1,2 Dysregulation of protein phosphorylation is known to be critically involved in the pathogenesis of many human diseases, such as cancer, heart failure, and neurodegenerative disease.1,3–7 To understand these disease processes, identification and quantification of phosphoproteins are the essential steps in decoding the complex cellular signaling network regulated by phosphorylation events. Moreover, proteoforms arising from alternative splicing, amino acid polymorphisms, and other post-translational modifications (PTMs),8 have imposed another layer of complexity to the phosphoproteome. The conventional shotgun “bottom-up” mass-spectrometry (MS) based phosphoproteomics which analyzes peptides resulted from protein digestions,9,10 is suboptimal because of the “protein inference problem”, resulting in incomplete information on sequences or modifications.11,12 In contrast, the top-down MS approach examines intact proteins without digestion, providing a global view and the possible merit of comprehensive analysis of all modified proteoforms.5,13–16 Therefore, top-down MS allows one to study phosphoproteins and their associated proteoforms at the intact protein level, which leads to more direct connectivity to complex disease phenotypes for clinical and translational research.11However, unlike the well-established bottom-up phosphoproteomics that has numerous mature phosphopeptide enrichment methods and well-developed LC/MS/MS workflows,17–19 the top-down phosphoproteomics approach is much more challenging mainly due to the lack of phosphoprotein enrichment methods and the difficulties in separation of intact proteins from complex proteome. To address the limitation of low specificity, efficiency, and poor reproducibility on intact protein enrichment,20–23 we recently developed the first generation functionalized superparamagnetic Fe3O4–GAPT-Zn nanoparticles (NPs) for universal and effective enrichment of phosphoproteins from complex mixtures.24 However, further improvement on the NPs and effective downstream analysis including LC separation and MS/MS characterization of enriched phosphoproteins are needed to fully interrogate the complex phosphoproteome.
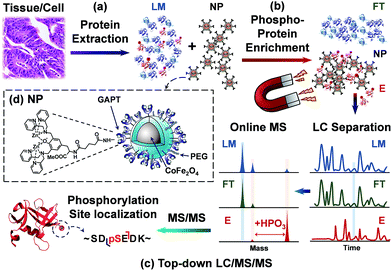
Herein, we sought to develop a robust top-down proteomics workflow for comprehensive phosphoprotein characterization that integrates highly specific intact phosphoprotein enrichment by the next generation cobalt ferrite (CoFe2O4) NPs with high resolution online LC/MS/MS analysis (Fig. 1). In this top-down phosphoproteomics workflow, proteins are first extracted from tissue homogenate (or cell lysate), and subsequently incubated with functionalized superparamagnetic NPs (Fig. 1a). At a neutral pH, the ligands functionalized on the NP surface bound strongly to phosphate groups of the phosphoproteins, preserving their physiological condition (Fig. 1b). After a magnetic pull down of the phosphoprotein-bound NPs, elution of the phosphoproteins from NPs (as well as the pre-enrichment samples) are then subjected to online LC separation and MS analysis of the intact proteins. The enriched phosphorylated species are selected for tandem MS for identification and characterization (Fig. 1c). For the first time, we have shown that this integrated top-down phosphoproteomics strategy allows for highly specific enrichment, identification, quantification, and comprehensive characterization of low abundance endogenous phosphoproteins from complex tissue extracts on a chromatographic time scale.
Results and discussion
Synthesis, characterization, and evaluation of CoFe2O4 NPs for intact phosphoprotein enrichment
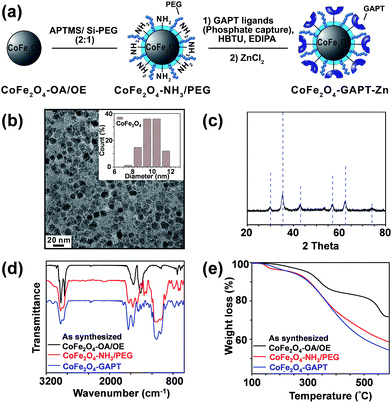
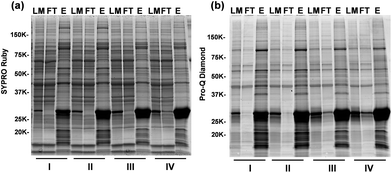
We have designed and synthesized the cobalt ferrite (CoFe2O4) NPs (Fig. 1d and 2a) with stronger magnetic response25,26 and better reproducibility for intact phosphoprotein enrichment than the first generation Fe3O4–GAPT-Zn NPs.24 We synthesized the CoFe2O4 NPs capped with oleic acid (OA) and oleylamine (OE) ligands by a seed-mediated growth method (see experimental details in ESI and Fig. S1†) following the procedure reported by Sun et.al.27 Transmission electron microscopy (TEM) image analysis revealed that the diameter of the CoFe2O4 NPs was ∼9.96 ± 1.03 nm (Fig. 2b). Powder X-ray diffraction confirmed a typical ferrite diffraction pattern28 (Fig. 2c). The CoFe2O4 NPs have been shown to possess larger magnetic moments and magnetic anisotropy and good chemical stability.25,26 These NPs were subsequently functionalized with dinuclear Zn(II)-dipicolylamine (Zn-DPA) ligands coupled to glutaric acid (hereafter referred to as GAPT), based on the previously reported method with minor modifications (Fig. 2a).24 These GAPT-Zn complexes provide the specific binding to the phosphate ions on phosphoproteins and are the key to the enrichment.24,29 Notably, the step that replaces the hydrophobic OA and OE ligands on the CoFe2O4 NP surface with 3-aminopropyl trimethoxy silane (APTMS) and 2-methoxyl (polyethyleneoxy) propyl trimethoxysilane (hereafter referred to as Si-PEG) was completed within 24 h, which was greatly improved compared to 48 h for the preparation of Fe3O4–NH3/PEG NPs.24 We then coupled GAPT ligands, the phosphate capturing moiety, to the free amino groups of the APTMS on CoFe2O4–NH3/PEG NPs, producing CoFe2O4–GAPT NPs. Fourier transform infrared spectroscopy (FTIR) indicating strong band around 1147–1028 cm−1, peaks around 1200 cm−1 (Si–O-R, C–O–C, EO CH2), and sharp peak around 1650 cm−1 for CoFe2O4–GAPT (amide bond), and thus confirmed the proper functionalization of the NPs with the ligand molecules (Fig. 2d).30 Additionally, thermogravimetric analysis (TGA) showed different weight loss (%) for each surface-modified CoFe2O4 NPs with the corresponding ligand molecules (Fig. 2e). The small size of the CoFe2O4 NPs provides advantages such as a high surface-to-volume ratio, easy surface functionalization with multivalent ligand molecules to interact with phosphoprotein targets; better penetrations in complex mixture for higher binding rate without causing denaturation; and good solubility.31–33After activation of CoFe2O4–GAPT NPs with 10 mM ZnCl2, the resulting CoFe2O4–GAPT-Zn NPs (Fig. 1d) were used for phosphoprotein enrichment. The protein samples prior to NP enrichment were termed loading mixture (LM); unbound non-phosphoproteins were collected as flow-through (FT); and enriched phosphoproteins were saved as elution (E) for further analysis (Fig. 1c). The optimized enrichment procedure includes a HEPES buffer (50 mM, pH 7.7, 150 mM NaCl) for binding and subsequent washing, and a sodium phosphate (Na2HPO4) buffer (100 mM, pH 7.3, 50 mM NaCl) for final elution. A standard protein mixture was used to validate the enrichment efficacy of each batch of NPs (details in ESI, Fig. S2a and b†). We further sought to quantitatively determine the enrichment performance by spiking in low levels of β-casein as an internal control in a highly complex swine heart tissue extract. We systematically decreased the concentration of the spike-in β-casein from 0.1 to 0.03 μg μL−1. 10 μg of equal amount of proteins before and after enrichment of the tissue extract containing about 3% (I), 5% (II), 7% (III), and 10% (IV) w/w % of β-casein (Table S1†) was prepared as loading mixtures. SDS-PAGE analysis was performed (Fig. 3a and b, and S3†) paralleled to the top-down LC/MS analysis (vide infra).
Overall, the enrichment was consistent and reproducible across all samples with different amounts of spike-in β-casein. Abundant non-phosphoproteins in LM were effectively depleted and washed into FT, as shown in the nearly identical bands between LM and FT (Fig. 3a). In contrast to LM and FT, the highly similar band patterns in the elution (E) lanes of the gel stained by Sypro Ruby and ProQ Diamond (Fig. 3a and b) indicates the predominance of enriched endogenous phosphoproteins in addition to β-casein. These results demonstrated that CoFe2O4–GAPT-Zn NPs can efficiently enrich phosphoproteins from complex biological samples with high specificity and sensitivity.
Top-down LC/MS analysis of spike-in β-casein from tissue extract after CoFe2O4 NPs enrichment
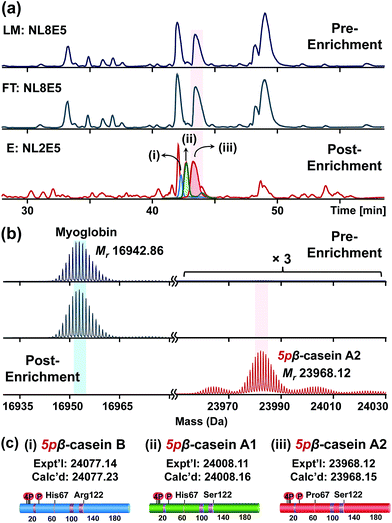
For the top-down proteomic analysis after NP enrichment, an equal amount of proteins from LM, FT, and E that were acquired from the tissue extract with 5% of β-casein spike-in was subjected to reverse phase chromatography (RPC) LC/MS and LC/MS/MS analyses using a Waters M-class UPLC and a Bruker maXis II Q-TOF mass spectrometer (details in ESI†). The robust LC/MS platform allows direct comparison across the base peak chromatograms (BPC) of LM, FT, and E (Fig. 4a). The overlapping separation pattern between LM and FT (Fig. 4a and S4†) demonstrates that the majority of the proteins from LM were washed off to FT, consistent with the SDS-PAGE band patterns (Fig. S3†). Subsequent MS analysis revealed that most proteins in the LM and FT solutions are highly abundant non-phosphoproteins, including blood proteins such as hemoglobin subunit α and β, which were significantly depleted after enrichment (Fig. S5 and S6†). Even though some blood proteins were still detected in MS from elution, significant depletion of highly abundant non-phosphoproteins in LM enabled us to detect low abundance phosphoproteins in E, which are reflected as low abundance peaks in the BPC for E. For example, the deconvoluted spectrum shows that the spike-in β-casein was barely detectable in LM and FT solutions because of the predominant signal from the co-eluting myoglobin (Fig. 4b). However, after enrichment using CoFe2O4–GAPT-Zn NPs, β-casein (Mr 23![[thin space (1/6-em)]](https://www.rsc.org/images/entities/char_2009.gif) 968.12) was significantly enriched while the intensity of myoglobin (Mr 16
968.12) was significantly enriched while the intensity of myoglobin (Mr 16![[thin space (1/6-em)]](https://www.rsc.org/images/entities/char_2009.gif) 942.86) was greatly decreased (Fig. 4b). The enrichment factor was estimated by comparing the relative percentage of β-casein before and after the enrichment. The relative percentage of β-casein was significantly increased from 0.5% to 94% from the complex mixture after enrichment. Moreover, the pure spike-in β-casein standard were separated into three distinct LC peaks in E after enrichment, as seen in the BPC and extracted ion chromatogram labeled as (i), (ii), and (iii) in Fig. 4a. None of these were detectable prior to enrichment in LM. The deconvoluted mass spectra revealed three genetic variants of β-casein,34 B (Mr 24
942.86) was greatly decreased (Fig. 4b). The enrichment factor was estimated by comparing the relative percentage of β-casein before and after the enrichment. The relative percentage of β-casein was significantly increased from 0.5% to 94% from the complex mixture after enrichment. Moreover, the pure spike-in β-casein standard were separated into three distinct LC peaks in E after enrichment, as seen in the BPC and extracted ion chromatogram labeled as (i), (ii), and (iii) in Fig. 4a. None of these were detectable prior to enrichment in LM. The deconvoluted mass spectra revealed three genetic variants of β-casein,34 B (Mr 24![[thin space (1/6-em)]](https://www.rsc.org/images/entities/char_2009.gif) 077.14); (i), A1 (Mr 24
077.14); (i), A1 (Mr 24![[thin space (1/6-em)]](https://www.rsc.org/images/entities/char_2009.gif) 008.11); (ii), and A2 (Mr 23
008.11); (ii), and A2 (Mr 23![[thin space (1/6-em)]](https://www.rsc.org/images/entities/char_2009.gif) 968.12); (iii) based on their accurate mass measurement (Fig. 4c and S7†). Although the genetic variants of β-casein differ by only one or two amino acid residues, all three proteoforms were unbiasedly enriched by the NPs and separated from the complex tissue extract using top-down LC/MS. Furthermore, the top-down approach allowed us to quantify the relative percentage of each β-casein proteoform, which would be difficult using the bottom-up MS strategy. The relative percentages among A2, A1, and B variants were determined to be 53%, 35% and 12% respectively, according to the average spectrum across the same time frame (Fig. S8†).
968.12); (iii) based on their accurate mass measurement (Fig. 4c and S7†). Although the genetic variants of β-casein differ by only one or two amino acid residues, all three proteoforms were unbiasedly enriched by the NPs and separated from the complex tissue extract using top-down LC/MS. Furthermore, the top-down approach allowed us to quantify the relative percentage of each β-casein proteoform, which would be difficult using the bottom-up MS strategy. The relative percentages among A2, A1, and B variants were determined to be 53%, 35% and 12% respectively, according to the average spectrum across the same time frame (Fig. S8†).
Top-down LC/MS/MS characterization of endogenous phosphoproteins enriched from tissue extract by CoFe2O4 NPs
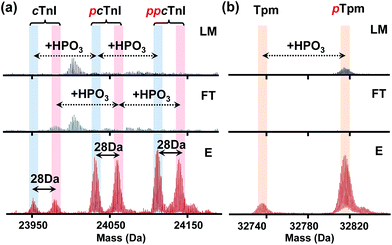
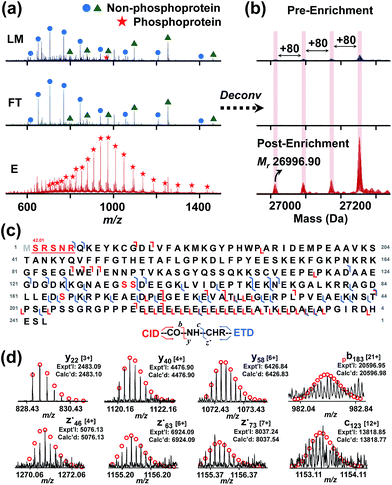
Furthermore, through this integrated top-down phospho-proteomics strategy, we have detected and examined multiple known cardiac phosphoproteins7 from the eluted phosphoproteins that were previously undetected or in very low abundance in the HEPES extraction without enrichment (Fig. 5). The enrichment of the phosphoproteins is apparent by comparing phosphorylation level changes across the same time frame in the LC/MS of LM, FT, and E. Notably, as shown in the normalized deconvoluted spectra in Fig. 5a, phosphorylated forms of pig cardiac troponin I (24 kDa) with a possible V116A polymorphism (28 Da) were all enriched, which was consistent with what we previously found on the same protein using immunoaffinity purification.35 Western blot analysis for phosphorylated cardiac troponin I at Ser22/23 further demonstrated the enrichment (Fig. S9†), which well correlates with the MS data. Nevertheless, the top-down approach in this case offers a global view of each of these highly similar phosphorylated polymorphic species. Similarly, phosphorylated tropomyosin (33 kDa) was also enriched and can be characterized after enrichment (Fig. 5b).More importantly, in addition to the previously known myofilament proteins, we were able to discover low abundance endogenous phosphoproteins using this integrated strategy. One example is a potential phosphoprotein (27 kDa) eluting around 33.5 min that was significantly enriched so that the triply phosphorylated form became the most intense peak/base peak (Fig. 6a). The deconvoluted spectrum further shows that the protein with Mr 26![[thin space (1/6-em)]](https://www.rsc.org/images/entities/char_2009.gif) 996.90 has 80 Da mass increases, corresponding to multiple phosphorylated forms of the protein (Fig. 6b). As seen in both the original and the deconvoluted spectra, the triply phosphorylated form was of very low abundance in LM of the heart tissue extract, but after enrichment, its intensity improved more than 10 folds (Fig. 6a and b). Moreover, nearly no detection of the phosphorylated forms in FT spectra demonstrates sufficient capturing ability of the CoFe2O4–GAPT NPs. Since the triply phosphorylated form became the base peak after enrichment, subsequent LC/MS/MS was made possible through both collision-induced dissociation (CID) and electron transfer dissociation (ETD).
996.90 has 80 Da mass increases, corresponding to multiple phosphorylated forms of the protein (Fig. 6b). As seen in both the original and the deconvoluted spectra, the triply phosphorylated form was of very low abundance in LM of the heart tissue extract, but after enrichment, its intensity improved more than 10 folds (Fig. 6a and b). Moreover, nearly no detection of the phosphorylated forms in FT spectra demonstrates sufficient capturing ability of the CoFe2O4–GAPT NPs. Since the triply phosphorylated form became the base peak after enrichment, subsequent LC/MS/MS was made possible through both collision-induced dissociation (CID) and electron transfer dissociation (ETD).
We confidently identified this protein as hepatoma-derived growth factor (UniProtKB/Swiss-Prot, F1RHJ2_PIG) using MS-Align+36,37 search algorithm (Fig. S10†), which was previously uncharacterized and unreviewed. We further analyzed the data and mapped the sequence using MASH suite Pro.37 Three potential phosphorylation sites were determined: Ser132, Ser133, and Ser165 (red letters in Fig. 6c and S11†). Top-down MS/MS not only revealed an N-terminal methionine excision, but also a coexisting acetylation near the N-terminal in addition to the three phosphorylations. As another example, a protein with Mr 21![[thin space (1/6-em)]](https://www.rsc.org/images/entities/char_2009.gif) 675.63 with a mass increase of 80 Da was significantly enriched and detected in E (Fig. S12a†), while it was nearly unobservable in LM and FT. In the normalized original mass spectra in Fig. S12a,† the non-phosphoprotein with Mr 20
675.63 with a mass increase of 80 Da was significantly enriched and detected in E (Fig. S12a†), while it was nearly unobservable in LM and FT. In the normalized original mass spectra in Fig. S12a,† the non-phosphoprotein with Mr 20![[thin space (1/6-em)]](https://www.rsc.org/images/entities/char_2009.gif) 827.56 was fully depleted, and the phosphorylated protein Mr 21
827.56 was fully depleted, and the phosphorylated protein Mr 21![[thin space (1/6-em)]](https://www.rsc.org/images/entities/char_2009.gif) 675.63 + 80 Da was enriched more than 10 folds, demonstrating the specificity of this NP-based enrichment and the efficacy of this integrated strategy. MS-Align + search identified the proteins to be chromobox protein homolog 1 (UniProtKB/Swiss-Prot, F1RWH1_PIG) based on both the CID and ETD spectra acquired from LC/MS/MS and we narrowed down the possible phosphorylation site to Ser89/Ser91 (Fig. S12 and S13†). Similarly, we enriched and identified a 14 kDa singly phosphorylated protein, programmed cell death protein 5 (UniProtKB/Swiss-Prot, F1RNX2_PIG) (Fig. S14 and S15†). Interestingly, even though phosphorylation is known as a labile PTM, many of the phosphorylations were preserved during CID LC/MS/MS (Fig. 6d, S12d and S16†). For instance, from the phosphoprotein with Mr 21
675.63 + 80 Da was enriched more than 10 folds, demonstrating the specificity of this NP-based enrichment and the efficacy of this integrated strategy. MS-Align + search identified the proteins to be chromobox protein homolog 1 (UniProtKB/Swiss-Prot, F1RWH1_PIG) based on both the CID and ETD spectra acquired from LC/MS/MS and we narrowed down the possible phosphorylation site to Ser89/Ser91 (Fig. S12 and S13†). Similarly, we enriched and identified a 14 kDa singly phosphorylated protein, programmed cell death protein 5 (UniProtKB/Swiss-Prot, F1RNX2_PIG) (Fig. S14 and S15†). Interestingly, even though phosphorylation is known as a labile PTM, many of the phosphorylations were preserved during CID LC/MS/MS (Fig. 6d, S12d and S16†). For instance, from the phosphoprotein with Mr 21![[thin space (1/6-em)]](https://www.rsc.org/images/entities/char_2009.gif) 755.59, py121 ion was predominantly observed whereas its unphosphorylated counterpart y121 existed in low abundance (Fig. S16†). The globular structure of intact proteins preserves the labile phosphorylation to some degree.16 Other enriched phosphoproteins with observable 80 Da mass difference were also detected in the comparison among LM, FT, and E (Fig. S17†). These results in the identification and characterization of new phosphoproteins not only validated the enrichment performance of the CoFe2O4–GAPT-Zn NPs but also demonstrated the power of this integrated top-down phosphoproteomics workflow.
755.59, py121 ion was predominantly observed whereas its unphosphorylated counterpart y121 existed in low abundance (Fig. S16†). The globular structure of intact proteins preserves the labile phosphorylation to some degree.16 Other enriched phosphoproteins with observable 80 Da mass difference were also detected in the comparison among LM, FT, and E (Fig. S17†). These results in the identification and characterization of new phosphoproteins not only validated the enrichment performance of the CoFe2O4–GAPT-Zn NPs but also demonstrated the power of this integrated top-down phosphoproteomics workflow.
Conclusions
In summary, we have developed a top-down phosphoproteomics strategy that integrates NP-based phosphoprotein enrichment and online LC/MS/MS to enrich, identify, quantify, and characterize phosphoproteins from complex protein mixtures. We have designed and synthesized functionalized magnetic CoFe2O4–GAPT-Zn NPs with stronger magnetic response and much improved robustness and reproducibility in synthetic steps. The high specificity and efficiency of phosphoprotein enrichment using these improved CoFe2O4–GAPT-Zn NPs was validated by SDS-PAGE analysis with phosphoprotein-specific gel stains using β-casein spike-in tissue extract. Top-down LC/MS results demonstrated that the spike-in phosphorylated β-casein was substantially enriched (relative percent from 0.5% to 94%), which allowed us to further separate, identify, and quantify all of its genetic variants. More importantly, through online top-down LC/MS/MS with CID and/or ETD, we were able to identify endogenous phosphoproteins and localize their potential phosphorylation sites. Benefiting from the unique NP-based enrichment method, this integrated online top-down LC/MS/MS workflow has the advantages of globally observing phosphorylated proteoforms; quantifying proteoform species; and identifying and characterizing phosphoproteins with co-existing PTMs and/or sequence variants. We envision that with further advances in front-end intact protein separation,38 MS detection of large proteins (>30 kDa), and MS/MS fragmentation techniques39,40 with improved throughput, this top-down phosphoproteomics strategy that couples functionalized NP-based phosphoprotein enrichment with online LC/MS/MS has the potential to enable a deep coverage and comprehensive characterization of the phosphoproteome for the study of molecular mechanism underlying diseases and the discovery of specific phosphoproteoforms as biomarkers.Acknowledgements
This research is supported by R01GM117058 (to SJ and YG). YG would also like to acknowledge NIH R01HL096971, R01HL109810 and S10OD018475. We thank Matt Willetts at Bruker for assistance with Data Analysis scripts. We also thank Albert Chen for preparing for heart tissue lysate.References
- T. Hunter, Cell, 2000, 100, 113–127 CrossRef CAS PubMed.
- S. J. Humphrey, S. B. Azimifar and M. Mann, Nat. Biotechnol., 2015, 33, 990–995 CrossRef CAS PubMed.
- S. G. Julien, N. Dubé, S. Hardy and M. L. Tremblay, Nat. Rev. Cancer, 2011, 11, 35–49 CrossRef CAS PubMed.
- R. E. Banks, M. J. Dunn, D. F. Hochstrasser, J. C. Sanchez, W. Blackstock, D. J. Pappin and P. J. Selby, Lancet, 2000, 356, 1749–1756 CrossRef CAS.
- Z. R. Gregorich and Y. Ge, Proteomics, 2014, 14, 1195–1210 CrossRef CAS PubMed.
- J. Zhang, M. J. Guy, H. S. Norman, Y. C. Chen, Q. G. Xu, X. T. Dong, H. Guner, S. J. Wang, T. Kohmoto, K. H. Young, R. L. Moss and Y. Ge, J. Proteome Res., 2011, 10, 4054–4065 CrossRef CAS PubMed.
- Y. Peng, Z. R. Gregorich, S. G. Valeja, H. Zhang, W. Cai, Y. C. Chen, H. Guner, A. J. Chen, D. J. Schwahn, T. A. Hacker, X. Liu and Y. Ge, Mol. Cell. Proteomics, 2014, 13, 2752–2764 CAS.
- L. M. Smith and N. L. Kelleher, Nat. Methods, 2013, 10, 186–187 CrossRef CAS PubMed.
- K. Sharma, R. C. D'Souza, S. Tyanova, C. Schaab, J. R. Wiśniewski, J. Cox and M. Mann, Cell Rep., 2014, 8, 1583–1594 CrossRef CAS PubMed.
- P. H. Huang and F. M. White, Mol. Cell, 2008, 31, 777–781 CrossRef CAS PubMed.
- N. L. Kelleher, P. M. Thomas, I. Ntai, P. D. Compton and R. D. LeDuc, Expert Rev. Proteomics, 2014, 11, 649–651 CrossRef CAS PubMed.
- B. T. Chait, Science, 2006, 314, 65–66 CrossRef CAS PubMed.
- J. C. Tran, L. Zamdborg, D. R. Ahlf, J. E. Lee, A. D. Catherman, K. R. Durbin, J. D. Tipton, A. Vellaichamy, J. F. Kellie and M. Li, Nature, 2011, 480, 254–258 CrossRef CAS PubMed.
- V. Zabrouskov, Y. Ge, J. Schwartz and J. W. Walker, Mol. Cell. Proteomics, 2008, 7, 1838–1849 CAS.
- W. Cai, T. M. Tucholski, Z. R. Gregorich and Y. Ge, Expert Rev. Proteomics, 2016, 13, 717–730 CrossRef CAS PubMed.
- N. Siuti and N. L. Kelleher, Nat. Methods, 2007, 4, 817–821 CrossRef CAS PubMed.
- N. M. Riley and J. J. Coon, Anal. Chem., 2016, 88, 74–94 CrossRef CAS PubMed.
- L. Xue, W. H. Wang, A. Iliuk, L. Hu, J. A. Galan, S. Yu, M. Hans, R. L. Geahlen and W. A. Tao, Proc. Natl. Acad. Sci. U. S. A., 2012, 109, 5615–5620 CrossRef CAS PubMed.
- B. Bodenmiller, L. N. Mueller, M. Mueller, B. Domon and R. Aebersold, Nat. Methods, 2007, 4, 231–237 CrossRef CAS PubMed.
- Y. Oda, T. Nagasu and B. T. Chait, Nat. Biotechnol., 2001, 19, 379–382 CrossRef CAS PubMed.
- J. Porath, J. Carlsson, I. Olsson and G. Belfrage, Nature, 1975, 258, 598–599 CrossRef CAS PubMed.
- S. R. Schmidt, F. Schweikart and M. E. Andersson, J. Chromatogr. B: Anal. Technol. Biomed. Life Sci., 2007, 849, 154–162 CrossRef CAS PubMed.
- G. Kaur-Atwal, D. J. Weston, P. L. Bonner, S. Crosland, P. S. Green and C. S. Creaser, Curr. Anal. Chem., 2008, 4, 127–135 CrossRef CAS.
- L. Hwang, S. Ayaz-Guner, Z. R. Gregorich, W. Cai, S. G. Valeja, S. Jin and Y. Ge, J. Am. Chem. Soc., 2015, 137, 2432–2435 CrossRef CAS PubMed.
- M. Sytnyk, R. Kirchschlager, M. I. Bodnarchuk, D. Primetzhofer, D. Kriegner, H. Enser, J. Stangl, P. Bauer, M. Voith and A. W. Hassel, Nano Lett., 2013, 13, 586–593 CrossRef CAS PubMed.
- Z. Gu, X. Xiang, G. Fan and F. Li, J. Phys. Chem. C, 2008, 112, 18459–18466 CAS.
- S. Sun, H. Zeng, D. B. Robinson, S. Raoux, P. M. Rice, S. X. Wang and G. Li, J. Am. Chem. Soc., 2003, 126, 273–279 CrossRef PubMed.
- B. Bateer, C. Tian, Y. Qu, S. Du, Y. Yang, Z. Ren, K. Pan and H. Fu, Dalton Trans., 2014, 43, 9885–9891 RSC.
- E. Kinoshita, E. Kinoshita-Kikuta, K. Takiyama and T. Koike, Mol. Cell. Proteomics, 2006, 5, 749–757 CAS.
- R. De Palma, S. Peeters, M. J. Van Bael, H. Van den Rul, K. Bonroy, W. Laureyn, J. Mullens, G. Borghs and G. Maes, Chem. Mater., 2007, 19, 1821–1831 CrossRef CAS.
- M.-E. Aubin-Tam and K. Hamad-Schifferli, Biomed. Mater., 2008, 3, 034001 CrossRef PubMed.
- Y. Pan, X. Du, F. Zhao and B. Xu, Chem. Soc. Rev., 2012, 41, 2912–2942 RSC.
- Y. Pan, M. J. Long, H.-C. Lin, L. Hedstrom and B. Xu, Chem. Sci., 2012, 3, 3495–3499 RSC.
- S. Wu, F. Yang, R. Zhao, N. Tolic, E. W. Robinson, D. G. Camp, R. D. Smith and L. Pasa-Tolic, Anal. Chem., 2009, 81, 4210–4219 CrossRef CAS PubMed.
- J. A. Zhang, X. T. Dong, T. A. Hacker and Y. Ge, J. Am. Soc. Mass Spectrom., 2010, 21, 940–948 CrossRef CAS PubMed.
- X. W. Liu, Y. Sirotkin, Y. F. Shen, G. Anderson, Y. S. Tsai, Y. S. Ting, D. R. Goodlett, R. D. Smith, V. Bafna and P. A. Pevzner, Mol. Cell. Proteomics, 2012, 11, M111.008524 Search PubMed.
- W. X. Cai, H. Guner, Z. R. Gregorich, A. J. Chen, S. Ayaz-Guner, Y. Peng, S. G. Valeja, X. W. Liu and Y. Ge, Mol. Cell. Proteomics, 2016, 15, 703–714 CAS.
- S. G. Valeja, L. Xiu, Z. R. Gregorich, H. Guner, S. Jin and Y. Ge, Anal. Chem., 2015, 87, 5363–5371 CrossRef CAS PubMed.
- J. B. Shaw, W. Li, D. D. Holden, Y. Zhang, J. Griep-Raming, R. T. Fellers, B. P. Early, P. M. Thomas, N. L. Kelleher and J. S. Brodbelt, J. Am. Chem. Soc., 2013, 135, 12646–12651 CrossRef CAS PubMed.
- K. L. Fort, A. Dyachenko, C. M. Potel, E. Corradini, F. Marino, A. Barendregt, A. A. Makarov, R. A. Scheltema and A. J. Heck, Anal. Chem., 2016, 88, 2303–2310 CrossRef CAS PubMed.
Footnotes |
| † Electronic supplementary information (ESI) available: Material and methods, characterization of the NPs, and top-down MS. See DOI: 10.1039/c6sc05435h |
| ‡ These authors contributed equally to this work. |
| This journal is © The Royal Society of Chemistry 2017 |

