 Open Access Article
Steric effect on Li+ coordination and transport properties in polyoxetane-based polymer electrolytes bearing nitrile groups†
Ryansu Saia,
Kazuhide Ueno *b,
Kenta Fujii
 a,
Yohei Nakano‡
a and
Hiromori Tsutsumi*a
aDepartment of Applied Chemistry, Graduate School of Sciences and Technology for Innovation, Yamaguchi University, 2-16-1 Tokiwadai, Ube, 755-8611, Japan. E-mail: tsutsumi@yamaguchi–u.ac.jp; Fax: +81-836-85-9282/9201; Tel: +81-836-85-9282/9201
bDepartment of Chemistry and Biotechnology, Yokohama National University, 79-5 Tokiwadai, Hodogaya-ku, Yokohama, 240-8501, Japan. E-mail: ueno–kazuhide–rc@ynu.ac.jp; Fax: +81-45-339-3951; Tel: +81-45-339-3951
First published on 1st August 2017
Abstract
Polymer electrolytes (PEs) that consist of polyoxetane with nitrile side chains and lithium bis(trifluoromethanesulfonyl)amide were studied as electrolytes for Li secondary batteries. Our previous study showed that Li+ ion coordination with the polar nitrile groups tethered to the main chain plays a crucial role in enhancing the Li+ ion transport properties in poly(3-(2-cyanoethoxymethyl)-3-ethyloxetane) (PCEO). Herein, we report the effects of the absence of ethyl groups on the main chain of PCEO on Li+ ion coordination, thermal properties, and ionic transport, by employing a structural analog, poly(3-(2-cyanoethoxymethyl)-oxetane). We found that the steric hindrance derived from the ethyl groups in PCEO resulted in more-pronounced Li+ coordination with the nitrile side chains, and thereby more effective Li+ ion transport was achieved. We also demonstrated successful charge/discharge cycling of a Li/LiFePO4 cell using nitrile-functionalized PE.
1. Introduction
There has been much effort to develop solid-state electrolytes, including inorganic and polymeric electrolytes, with high ionic conductivities as alternatives to liquid electrolytes in electrochemical devices.1,2 Recent breakthroughs in inorganic solid electrolytes have remarkably improved the conductivity, which is now comparable to or even higher than that of liquid electrolytes.3 This has led to a burgeoning field of study for all-solid-state lithium-ion batteries with high energy and power densities, long cycle lives, and safety for use in automotive and other large-scale energy storage.4 Meanwhile, the ionic conductivities of polymer electrolytes (PEs) are less than those of liquid electrolytes by orders of magnitude, and they are still insufficient for practical battery applications despite numerous studies.5 Alternatively, PEs have several advantageous properties over inorganic solid electrolytes.6 Their inherent flexibility and processability enable formation of more effective electrode/electrolyte interfaces in the composite electrodes of batteries, which is a challenge in all-solid-state batteries that use solid ceramic electrolytes.7 Flexible PEs would be more tolerant to electrode volume changes during charge/discharge (especially for conversion reactions). Moreover, PEs generally possess higher stabilities than many of the solid ceramic electrolytes at low potentials for negative electrodes, such as lithium metal.The most well-studied lithium-conductive PEs have been based on a binary mixture of poly(ethylene oxide) (PEO) and lithium salts since ionic conduction was first reported for alkali metal salts dissolved in PEO,8 whereby polyether chains form a complex with metal cations.9 The migration of metal cations is strongly coupled with the segmental motion of the polyether chains; thus, PEO-based PEs generally show low ionic conductivities. To improve the ionic conduction in PEs, many types of modified polymer matrices, such as random copolymer, block copolymer, comb-type copolymer, and polymer blends, have been studied.6 Polyoxetanes are polyethers that contain trimethylene oxide units and can also be used as a polymer matrix for PEs.10–12 PEs based on polyoxetanes with polar side chains, such as nitrile groups and phosphate ester groups, were reported.13–15 The increase in glass transition temperature (Tg) associated with complexation with Li+ ions, which is a typical behavior for PEs, does not occur in poly(3-(2-cyanoethoxymethyl)-3-ethyloxetane) (PCEO); rather, Tg decreases with increasing salt concentration.16 This could be caused by steric hindrance of the ethyl groups on the main chain and preferential Li+ ion coordination with the nitrile side chains. We confirmed that Li+ ion coordination with the nitrile groups in PCEO is responsible for improving the ionic transport properties of the PEs.17
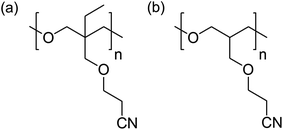
In this study, poly(3-(2-cyanoethoxymethyl)-oxetane) (PCHO) was newly synthesized. The only difference between PCEO and PCHO is the absence of an ethyl group on the polyoxetane main chain. To clarify the contribution of the ethyl group to the electrolyte properties such as the ionic conductivity (σ) and lithium transference number (tLi+), PCHO complexed with lithium bis(trifluoromethanesulfonyl)amide (LiTFSA) were evaluated and were compared with previously reported PCEO electrolytes.17 Here, we verified that subtle changes in the chemical structure of the repeating monomer unit of the polyoxetane-based PEs (i.e., the presence or absence of the ethyl group on the main chain) greatly affected the thermal properties and ionic transport, which were well correlated with different Li+ ion coordination structures studied by Raman spectroscopy. A Li/LiFePO4 cell was fabricated and its charge/discharge behavior was examined to demonstrate the applicability of the polyoxetane-based PEs to lithium secondary batteries.
2. Experimental section
2.1 Preparation of the monomer
An oxetane derivative, 3-(2-cyanoethoxymethyl)-oxetane (CHO), was synthesized by Michael addition. 3-Oxetanemethanol (5.64 mL, 70.0 mmol) and acrylonitrile (5.24 mL, 80.0 mmol) were mixed with a 20% tetraethylammonium hydroxide solution (0.6 mL) as a catalyst in pure water (3 mL), then stirred at room temperature overnight. The reaction mixture was extracted with chloroform, and the organic phase was washed with a large amount of water. After removal of chloroform by a rotary evaporator, the obtained liquid was applied to a silica column (eluent = ethyl acetate![[thin space (1/6-em)]](https://www.rsc.org/images/entities/char_2009.gif) :
:![[thin space (1/6-em)]](https://www.rsc.org/images/entities/char_2009.gif) hexane, 7
hexane, 7![[thin space (1/6-em)]](https://www.rsc.org/images/entities/char_2009.gif) :
:![[thin space (1/6-em)]](https://www.rsc.org/images/entities/char_2009.gif) 3). The product was obtained by removing the eluent and vacuum drying at 60 °C (yield: 3.54 g, 35.9%). The synthesized CHO was characterized using time-of-flight mass spectrometry, and 1H and 13C nuclear magnetic resonance (NMR) spectroscopy. The density of the monomer was 1.068 g cm−3.
3). The product was obtained by removing the eluent and vacuum drying at 60 °C (yield: 3.54 g, 35.9%). The synthesized CHO was characterized using time-of-flight mass spectrometry, and 1H and 13C nuclear magnetic resonance (NMR) spectroscopy. The density of the monomer was 1.068 g cm−3.
CHO 1H NMR (δ, ppm from tetramethylsilane (TMS) in CDCl3): 2.62 (t, 2H, J = 6.00 Hz, –CH2–CN), 3.24 (sep., 1H, J = 5.8 Hz, –(CH2)3–CH), 3.70 (t, 2H, J = 6.0 Hz, –CH2–CH2–CN), 3.75 (d, 2H, J = 7.0 Hz, –CH–CH2–O–), 4.46 (t, 2H, J = 6.3 Hz, ring, –CH2–O–CH2–), 4.81 (dd, 2H, J = 1.0 Hz, 6.0 Hz, ring, –CH2–O–CH2–).
CHO 13C NMR (δ, ppm from TMS in CDCl3): 18.52 (–CH2–CN), 34.45 ((CH2)2–CH2–CH3), 65.39 (–CH2–CH2–CN), 72.34 (–CH–CH2–O–), 74.03 (–CH2–O–CH2–), 117.61 (–CN).
2.2 Preparation of the polymer
CHO was polymerized by a ring-opening cationic polymerization using BF3·Et2O as a cationic initiator. CHO (2.42 mL, 18.3 mmol) and the initiator (50.2 μL, 0.400 mmol) were dissolved in dichloroethane (total volume: 5 mL). The polymerization was performed under an Ar atmosphere at 0 °C for 6 h in a salt ice bath. The reaction was quenched with the addition of aqueous 4 M NaCl/1 M NaOH (5 mL). The reaction mixture was added to chloroform, and the solution was washed with water. After removing chloroform using a rotary evaporator, the mixture was poured into a large amount of 2-propanol to precipitate the polymerized CHO (PCHO). The resulting polymer was collected by filtration and dried at 100 °C under vacuum (yield: 2.17 g, 84.1%). The chemical structures of PCEO (reported in our previous study) and PCHO are shown in Fig. 1.PCHO 1H NMR (δ, ppm from TMS in CDCl3): 2.15 (quin., 1H, J = 5.9 Hz, (CH2)3–CH), 2.61 (t, 2H, J = 6.3 Hz, –CH2–CN), 3.43 (m, 4H, –O–CH2–CH–), 3.53 (d, 2H, J = 6.0 Hz, –CH–CH2–O–), 3.64 (t, 2H, J = 6.0 Hz, –CH2–CH2–CN).
PCHO 13C NMR (δ, ppm from TMS in CDCl3): 18.85 (–CH2–CN), 40.20 ((CH2)3–CH), 65.63 (–CH2–CH2–CN), 69.29 (–CH–CH2–O–), 69.38 (–CH2–O–CH–), 118.13 (–CN).
2.3 Preparation of polymer electrolytes
The PEs were prepared using a solvent casting method. PCHO and 1 M LiTFSA in a tetrahydrofuran (THF) solution were mixed and then heated under vacuum to completely remove THF. In this report, the molar ratio of the repeating monomer unit to LiTFSA is represented as “a” (a = 40, 30, 20, 10, 5, and 3) for PCHOaLiTFSA. The concentrations of LiTFSA (cLi) in PCHOaLiTFSA were estimated using the corresponding monomer density (1.068 g cm−3) and the reported density of molten LiTFSA (1.970 g cm−3).18 The high temperature data for the density of molten LiTFSA were extrapolated to room temperature. We assumed the additivity of the volumes of the monomers and LiTFSA when calculating the density of the PEs.2.4 Measurements
1H and 13C NMR spectra of the synthesized substances were recorded using a Fourier transform NMR spectrophotometer (JNM-LA500, JEOL). The molecular weight of the polymer was measured using a gel permeation chromatography (GPC) system (SCL-10AVP, LC-10ADVP, DGU-12A, CTO-10AVP, and RID-10A, Shimadzu). GPC was performed using THF as the elution solvent and polystyrene standards to calibrate the columns.A differential scanning calorimeter (DSC7020, HITACHI) was used to determine the glass transition temperature (Tg). A small amount of the PEs (∼10 mg) was hermetically sealed in an aluminum differential scanning calorimetry (DSC) pan. The samples were heated to 120 °C, cooled to −120 °C, and heated again to 120 °C at a heating/cooling rate of 10 °C min−1. The second heating scan was recorded as the DSC thermogram of the samples. Tg was determined as the onset of the heat flow step.
The ionic conductivity of the PEs was measured by ac impedance spectroscopy using a potentio/galvanostat (SP-150, BioLogic). The PE was placed between two stainless steel electrodes and separated by a polytetrafluoroethylene ring spacer; the conductivity cell (swagelok cell) was thermally equilibrated in a temperature cabinet (LU-14, ESPEC) at each temperature (temperature range: 20–90 °C) for 1 h before the measurements. The conductivity values were calculated using the thickness and inner diameter of the ring spacer filled with the PEs.
Raman spectra of the PEs were measured using a laser Raman spectrophotometer (NRS-3100, JASCO) with a 532 nm laser. The PE was sealed between two glass plates with a rubber spacer (thickness: 5 mm) in an Ar-filled glove box to avoid moisture adsorption. Raman spectra of PCHOaLiTFSA were measured from 500–2400 cm−1 with a resolution of 4 cm−1. The obtained spectra were normalized with respect to the methylene vibration of polyoxetanes (1390–1520 cm−1) and were analyzed using commercial software for peak fitting (PeakFit™ version 4.12, SYSTAT). A pseudo-Voigt function was used for peak deconvolution.
The transference numbers of Li ions (tLi+) in PCHO5LiTFSA and PCEO5LiTFSA (the sample reported in the previous report,17 Mn = 4.56 × 10⁴ g mol−1) were determined using the electrochemical method proposed by Bruce and Vincent.19 The required parameters were obtained using potentiostatic polarization and ac impedance spectroscopy with a potentio/galvanostat (SP-150, BioLogic). The PE was placed between two lithium foil electrodes that were separated by a polypropylene spacer, and the cell was stored in a temperature cabinet (LU-114, ESPEC) at 50 °C for several days to stabilize the symmetric cell. Then, impedance spectra were measured prior to the potentiostatic polarization. The current was monitored while a potentiostatic polarization was applied to the cell with a potential step of 10 mV. After a steady current was observed, impedance spectra were measured again. The following equation gives the transference number,
| tLi+ = [Iss(ΔV − I0R0)]/[I0(ΔV − IssRss)] | (1) |
2.5 Charge/discharge test of the Li/PCEO5LiTFSA/LiFePO4 cell
The Li|PCEO5LITFSA|LiFePO4 cell was prepared using the previously reported PE based on PCEO.17 Lithium metal foil (diameter: 10 mm, Honjo Metal Co., Ltd.) was used as the negative electrode. The positive electrode was composed of LiFePO4 as the active material (theoretical capacity: 170 mA h g−1), acetylene black (AB) as the conductive supporting agent, polyvinylidene fluoride (PVdF), and PCEO5LiTFSA as the binder at a weight ratio of LiFePO4![[thin space (1/6-em)]](https://www.rsc.org/images/entities/char_2009.gif) :
:![[thin space (1/6-em)]](https://www.rsc.org/images/entities/char_2009.gif) AB
AB![[thin space (1/6-em)]](https://www.rsc.org/images/entities/char_2009.gif) :
:![[thin space (1/6-em)]](https://www.rsc.org/images/entities/char_2009.gif) PVdF
PVdF![[thin space (1/6-em)]](https://www.rsc.org/images/entities/char_2009.gif) :
:![[thin space (1/6-em)]](https://www.rsc.org/images/entities/char_2009.gif) PCEO5LiTFSA = 75
PCEO5LiTFSA = 75![[thin space (1/6-em)]](https://www.rsc.org/images/entities/char_2009.gif) :
:![[thin space (1/6-em)]](https://www.rsc.org/images/entities/char_2009.gif) 15
15![[thin space (1/6-em)]](https://www.rsc.org/images/entities/char_2009.gif) :
:![[thin space (1/6-em)]](https://www.rsc.org/images/entities/char_2009.gif) 10
10![[thin space (1/6-em)]](https://www.rsc.org/images/entities/char_2009.gif) :
:![[thin space (1/6-em)]](https://www.rsc.org/images/entities/char_2009.gif) 1. The materials were suspended in N-methylpyrrolidone, and the slurry was coated onto a stainless steel (SUS) foil. After drying at 60 °C for 4 h, the electrode was cut into a circular shape (10 mm in diameter) and compressed at 2 kN for 15 min. LiFePO4 was loaded on the electrode (2 mg cm−2). A porous glass filter paper (GA-55, ADVANTEC) was used as a mechanical electrolyte support because the PE used in this study was not self-standing (it was not crystalline and had a low Tg). PCEO5LiTFSA was heated to 130 °C and infiltrated into the glass filter paper under vacuum. A 2032-type coin cell was assembled using the above electrodes and the PE in the Ar-filled glove box.
1. The materials were suspended in N-methylpyrrolidone, and the slurry was coated onto a stainless steel (SUS) foil. After drying at 60 °C for 4 h, the electrode was cut into a circular shape (10 mm in diameter) and compressed at 2 kN for 15 min. LiFePO4 was loaded on the electrode (2 mg cm−2). A porous glass filter paper (GA-55, ADVANTEC) was used as a mechanical electrolyte support because the PE used in this study was not self-standing (it was not crystalline and had a low Tg). PCEO5LiTFSA was heated to 130 °C and infiltrated into the glass filter paper under vacuum. A 2032-type coin cell was assembled using the above electrodes and the PE in the Ar-filled glove box.
A charge/discharge test was performed with a charge–discharge unit (HJ1020mSD8, Hokuto Denko). The temperature of the cell was maintained at 70 °C in an aluminum bath during the charge/discharge test. The rate capability of the cell was investigated by changing the charge–discharge rate (0.05, 0.1, 0.2, 0.5, 1, and 2C). The charging cutoff voltage was set to 3.9 V to avoid electrolyte oxidation, while the discharging cutoff voltage was 2.5 V.
3. Results and discussion
3.1 Thermal properties
Table 1 summarizes the molecular weights (Mn and Mw), polydispersity index (Mw/Mn), and Tg of pure PCHO, as determined from the GPC and DSC measurements. The reported data for PCEO are also listed for comparison. PCEO is a semi-crystalline polymer with a small melting peak at 55 °C and Tg at −18.3 °C.17 Although one may expect that the ethyl group on the main chains of PCEO would sterically hinder chain packing to form a crystalline phase, it rather assisted the formation of a small crystalline domain in PCEO. In contrast, the DSC thermogram of PCHO did not contain an endothermic peak corresponding to the melting of the crystalline domain, suggesting that PCHO is amorphous. The Tg of PCHO is lower than that of PCEO (−18.3 °C), but higher than the reported Tg of plain poly(trimethyl oxide), –(CH2CH2CH2O)n–, (−71 °C).20 The presence of side chains could increase Tg, and PCEO having the nitrile and ethyl side chains showed higher Tg values because of enhanced intermolecular interactions. Considering the thermal behavior, PCHO is expected to be more favorable than PCEO for ion transport because of its non-crystallinity and lower Tg.| Molecular weight | Thermal characteristics | ||||
|---|---|---|---|---|---|
| Mn [g mol−1] | Mw [g mol−1] | Mw/Mn [—] | Tg [°C] | Tm [°C] | |
| PCEO | 4.56 × 10⁴ | 1.08 × 10⁵ | 2.37 | −18.3 | 55.0 |
| PCHO | 2.86 × 10⁴ | 7.94 × 10⁴ | 2.78 | −30.9 | Not observed |
Fig. 2 shows the salt concentration dependence of Tg for PCEOaLiTFSA and PCHOaLiTFSA: Tg of the PEs values were plotted as a function of the molar ratio of possible interaction sites and LiTFSA, ([O] + [CN])/[Li]. For comparison, the reported Tg data of PEOaLiTFSA,21 which is the most widely studied PE for lithium secondary batteries, are also shown in Fig. 2. In PEO-based electrolytes, Tg increases as the salt concentration increases. This is due to ionic cross-linking formed by multi-dentate coordination of the main chain ether groups to Li+ ions, in which the polymer segmental motion is highly restricted. In contrast, we report that the Tg value of PCEO decreases as the salt concentration increases.16,17 This plasticizing effect is due to relaxation of dipole–dipole interactions between the nitrile groups of PCEO in the presence of the Li salt. This plasticization with the addition of Li salt is not limited to PCEO, but has also been reported for polyacrylonitrile,22 and polyethylene carbonate.23 In the context of free volume theory for amorphous materials,24,25 the reduction in Tg by the addition of Li salt implies that the free volume in the system increases upon Li+ ion coordination. This is likely the case because sterically hindered Li+ coordination with the main chains and preferential Li+ coordination with polar side chains would result in a more loosely-packed segmental arrangement.
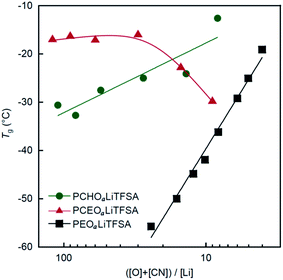 | ||
| Fig. 2 Tg as a function of the molar ratio of possible interaction sites and LiTFSA in the PEs ([O] + [CN])/[Li] for PCHOaLiTFSA, PCEOaLiTFSA, and PEOaLiTFSA. Tg values for PCEOaLiTFSA and PEOaLiTFSA were obtained from ref. 17 and 21, respectively. | ||
For newly synthesized PCHO, Tg increases with increasing salt concentration, although the increase in Tg is gentler than that of PEOaLiTFSA. This suggests that PCHO forms an ionically cross-linked structure in the presence of LiTFSA, but the cross-linking density is not as dense as that in PEOaLiTFSA. The differences in the thermal behavior between PCEOaLiTFSA and PCHOaLiTFSA suggest that the ethyl group on the polyoxetane main chains plays an important role in the Li+ ion coordination structure and the resultant thermal behavior in the PEs. The prepared PEs (PCEOaLiTFSA and PCHOaLiTFSA) were not a rubbery solid, but were a highly viscous solution due to the low crystallinity and the lower Tg. However, a self-standing membrane can be readily formed by introducing robust cross-linking points into the polymers as reported in the literature.26–28
3.2 Ionic conductivity
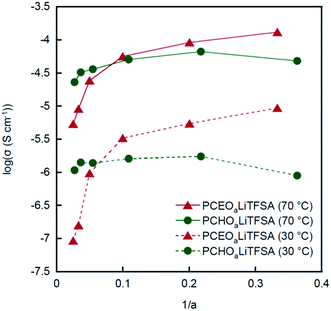
In Fig. 3, the ionic conductivities of PCHOaLiTFSA at 30 °C and 70 °C are plotted as a function of the molar ratio of LiTFSA to the repeating monomer unit, 1/a (relevant to the salt concentration). For comparison, the conductivity data for PCEOaLiTFSA are also shown in the same figure. Furthermore, the molar conductivity is also shown in the ESI (Fig. S1†). At low values of 1/a (i.e., low salt concentration), the ionic conductivity of PCHOaLiTFSA is higher than that of PCEOaLiTFSA. This is attributed to the high mobility of ions in PCHOaLiTFSA. As shown in Fig. 2, a lower Tg value is evidently responsible for the faster segmental motion and the lower local viscosity of PCHOaLiTFSA. The ionic conductivity increases for both PEs with increasing 1/a (i.e., increasing salt concentration), except for PCHOaLiTFSA at the highest 1/a. However, PCHOaLiTFSA shows only a small change in conductivity and a continuous decrease in molar conductivity with increasing 1/a (Fig. S1†). The contribution of the increase in the charge carrier would be negated by the increase in Tg with the addition of Li salt (as shown in Fig. 2), which would account for the marginal change in the conductivity and the decrease in the molar conductivity at higher 1/a. The Li salt concentration dependence of the PCHOaLiTFSA conductivity qualitatively agrees with that for the PEO-based PEs; the change in conductivity and molar conductivity fall within one order of magnitude, which is comparable to that for PEO-based PEs.29,30 Therefore, this typical change is predominantly due to a reduction in mobility by the formation of an ionically cross-linked structure. The ever-increasing conductivity for PCEOaLiTFSA suggests again that the presence of the ethyl group can inhibit the formation of the cross-linked structures by Li+ ion coordination with the ether main chains.The temperature dependent conductivity (σ) was also measured to elucidate the ionic conduction mechanism in PCEOaLiTFSA and PCHOaLiTFSA, as shown in Fig. S2.† The Arrhenius plots of the conductivity show non-linear behavior with a curvature that is generally observed for amorphous PEs, and are well described by an empirical expression in relation to the Vogel–Tammann–Fulcher equation,5
 | (2) |
| Polymer | a | A (S cm−1 K1/2) | B (kJ mol−1) |
|---|---|---|---|
| PCEO | 10 | 1.21 | 7.96 |
| 5 | 3.19 | 8.84 | |
| 3 | 5.75 | 9.49 | |
| PCHO | 40 | 2.21 | 10.7 |
| 30 | 4.97 | 11.5 | |
| 20 | 4.88 | 10.9 | |
| 10 | 9.34 | 11.1 | |
| 5 | 11.9 | 11.6 | |
| 3 | 9.86 | 10.2 |
The A parameter tends to increase with increasing salt concentration in each PE, indicating that the number of effective charge carriers increases with the addition of the Li salt. The A value of PCHOaLiTFSA was higher than that of PCEOaLiTFSA at the same a value. The absence of ethyl groups in PCHO may result in a higher polarity in the PE, which can promote ionic dissociation of the Li salt, leading to the higher A value for PCHOaLiTFSA. PCHOaLiTFSA shows slightly larger values of B than PCEOaLiTFSA, indicating that PCHOaLiTFSA has a little higher activation barrier for ion exchange between the coordination sites in the PEs. This implies that Li+ ion coordination is more stabilized in PCHO than in PCEO, and Li+ ions are more tightly trapped by the multi-dentate polyether groups in PCHOaLiTFSA.
In our previous work, we reported that the parameters A and B for PCEOaLiBF4 and PCEOaLiBF4 show smaller A and larger B values than those of PCEOaLiTFSA at the same a value.15 It seems that the more associative character and smaller size of LiBF4 are responsible for the smaller A value and larger B value. The B value of the PEO-based PEs dramatically changes with respect to the salt concentration and anion species,32 and B = 24 kJ mol−1 was reported for PEO12LiTFSA.33 Hence, the smaller B values of PCEOaLiTFSA and PCHOaLiTFSA than that of the PEO-based PEs suggest that ion migration is promoted more in PCEO and PCHO by preferential Li+ ion coordination with the nitrile side chains.
3.3 Coordination structure of Li+ ions
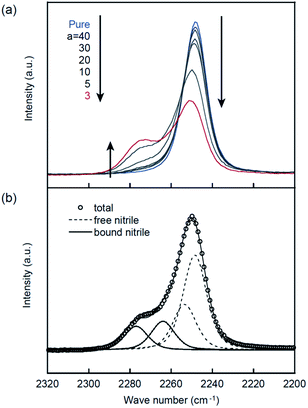
Raman spectroscopic measurements were carried out to investigate the coordination structure formed in PEs. The Raman spectra of the nitrile group (2200–2320 cm−1) is shown in Fig. 4. A symmetric peak that can be assigned to the stretching vibration of nitrile groups is observed at 2249 cm−1 for pure PCHO. However, another peak emerges at higher wavenumber in the presence of LiTFSA. This is indicative of Li+ ion coordination with the nitrile groups in PCHOaLiTFSA. The Raman spectra in this region show an isosbestic point at 2255 cm−1 (except that for PCHO3LiTFSA), indicating that two species (i.e., free and bound nitrile groups) co-exist. Here, each spectrum was further analyzed using the same procedure as that in our previous report,17 and each was deconvoluted into four bands at 2249, 2253, 2264, and 2277 cm−1, as shown Fig. 4b. The peaks at 2249 and 2253 cm−1 are assigned to vibrations of uncoordinated (free) nitrile groups, whereas the peaks at 2264 and 2277 cm−1 are due to nitrile groups bound to Li+ ions. The intensity of a peak at x cm−1 is given as Ix(CN). To quantitatively determine the coordination number of the nitrile group (nCN), the relationship between the slope and intercept of the linear function plotted as If(CN)/cLi vs. a was analyzed using the following relationship,| If(CN)/cLi = Jf(CN)(a − nCN) | (3) |
Fig. 5 shows the result of the linear least-square fitting to eqn (3) for the nitrile group in PCHOaLiTFSA. From the good linear relationship in Fig. 5, we could determine the coordination number of the nitrile group in PCHOaLiTFSA (nCN = 0.81 ± 0.40), which is smaller than the reported nCN of PCEOaLiTFSA (0.93 ± 0.7).17 Thus, Li+ ion coordination with the nitrile groups is less pronounced in PCHOaLiTFSA. The Li+ ion was probably more preferentially coordinated with the ether groups by the absence of the steric hindrance of the ethyl groups on the main chains in PCHOaLiTFSA.
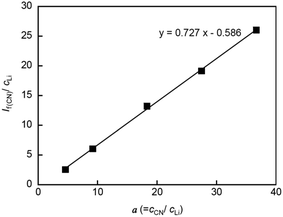 | ||
| Fig. 5 If(CN)/cLi plotted as a function of a (=cCN/cLi) for PCHOaLiTFSA. The solid line represents the least-square linear fitting. | ||
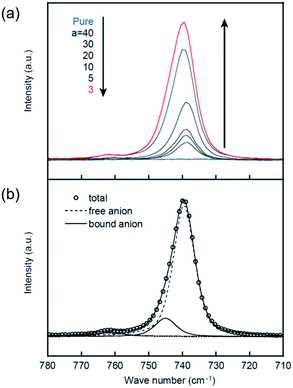
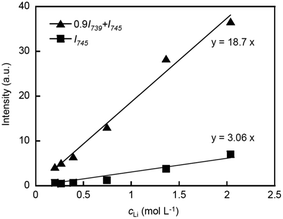
The Raman spectra corresponding to the CF3 bending vibration coupled with the S–N stretching vibration of the TFSA anion are shown in Fig. 6. To investigate the Li+ ion coordination with the TFSA anions, these Raman spectra were further deconvoluted into two peaks at 739 and 745 cm−1 using the same method as that used in the previous work.17 The peak at 739 cm−1 can be assigned to TFSA in the form of a free or solvent separated ion pair, whereas the peak at 745 cm−1 corresponds to TFSA directly bound to Li+ ions in the form of a contact ion pair or aggregates. The respective peak intensities (I739(TFSA) and I745(TFSA)) were used to determine the coordination number of TFSA anions (nTFSA) according to the following equations,34
| 0.9I739(TFSA) + I745(TFSA) = J745(TFSA)cLi | (4) |
| I745(TFSA) = J745(TFSA)nTFSAcLi | (5) |
As shown in Fig. 7, a relatively good linear relationship is obtained for both cases, and the coordination number for PCHOaLiTFSA is estimated as nTFSA = 0.16 ± 0.01 using the two linear fitting results. This value is nearly half the reported nTFSA value for PCEOaLiTFSA (0.30 ± 0.04).17 The Raman spectra corresponding to the ether groups (800–900 cm−1) are very complicated because various vibrational modes are involved in this range; therefore, the coordination number of the ether groups could not be determined from the spectroscopic analysis. Given the total coordination number of Li+ ions (generally 4–5)35,36 and the values of nCN and nTFSA, more ether groups on the main chains can be anticipated to coordinate to Li+ ions in PCHOaLiTFSA than in PCEOaLiTFSA. This can form a cross-linked structure based on the main chains in PCHOaLiTFSA, which is consistent with the experimental observations: Tg increases with the addition of Li salt (Fig. 2) and the slightly higher values for the B parameter for ionic conduction (Table 2). The ethyl groups in PCEO likely sterically hinder Li+ ion coordination with the ether groups, which promotes Li+ ion coordination with the nitrile side chains and TFSA anions, as evidenced by the larger nCN and nTFSA values for PCEOaLiTFSA.
 | ||
| Fig. 7 If(CN)/cLi plotted as a function of a (=cCN/cLi) for PCHOaLiTFSA. The solid line represents the least-square linear fitting. | ||
3.4 Li+ ion transference number
To elucidate the transport properties of the Li+ ions in each PE, the transference number (tLi+) was measured using an electrochemical method.19 As this value increases beyond 0.5, Li+ migration proceeds at a faster rate relative to TFSA anions in the PEs. The experimental data are shown in the ESI (Fig. S3 and S4†). tLi+ values of 0.59 and 0.40 are obtained for PCEO5LiTFSA and PCHO5LiTFSA, respectively. The lower tLi+ value for PCHO5LiTFSA indicates that the migration of Li+ ions is more restricted in PCHO5LiTFSA, and corroborates the more-pronounced coordination with the ether groups, whereby the mobility of Li+ ions is coupled with the segmental motion of the ether main chains. The tLi+ values for PCEO5LiTFSA and PCHO5LiTFSA are much larger than those for typically studied PEs, such as PEOaLiTFSA (typically < 0.2).37,38 Li+ ion exchange occurs more frequently between the mono-dentate nitrile side chains and the counter anions than between the multidentate polyethers on the main chains; therefore, the Li+ ion can travel more effectively via side chain coordination and site exchange.3.5 Charge/discharge tests
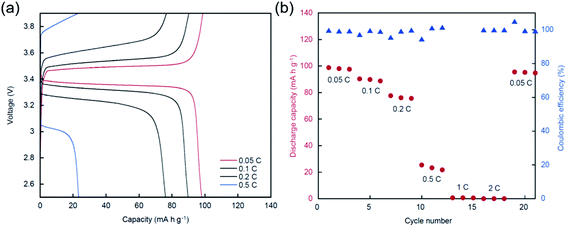
Based on the comparative study shown above, we found that PCEO5LiTFSA exhibits higher Li+ ion transport properties. Here, we assembled a lithium-ion half-cell, Li|PCEO5LiTFSA|LiFePO4, with PCEO5LiTFSA as an electrolyte to study whether the polyoxetane–PEs are indeed applicable to Li secondary batteries. No capacity was observed at 30 °C even at very low charge–discharge rate (0.05C), probably due to low ionic conductivity of PCEO5LiTFSA. The preliminary charge/discharge test from 2.5–4.0 V at 70 °C causes an unexpected charging plateau and an apparent overcharge is observed around 3.95 V (Fig. S5†). We previously reported that the electrochemical window of PCEO5LiTFSA is ∼4.0 V vs. Li/Li+ on stainless steel electrodes.17 This indicates the oxidative decomposition of PCEO5LiTFSA on the cathode at this potential. Therefore, a further charge/discharge test was performed in the range of 2.5–3.9 V at 70 °C. The charge–discharge curves and cycle performance with different charge–discharge rates are shown in Fig. 8. The obtained capacities are approximately 100 mA h g−1, even with a low charge–discharge current density at 0.05C, and are much lower than the theoretical capacity of LiFePO4 (170 mA h g−1). This is predominantly due to the insufficient electrode/electrolyte interface in the composite cathode, even though PCEO5LiTFSA is combined with the composite cathode as the co-binder. To construct better electron/ion pathways, the material composition and the fabrication procedure of the cathode must be further optimized. With an increasing charge–discharge rate, the capacity drastically decreases and the overvoltage increases. In particular, almost no capacity is delivered at rates above 1C. This is probably caused by the low ionic conductivity of PCEO5LiTFSA. However, the cell shows a relatively stable cycle performance with only a slight capacity loss at the same rate and high coulombic efficiency of ∼99.5%, suggesting that the electrochemical reaction at the positive electrolyte (LiFePO4 ⇄ FePO4 + Li+ + e−) is highly reversible in PCEO5LiTFSA. Thus, these results suggest that the polyoxetane-based PEs with nitrile functionality are applicable to Li secondary batteries.4. Conclusions
The steric effect of the ethyl group of polyoxetane-based PEs with nitrile side chains was clarified by comparing the thermal properties, Li+ ion coordination, and ion transport properties of PCHOaLiTFSA and PCEOaLiTFSA. As the Li salt concentration increased, Tg increased for PCHOaLiTFSA; this behavior is analogous to that of well-studied PEO-based PEs. Conversely, Tg decreased with increasing salt concentrations for PCEOaLiTFSA. Correspondingly, the ionic conductivity of PCHOaLiTFSA was lower than that of PCEOaLiTFSA in the high salt concentration region, mainly because of the higher micro-viscosity. The Li+ ion coordination structure was investigated using Raman spectroscopy, which revealed that the mixed coordination with ether groups, nitrile side chains, and TFSA anions occurred in both PCHOaLiTFSA and PCEOaLiTFSA; however, the ether groups were more prone to coordinating with Li+ ions in PCHOaLiTFSA. The more preferential Li+ ion coordination with the ether groups resulted in a more pronounced cross-linking of the main chains with Li+ ions, leading to an increase in Tg and less effective Li+ ion transport (i.e., lower conductivity and tLi+) in PCHOaLiTFSA. In other words, the ethyl group played a pivotal role in enhancing the Li+ ion transport by sterically inhibiting Li+ ion coordination with the ether main chains of the polyoxetanes. In addition, the Li–LiFePO4 cell using PCEO5LiTFSA showed a reversible charge–discharge with a relatively stable cycle ability and high coulombic efficiency. Although the conductivity values of PCHOaLiTFSA and PCEOaLiTFSA (on the order of 10−6 to 10−5 S cm−1 at 30 °C) were not sufficient for practical applications in solid-state Li secondary batteries, this work could provide insight into the molecular design of PEs for pursuing a high ionic conductivity at a level comparable to that of liquid electrolytes, in association with a high Li+ ion transference number that rivals that of inorganic solid electrolytes.Conflict of interest
There are no conflicts to declare.Acknowledgements
This study was supported by JSPS KAKENHI (No. 16H06053 for KU and No. 16H04647 for HT).References
- K. S. Ngai, S. Ramesh, K. Ramesh and J. C. Juan, Ionics, 2016, 22, 1259–1279 CrossRef CAS.
- C. Sun, J. Liu, Y. Gong, D. P. Wilkinson and J. Zhang, Nano Energy, 2017, 33, 363–386 CrossRef CAS.
- Y. Kato, S. Hori, T. Saito, K. Suzuki, M. Hirayama, A. Mitsui, M. Yonemura, H. Iba and R. Kanno, Nat. Energy, 2016, 1, 16030 CrossRef CAS.
- Y. Zhang, J. Lai, Y. Gong, Y. Hu, J. Liu, C. Sun and Z. L. Wang, ACS Appl. Mater. Interfaces, 2016, 8, 34309–34316 CAS.
- E. Quartarone and P. Mustarelli, Chem. Soc. Rev., 2011, 40, 2525–2540 RSC.
- L. Long, S. Wang, M. Xiao and Y. Meng, J. Mater. Chem. A, 2016, 4, 10038–10069 CAS.
- M. Tatsumisago, M. Nagao and A. Hayashi, J. Asian Ceram. Soc., 2013, 1, 17–25 CrossRef.
- P. V. Wright, Br. Polym. J., 1975, 7, 319–327 CrossRef CAS.
- D. E. Fenton, J. M. Parker and P. V. Wright, Polymer, 1973, 14, 589 CrossRef CAS.
- D. W. Dees, V. S. Battaglia and A. Bélanger, J. Power Sources, 2002, 110, 310–320 CrossRef CAS.
- J. B. Kerr, S. E. Sloop, G. Liu, Y. B. Han, J. Hou and S. Wang, J. Power Sources, 2002, 110, 389–400 CrossRef CAS.
- M. A. Webb, B. M. Savoie, Z.-G. Wang and T. F. Miller III, Macromolecules, 2015, 48, 7346–7358 CrossRef CAS.
- H. Tsutsumi and A. Suzuki, Solid State Ionics, 2014, 262, 761–764 CrossRef CAS.
- R. Shibutani and H. Tsutsumi, J. Power Sources, 2012, 202, 369–373 CrossRef CAS.
- Y. Nakano and H. Tsutsumi, Solid State Ionics, 2014, 262, 774–777 CrossRef CAS.
- Y. Shintani and H. Tsutsumi, J. Power Sources, 2010, 195, 2863–2869 CrossRef CAS.
- R. Sai, K. Ueno, K. Fujii, Y. Nakano, N. Shigaki and H. Tsutsumi, Phys. Chem. Chem. Phys., 2017, 19, 5185–5194 RSC.
- K. Kubota, K. Tamaki, T. Nohira, T. Goto and R. Hagiwara, Electrochim. Acta, 2010, 55, 1113–1119 CrossRef CAS.
- J. Evans, C. A. Vincent and P. G. Bruce, Polymer, 1987, 28, 2324–2328 CrossRef CAS.
- E. Pérez, M. A. Gómez, A. Bello and J. G. Fatou, Colloid Polym. Sci., 1983, 261, 571–576 Search PubMed.
- M. Perrier, S. Besner, C. Paquette, A. Vallée, S. Lascaud and J. Prud'homme, Electrochim. Acta, 1995, 40, 2123–2129 CrossRef CAS.
- M. Forsyth, J. Sun and D. R. Macfarlane, Solid State Ionics, 1998, 112, 161–163 CrossRef CAS.
- K. Kimura, J. Motomatsu and Y. Tominaga, J. Phys. Chem. C, 2016, 120, 12385–12391 CAS.
- R. G. Larson, The Structure and Rheology of Complex Fluids, OUP, USA, 1999 Search PubMed.
- R. P. White and J. E. G. Lipson, Macromolecules, 2016, 49, 3987–4007 CrossRef CAS.
- R. Bouchet, S. Maria, R. Meziane, A. Aboulaich, L. Lienafa, J.-P. Bonnet, T. N. T. Phan, D. Bertin, D. Gigmes, D. Devaux, R. Denoyel and M. Armand, Nat. Mater., 2013, 12, 452–457 CrossRef CAS PubMed.
- L. Porcarelli, C. Gerbaldi, F. Bella and J. R. Nair, Sci. Rep., 2016, 6, 19892 CrossRef CAS PubMed.
- S. Choudhury, R. Mangal, A. Agrawal and L. A. Archer, Nat. Commun., 2015, 6, 10101 CrossRef CAS PubMed.
- A. Vallée, S. Besner and J. Prud'Homme, Electrochim. Acta, 1992, 37, 1579–1583 CrossRef.
- L. Edman, M. M. Doeff, A. Ferry, J. Kerr and L. C. De Jonghe, J. Phys. Chem. B, 2000, 104, 3476–3480 CrossRef CAS.
- K. B. M. Isa, Z. Osman, A. K. Arof, L. Othman, N. H. Zainol, S. M. Samin, W. G. Chong and N. Kamarulzaman, Solid State Ionics, 2014, 268, 288–293 CrossRef CAS.
- C. D. Robitaille and D. Fauteux, J. Electrochem. Soc., 1986, 133, 315–325 CrossRef CAS.
- S. Das and A. Ghosh, J. Appl. Phys., 2015, 117, 174103 CrossRef.
- Y. Umebayashi, T. Mitsugi, S. Fukuda, T. Fujimori, K. Fujii, R. Kanzaki, M. Takeuchi and S.-I. Ishiguro, J. Phys. Chem. B, 2007, 111, 13028–13032 CrossRef CAS PubMed.
- W. A. Henderson, N. R. Brooks and V. G. Young, J. Am. Chem. Soc., 2003, 125, 12098–12099 CrossRef CAS PubMed.
- Y. Kameda, Y. Umebayashi, M. Takeuchi, M. A. Wahab, S. Fukuda, S.-i. Ishiguro, M. Sasaki, Y. Amo and T. Usuki, J. Phys. Chem. B, 2007, 111, 6104–6109 CrossRef CAS PubMed.
- K. Timachova, H. Watanabe and N. P. Balsara, Macromolecules, 2015, 48, 7882–7888 CrossRef CAS.
- M. Chintapalli, K. Timachova, K. R. Olson, S. J. Mecham, D. Devaux, J. M. DeSimone and N. P. Balsara, Macromolecules, 2016, 49, 3508–3515 CrossRef CAS.
Footnotes |
| † Electronic supplementary information (ESI) available. See DOI: 10.1039/c7ra07636c |
| ‡ Present address: Department of Materials and Life Sciences, Sophia University, 7-1 Kioi-cho, Chiyoda-ku, Tokyo, 102-8554, Japan. |
| This journal is © The Royal Society of Chemistry 2017 |

