DOI:
10.1039/C7RA04828A
(Paper)
RSC Adv., 2017,
7, 35827-35831
Manipulation and analysis of an optofluidic multiphase microlens†
Received
29th April 2017
, Accepted 11th July 2017
First published on 19th July 2017
Abstract
An optofluidic microlens was investigated in this study by using a gas–liquid interface, and the underlying physics of the microlens formation was exploited by considering fluid parameters that control the shape of the microlens. A microfluidic device was designed and fabricated to secure a stable multiphasic interface in the channel. A theoretical model based on the coupled Stokes–Cahn–Hilliard equations was proposed to understand the characteristics of the lens formation in the device. The results show that nonlinear flow behavior near the gas–liquid interface affects the interface shape due to the effect of surface tension, and the extent of the lens symmetry is inversely proportional to the product of the capillary number (Ca) and Reynolds number (Re).
Introduction
Optofluidics, an interdisciplinary research of optics and microfluidics, is being rapidly developed for various applications.1–3 The optofluidic platform, in general, employs single or multiple fluidic flows to manipulate or guide light at the microscale.4 The optofluidic microlens has emerged as a promising optical component due to its advantages over the solid microlens, e.g., wide tunable range and optically smooth interfaces by means of the hydrodynamic tuning mechanism, the ease in changing optical properties with different lens materials, and the simple fabrication and integration of the device. Recently, a few studies have demonstrated the tunable optofluidic microlens using liquid–liquid5–9 or gas–liquid interfaces.10,11 They have shown considerable performance in experiments and carried out fluid simulation to analyze the lens shape according to the microchannel geometry or flow conditions. For instance, Seow et al. simulated the stream flow with different aspect ratios of the expansion chamber to obtain an optimum design of the chamber for a stable lens interface.7 Rosenauer et al. predicted the lens shape with symmetric and asymmetric expansion chambers at different flow rate conditions to verify that the fabricated chamber achieved the symmetric lens shape.8 However, theoretical studies of the optofluidic microlens generated by the interface formation under the multiphase flow are still limited.
In this letter, a tunable optofluidic microlens that utilizes the gas–liquid flow in a symmetric expansion chamber is reported. The characteristics of the lens are analyzed by controlling the inlet pressures of the liquid flow and gas flow. Moreover, numerical and theoretical analyses are conducted to figure out the formation mechanism of asymmetric and symmetric lens surfaces and relevant physics governing the interface formation. For the theoretical model, the Stokes–Cahn–Hilliard equation is non-dimensionalized, and material and operational parameters, such as the average flow rate (uavg), dynamic viscosity (μ), density (ρ), surface tension coefficient (σ), and characteristic length (L), are analyzed based on the theoretical evaluation. In addition, the lens characteristics such as the lens curvature, thickness, and focal length in the microfluidic device are examined by performing optical observation and ray-tracing simulation. The schematic configuration of the microfluidic set-up is shown in Fig. 1.
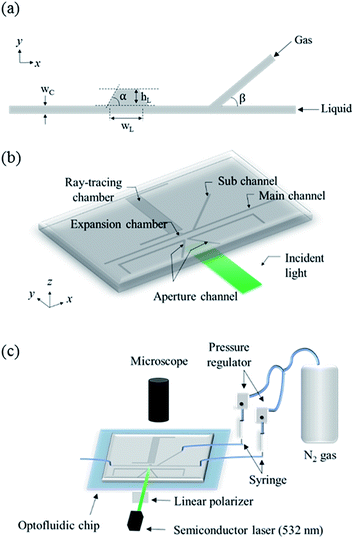 |
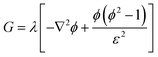
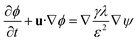
| | Fig. 1 (a) Schematic illustration of top view of the microchannel used for experiment and simulation. The channel width (wC) is 200 μm, the width (wL) and the height (hL) of the expansion chamber are 1000 μm and 400 μm, respectively, and the channel thickness is 25 μm. The inclination angle of the chamber wall (α) is 60°, and the angle between the main channel and the sub-channel (β) is 40°. (b) Schematic configuration of the optofluidic device. (c) Experimental set-up for optical observation. | |
Numerical and theoretical analyses
Numerical analysis
Two-dimensional numerical simulation of the two phase flow is conducted for the numerical modeling of the gas–liquid interface of the lens. The coupled Navier–Stokes–Cahn–Hilliard equations are solved using COMSOL Multiphysics®.12–15 The two phases are separated by a diffuse interface, and the interface position is tracked by solving two additional transport equations for the phase field. The fluids are assumed to be incompressible. The inertia and gravity effects are neglected for the fluid flow in the microchannel. The surface tension at the gas–liquid interface is considered in the momentum equation as shown below.| | |
0 = ∇·[−pI + μ(∇u + (∇u)T] + Fst
| (1) |
| |
 | (3) |
| |
 | (4) |
| |
 | (5) |
| | |
ψ = −∇·ε2∇ϕ + (ϕ2 − 1)ϕ
| (6) |
where Fst is the surface tension force, ∇ is the del operator, p is the pressure, I is the identity tensor, μ is the dynamic viscosity, u is the flow velocity, ϕ is the dimensionless phase field variable, ψ is the phase field help variable, λ is the mixing energy density, and ε is the interface thickness parameter. The Stokes equation is coupled with the convective Cahn–Hilliard equation. The convective Cahn–Hilliard equations track a diffuse interface, which is defined as the region where the phase field ϕ is varied from −1 to 1. The dynamic viscosity is determined by the calculated ϕ.
Theoretical analysis
Theoretical analysis is carried out to provide in-depth understanding of the multiphasic microlens formation. The Stokes equation and the convective Cahn–Hilliard equation are nonlinear due to the surface tension force term Fst and the inertia term u·∇ϕ respectively. The characteristics of the microlens is determined by the combination of the non-linear eqn (1) and (5). Since the value of ϕ of the convective Cahn–Hilliard equation interactively changes the surface tension force of the Stokes equation, the microlens formation is affected. Basically, the shape and position of the lens interface are determined from the hydrodynamic force balance of fluid. In this regard, the Stokes equation is non-dimensionalized using the dimensionless differential operator and variables: ∇* = L∇, p* = (p − p∞)/(p0 − p∞), and u* = u/uavg.| |
 | (7) |
where L is the characteristic length, p0 − p∞ is the reference pressure difference and uavg is the average flow velocity. Eqn (7) still has a dimension of mL−2t−2, where m, L and t represent the mass, length, and time, respectively. Therefore, the equation is multiplied by Lρ−1uavg−2, and ρ was replaced with μ/v. The final non-dimensionalized equation is as follows.| |
 | (8) |
where the dimensionless numbers, the Euler number (Eu), Reynolds number (Re), and capillary number (Ca), are expressed as Eu = (p0 − p∞)/ρuavg2, Re = ρuavgL/μ, and Ca = μuavg/σ, respectively. As mentioned above, the last term of eqn (8) offers the nonlinearity of the Stokes equation. Thus, the nonlinear phenomena of multiphase fluid, such as asymmetry and singularity, rely upon Ca and Re. This implies that the resulting nonlinearity decreases as product of Ca and Re increases. It is, therefore, expected that a liquid with a high product value of Ca and Re would generate a symmetric microlens interface in the symmetric expansion chamber.
Experimental section
Design and fabrication of the optofluidic chip
An optofluidic device was fabricated using a soft-lithography process with polydimethyl-siloxane (PDMS, Sylgard 184, Dow Corning, Midland, U.S.A.). A detailed process of fabricating a master is explained elsewhere,9 and a cured PDMS replica from the master was attached to the glass substrate by corona treatment. The device consisted of a flow channel, aperture channels, and a ray-tracing chamber. The flow channel was composed of a main channel, sub-channel, and symmetric expansion chamber as shown in Fig. 1(b).
Materials
The aperture channels were filled with black ink, and a fluorescent dye solution, 3 μmol L−1 of rhodamine B (Sigma-Aldrich) dissolved in ethylene glycol, was used for the ray-tracing chamber to observe the ray-path. In the experiments, isopropyl alcohol (IPA) and nitrogen gas (N2) were injected through the main channel and sub-channel, respectively, to form the symmetric microlens in the expansion chamber. Two other liquids, benzyl alcohol (BA) and ethylene glycol (EG), were also tested as the main fluid to find a proper lens material, but both liquids showed an asymmetric lens shape. The material properties are listed in Table 1.
Table 1 Material properties of N2, IPA, BA, EG, and PDMS
| Material |
Property |
| Dynamic viscosity (μ, × 10−3 Pa s) |
Density (ρ, kg m−2) |
Surface tension (σ, mN m−1) |
Refractive index (n) |
| N2 |
0.01747 |
1.2754 |
— |
1.0003 |
| IPA |
1.96 |
786 |
23 |
1.3776 |
| BA |
5.474 |
1044 |
39 |
1.5396 |
| EG |
16.2 |
1110 |
47 |
1.43 |
| PDMS |
— |
— |
— |
1.4 |
Experimental set-up
The inlet pressure of the main fluids (Pmain) was varied from 20 kPa to 26 kPa, whereas that of the sub-fluid (Psub) was fixed at 20 kPa using a digital pressure regulator (DPG8001-60, OMEGA, Stamford, U.S.A.). The light source was a semiconductor laser (PGL-FS-532, CNI Optoelectronics Technology CO., Ltd, Jilin, China) with a 532 nm wavelength, and a dichroic linear polarizer was employed for polarization of the light. The lens interface and ray-path were observed using optical microscopy.9
Results and discussion
Shapes of the gas–liquid interfaces
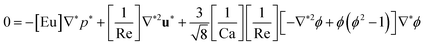
The lens shape was examined experimentally and numerically for three different liquids as shown in Fig. 2. The main stream and sub-stream flowed in the left-hand direction. It was found that the experimental and numerical results were in good agreement for the three liquids. The interface between the streams of N2 and IPA was nearly symmetric but the interfaces between the streams of N2 and BA, and of N2 and EG were asymmetric. The asymmetry of the interface also increased in the order of IPA, BA, and EG at all the pressure levels. The lens thickness increased as the pressure applied to the main fluid increased. Generation of the symmetric lens is of great importance to secure a high performance. Furthermore, it is essential to fabricate a microlens with a longitudinally tunable focal length. For these reasons, IPA was selected in this study as the main liquid to form the symmetric microlens.
 |
| | Fig. 2 Images of the gas–liquid interfaces for three liquids at different pressures: (a) microscopic images and (b) simulation results. The simulated interfaces (blue curves) are superposed onto the experimental microscopic images for comparison. | |
Non-linear surface tension effect on the lens shape
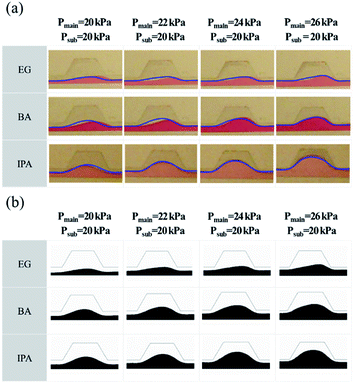
To understand the lens formation in a more systematic manner, the asymmetry of lens was evaluated using the dimensionless numbers presented above. Ca and Re values were calculated from the experimental conditions for the three liquids at each pressure level. It was inferred that the product value of Ca and Re significantly affected the shape formation of the lens. Fig. 3(a) shows the measured average velocities used for the calculation. The dimensionless numbers, Ca and Re, were found quite small at all the pressure levels as presented in Fig. 3(b) and (c). The small values of Re (Re ≪ 1) indicate the laminar flow in the microchannel (Fig. 3(b)), and the small values of Ca (Ca ≪ 1) for all the liquids imply that the surface tension effect is dominant over the viscous effect at the gas–liquid interface (Fig. 3(c)).16 The results of Ca × Re are plotted in Fig. 3(d). It was shown that IPA offered the most symmetric lens shape with the largest value of Ca × Re in all the pressure levels, which could explain the lens shape obtained both experimentally and numerically. In short, as the product value of Ca and Re increases, the interface becomes more symmetric. This quantitative analysis revealed that the Ca × Re, i.e., ρuavg2L/σ acts as a key factor for determining the shape of microlens in the microfluidic device. Since the Ca × Re depends on the dynamic viscosity and uavg is a function of the viscosity, the shape formation of the lens is affected by the fluid parameters, such as the density, dynamic viscosity, and surface tension of the main fluid as well as the imposed pressure. To the best of our knowledge, this is the first report to explore the shape formation of optofluidic microlens in the microfluidic channel by considering quantitative theoretical and numerical evaluation.
 |
| | Fig. 3 (a) Measured average velocities, (b) Reynolds numbers, (c) capillary numbers, and (d) product values of capillary numbers and Reynolds numbers for three liquids with respect to pressures. | |
Characteristics of the microlens
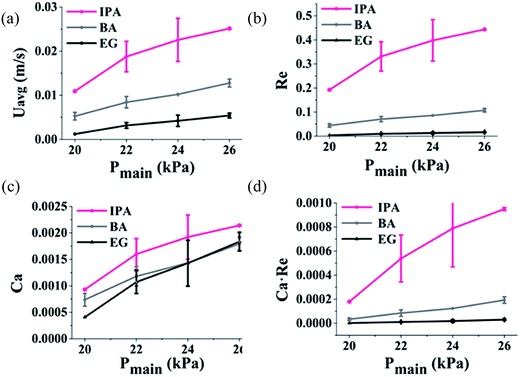
The hydrodynamic microlens formed by the streams of N2 and IPA was characterized through optical evaluation. The tunability of the lens was analyzed using the ray-path in fluorescence images in the expanded range of the inlet pressure from 16 kPa to 26 kPa to see the available pressure range, as presented in Fig. 4(a). The focal length (f) was defined as the distance between the flat bottom line of the expansion chamber and the focal point. The focal length decreases with increasing Pmain until Pmain becomes 24 kPa. Therefore, it turns out that the proper pressure range for the focus tuning is between 16 kPa and 24 kPa. Fig. 4(b) shows the gray-scaled images of the unfocused beam and focused beam, and Fig. 4(c) presents the light intensity profiles at the positions indicated in the gray-scaled images. The light intensity is zero outside of the positions from −0.2 mm to 0.2 mm for the unfocused beam (A, B), which indicates that the apertures completely block the incident light.
 |
| | Fig. 4 (a) Schematic illustration of the ray-path observation and fluorescence images of the ray paths at different pressures. (b) Gray-scaled images of ray paths. The pressures applied for the main stream and sub-stream were all 20 kPa for the focused beam. The dashed and solid lines indicate the positions where light intensity profiles were evaluated. (c) Light intensity profiles evaluated along the lines. The dashed lines (A and B) and solid lines (B′ and C) indicate the light intensity profile for unfocused beam and focused beam, respectively. | |
The enhancement factor, defined as the ratio of the peak intensity of a focused beam (B′) to the intensity of an unfocused beam (B), is measured to be 4.07.6 The characteristics of the optofluidic lens obtained from the experimental and numerical results are illustrated in Fig. 5. The curvature (1/R) and the lens thickness (t) were determined by fitting a circle to the gas–liquid interface acquired from the experiment and simulation. The curvature has a maximum value at Pmain = 24 kPa, and then declines as the pressure increases because the lens interface approaches the wall of the expansion chamber at above 24 kPa (see Fig. S1† in the ESI).6,9 The experimental results showed that the tunable focal length between 1.60 mm and 3.15 mm could be manipulated in the microfluidic device fabricated in this study, as presented in Fig. 5(c). A ray-tracing code was developed based on MATLAB®, and the curvature and lens thickness obtained from the simulation results were employed to predict the focal length numerically (see Fig. S2† in the ESI). The overall trends of the experimental and simulation results were similar, but a slight discrepancy was observed in the case of the focal length at lower inlet pressure because aspherical microlens shape was obtained in the experiment unlike the spherical shape calculated in the simulation. The aspherical microlens leads to decrease in the refraction of light and then increase in the focal length (see Fig. S1 and S3† in the ESI).
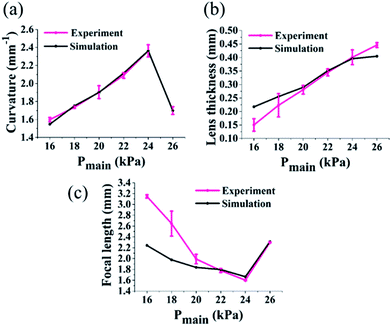 |
| | Fig. 5 Comparison of the lens characteristics obtained from simulation and experimental results: (a) curvatures, (b) lens thickness, and (c) focal lengths as a function of the pressure of mainstream. | |
Conclusions
In the current study, various shapes of the microlens based on the gas–liquid interface were investigated from the experimental and numerical results, and the lens formation in the microfluidic device was analyzed by a theoretical model. The Stokes–Cahn–Hilliard equation is non-dimensionalized, and the effect of liquid properties on the lens shape was evaluated. The non-linearity of the surface tension needs to be considered for manipulating the gas–liquid flow in a controlled way in that the non-linear surface tension effect becomes dominant at the gas–liquid interface, especially in microfluidics (or optofluidics).17 Our theoretical analysis demonstrated that the interface shape of the lens was determined by the fluid properties as well as the inlet pressure applied to the microfluidic device. In addition, the microlens based on the gas–liquid interface has an advantage of a relatively short focal length due to the large distinction of the refractive indices across the interface, which is critical for the real application in optofluidics.18,19 It is expected that this study will provide a way for manipulating the multiphasic microlens based on the comprehensive understanding on the lens formation within the microfluidic device.
Conflict of interest
There are no conflicts of interest to declare.
Acknowledgements
This work was supported by the Commercializations Promotion Agency for R&D Outcomes (COMPA) funded by the Ministry of Science, ICT and Future Panning (MISP). In addition, it was supported by the Industrial Strategic Technology Development Program funded by the Ministry of Trade, Industry and Energy (MI, Korea) [10052641]. The authors are grateful for the support.
References
- Y. Yang, A. Liu, L. Chin, X. Zhang, D. Tsai, C. Lin, C. Lu, G. Wang and N. Zheludev, Nat. Commun., 2012, 3, 651 CrossRef CAS PubMed.
- C. Monat, P. Domachuk and B. Eggleton, Nat. Photonics, 2007, 1, 106–114 CrossRef CAS.
- N.-T. Huang, H.-l. Zhang, M.-T. Chung, J. H. Seo and K. Kurabayashi, Lab Chip, 2014, 14, 1230–1245 RSC.
- X. Zeng and H. Jiang, J. Phys. D: Appl. Phys., 2013, 46, 323001 CrossRef PubMed.
- X. Mao, J. R. Waldeisen, B. K. Juluri and T. J. Huang, Lab Chip, 2007, 7, 1303–1308 RSC.
- S. K. Tang, C. A. Stan and G. M. Whitesides, Lab Chip, 2008, 8, 395–401 RSC.
- Y. Seow, A. Liu, L. Chin, X. Li, H. Huang, T. Cheng and X. Zhou, Appl. Phys. Lett., 2008, 93, 084101 CrossRef.
- M. Rosenauer and M. J. Vellekoop, Lab Chip, 2009, 9, 1040–1042 RSC.
- D. Wee, S. Hwang, Y. Song and J. Youn, Soft Matter, 2016, 12, 3868–3876 RSC.
- L. Dong and H. Jiang, Appl. Phys. Lett., 2007, 91, 041109 CrossRef.
- J. Shi, Z. Stratton, S.-C. S. Lin, H. Huang and T. J. Huang, Microfluid. Nanofluid., 2010, 9, 313–318 CrossRef CAS.
- https://www.comsol.com/model/download/318501/models.cfd.capillary_filling_pf.pdf.
- H. Tian, J. Shao, Y. Ding, X. Li and H. Liu, Langmuir, 2013, 29, 4703–4714 CrossRef CAS PubMed.
- C. Y. Lim and Y. C. Lam, Microfluid Nanofluid, 2014, 17, 131–148 CrossRef CAS.
- P. K. Mondal, D. DasGupta and S. Chakraborty, Phys. Rev. E: Stat. Phys., Plasmas, Fluids, Relat. Interdiscip. Top., 2014, 90, 013003 CrossRef PubMed.
- M. De Menech, P. Garstecki, F. Jousse and H. Stone, J. Fluid Mech., 2008, 595, 141–161 Search PubMed.
- J.-M. Fullana, Y. Ling, S. Popinet and C. Josserand, arXiv preprint arXiv:1507.04329, 2015.
- P.-T. Lin, H.-Y. Chu, T.-W. Lu and P.-T. Lee, Lab Chip, 2014, 14, 4647–4652 RSC.
- J. Berthelot, S. S. Acimovic, M. L. Juan, M. P. Kreuzer, J. Renger and R. Quidant, Nat. Nanotechnol., 2014, 9, 295–299 CrossRef CAS PubMed.
Footnote |
| † Electronic supplementary information (ESI) available. See DOI: 10.1039/c7ra04828a |
|
| This journal is © The Royal Society of Chemistry 2017 |
Click here to see how this site uses Cookies. View our privacy policy here. 
 Open Access Article
 This Open Access Article is licensed under a
  *a and
Y. S. Song*b
*a and
Y. S. Song*b


